---
title: "Custom Label Intelligence: Segment, Bid, and Measure Granularity In Google Shopping"
description: "Custom Label Intelligence for Google Shopping: a five-slot label schema, label-level dashboards and an experimentation ladder for Shopping and Performance Max."
canonical: "https://www.productmetrics.io/blog/custom-labels-google-shopping"
pageType: article
language: en
publisher: "Product Metrics"
author: "Berend Vrakking"
datePublished: 2026-11-09
dateModified: 2026-11-09
image: "https://www.productmetrics.io/og/blog/custom-labels-google-shopping.png"
---
> Content index: https://www.productmetrics.io/llms.txt
# Custom Label Intelligence: Segment, Bid, and Measure Granularity In Google Shopping
## Key takeaways
- Granular performance tracking in Google Shopping and Performance Max lives or dies on how you use five small fields: `custom_label_0` to `custom_label_4`.
- Because you only get five of them, custom labels should be treated as **owned decision dimensions**, not as a dumping ground for miscellaneous tags.
- A simple three - campaign setup based on `custom_label_0`—Stars & Cash Cows; Question Marks; Dogs & Drainers—already creates very different levers for budget and bid strategies.
Granular performance tracking in Google Shopping and Performance Max lives or dies on how you use five small fields: `custom_label_0` to `custom_label_4`.
Used well, they become a control panel for:
- Segmenting products by performance, margin, price position, and stock
- Sending the right SKUs into the right campaigns
- Reading results at label and SKU level, not just at campaign level
Used badly—or not at all—and you’re stuck with blended [ROAS](https://www.productmetrics.io/glossary/roas "Return on ad spend (ROAS) is the revenue your ads generate for every euro you spend on them."), manual spreadsheets, and guesses about where budget is leaking.
If you’ve been searching for [tools for segmenting Google Shopping campaigns and tracking performance by custom labels](https://www.productmetrics.io/blog/google-shopping-segmentation-tracking-software), or evaluating [Google Shopping optimization platforms with advanced segmentation and granular tracking](https://www.productmetrics.io/blog/google-shopping-segmentation-platforms), this guide is for you.
This article walks through a practical system for:
- Designing a custom label schema that matches real bidding decisions
- Implementing labels 0–4 in Merchant Center and Google Ads
- Building [dashboards that track performance by label and down to SKU](https://www.productmetrics.io/blog/google-ads-performance-dashboards)
- Running a simple experimentation ladder on top of that structure
- Seeing how Product Metrics automates the heavy lifting
## 1. Custom Labels 0–4 The Switchboard For Granular Segmentation
Google Shopping and Performance Max give you five **custom label** attributes in the [product feed](https://www.productmetrics.io/glossary/product-feed "A product feed is a file or data source that lists your products, one per row, with attributes such as ID, title, price and availability."): `custom_label_0` through `custom_label_4`. Each product can hold one value per label, and those values are entirely defined by you. (Source: [Google Ads Help – Use custom labels for Shopping ads](https://support.google.com/google-ads/answer/6275295))
Google’s own docs confirm that:
- You can have **up to five custom labels per product**, numbered 0–4
- Each label holds **one value per product** (for example, `custom_label_0 = stars`)
- Labels are used to **[subdivide product groups](https://www.productmetrics.io/blog/segment-google-shopping-by-product-group)** and filters in Shopping and Performance Max campaigns, and for **monitoring, reporting, and bidding** on those groups
- Each label allows up to **1,000 unique values per account**, with basic length limits per value
(Source: [Google Ads Help – Custom labels 0–4 attribute](https://support.google.com/google-ads/answer/6275295))
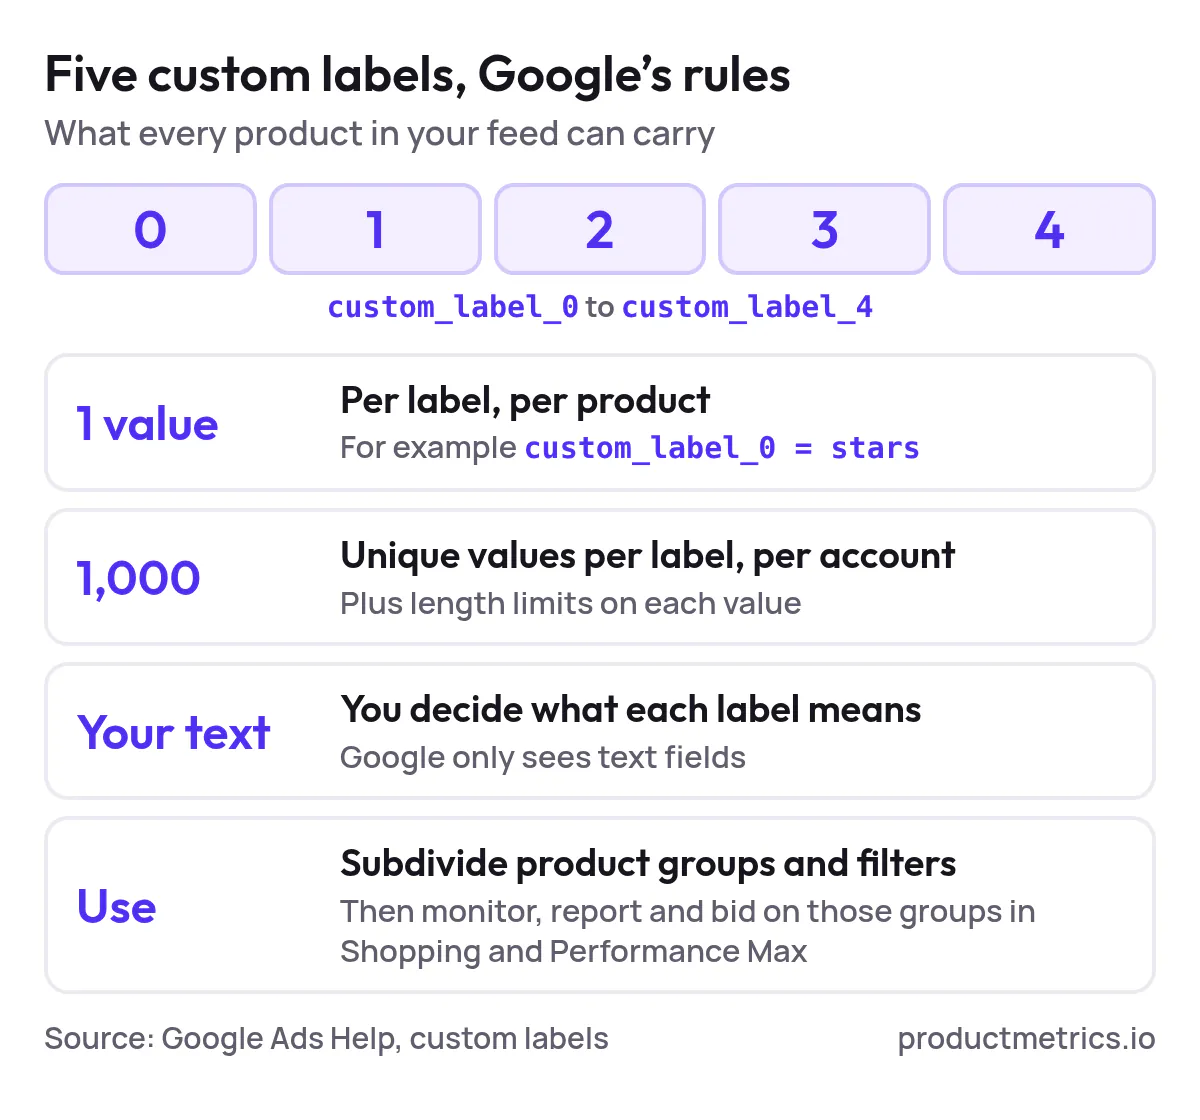
_Google gives you five text fields and a few limits; what each label means is entirely your decision._
From Google’s perspective, [custom labels](https://www.productmetrics.io/glossary/custom-labels "Custom labels are five attributes in a product feed, custom_label_0 to custom_label_4, that you fill with your own text to group products in campaigns.") are deliberately generic: they’re just text fields. What makes them powerful is the meaning you attach to them and the way you wire that meaning into campaigns and reporting.
### 1.1 Treat Labels As Owned Decision Dimensions
Because you only get five of them, custom labels should be treated as **owned decision dimensions**, not as a dumping ground for miscellaneous tags.
A good rule of thumb:
- Give each label a **single, stable meaning** across the account
- Only create values that you’re prepared to act on with **different bids, budgets, or priorities**
- Prefer **performance and economics** (how products behave in ads) over static merchandising trivia
Product Metrics’ own glossary definition matches this: custom labels are defined as five feed attributes (`custom_label_0–4`) used to group products in campaigns, with one value per label per product, and they’re explicitly recommended for things like [performance segments](https://www.productmetrics.io/product-segmentation) and stock status. (Source: [Product Metrics – Custom labels glossary](https://www.productmetrics.io/glossary/custom-labels))
## 2. A Practical Custom Label Schema For Shopping And PMax
Here is a concrete schema that works well for most ecommerce catalogs and maps cleanly to campaign decisions.
You don’t have to adopt these exact names, but the **shape**—performance first, economics second, context third—is what matters.
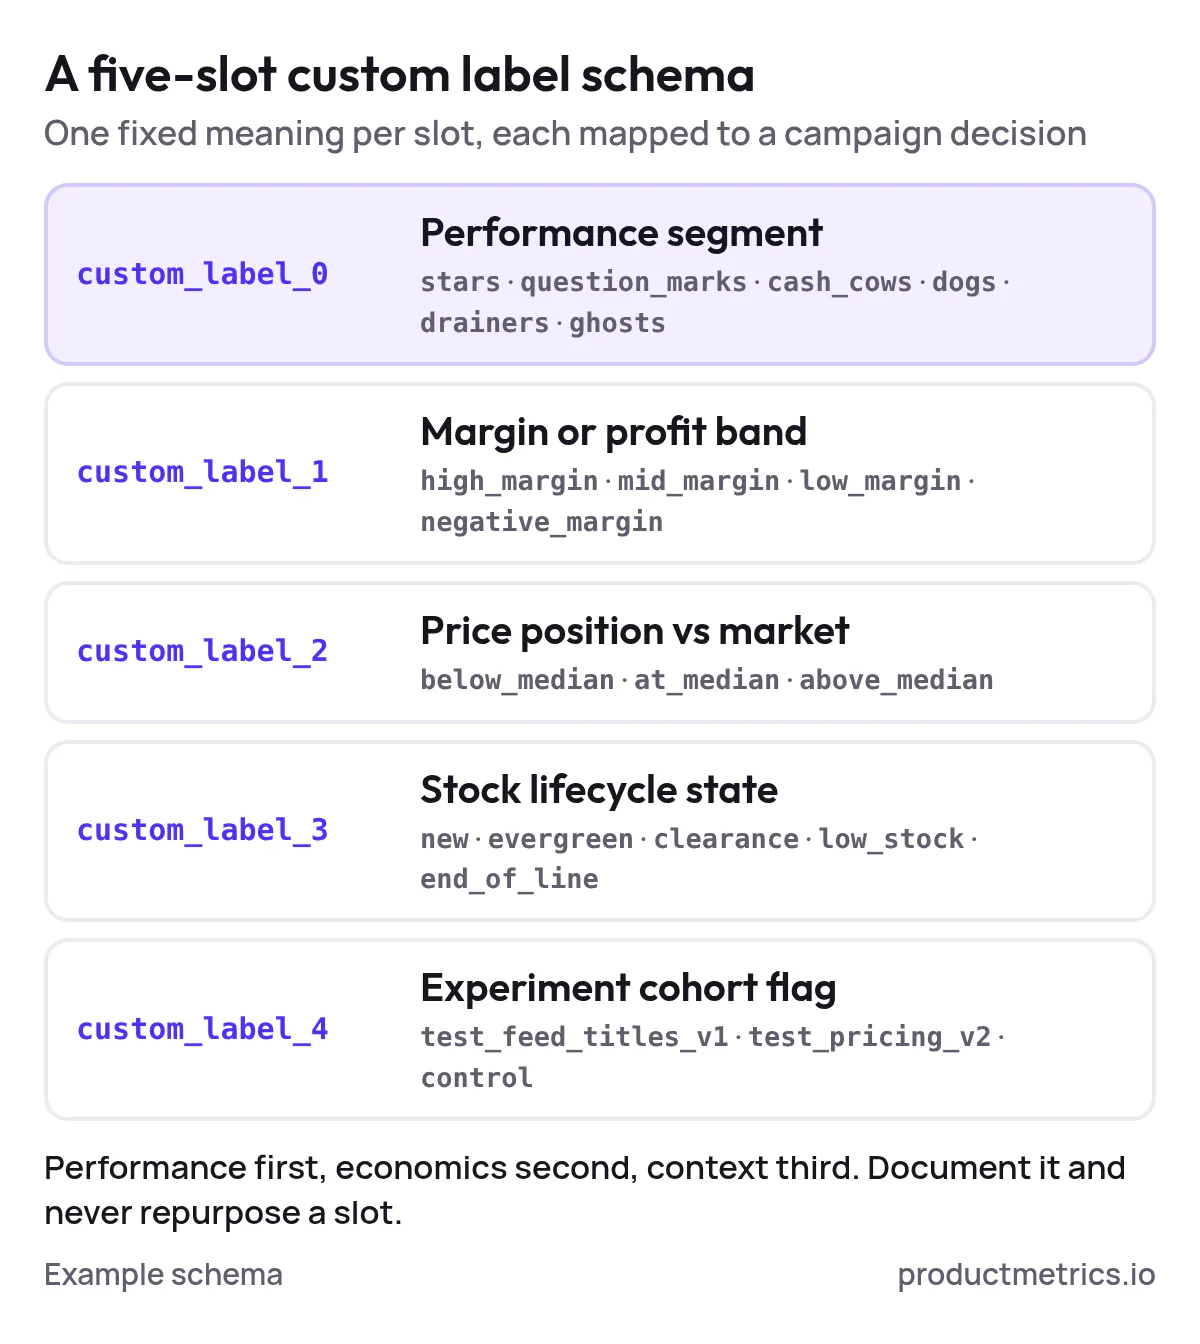
_Each slot keeps one meaning for good, so a label value always maps to the same campaign decision._
### 2.1 Suggested Schema
**`custom_label_0` – Performance Segment**
Purpose: capture how a product behaves in ads, based on click volume and return vs your [ROAS/POAS target](https://www.productmetrics.io/break-even-roas-calculator).
Example values (aligned with Product Metrics’ segmentation):
- `stars` – high volume, above target return
- `question_marks` – high volume, just under target
- `cash_cows` – low volume, above target
- `dogs` – high volume, below target
- `drainers` – low volume, no return
- `ghosts` – not serving (no impressions)
Product Metrics uses machine learning to place every product into one of these six segments based on advertising clicks and ROAS or POAS, then writes the segment into a Merchant Center custom label via a [supplemental feed](https://www.productmetrics.io/glossary/supplemental-feed "A Google Merchant Center supplemental feed is a secondary data source that adds details to, or overrides details in, the products of your primary feed."). (Source: [Product Metrics – Product Segmentation](https://www.productmetrics.io/product-segmentation))
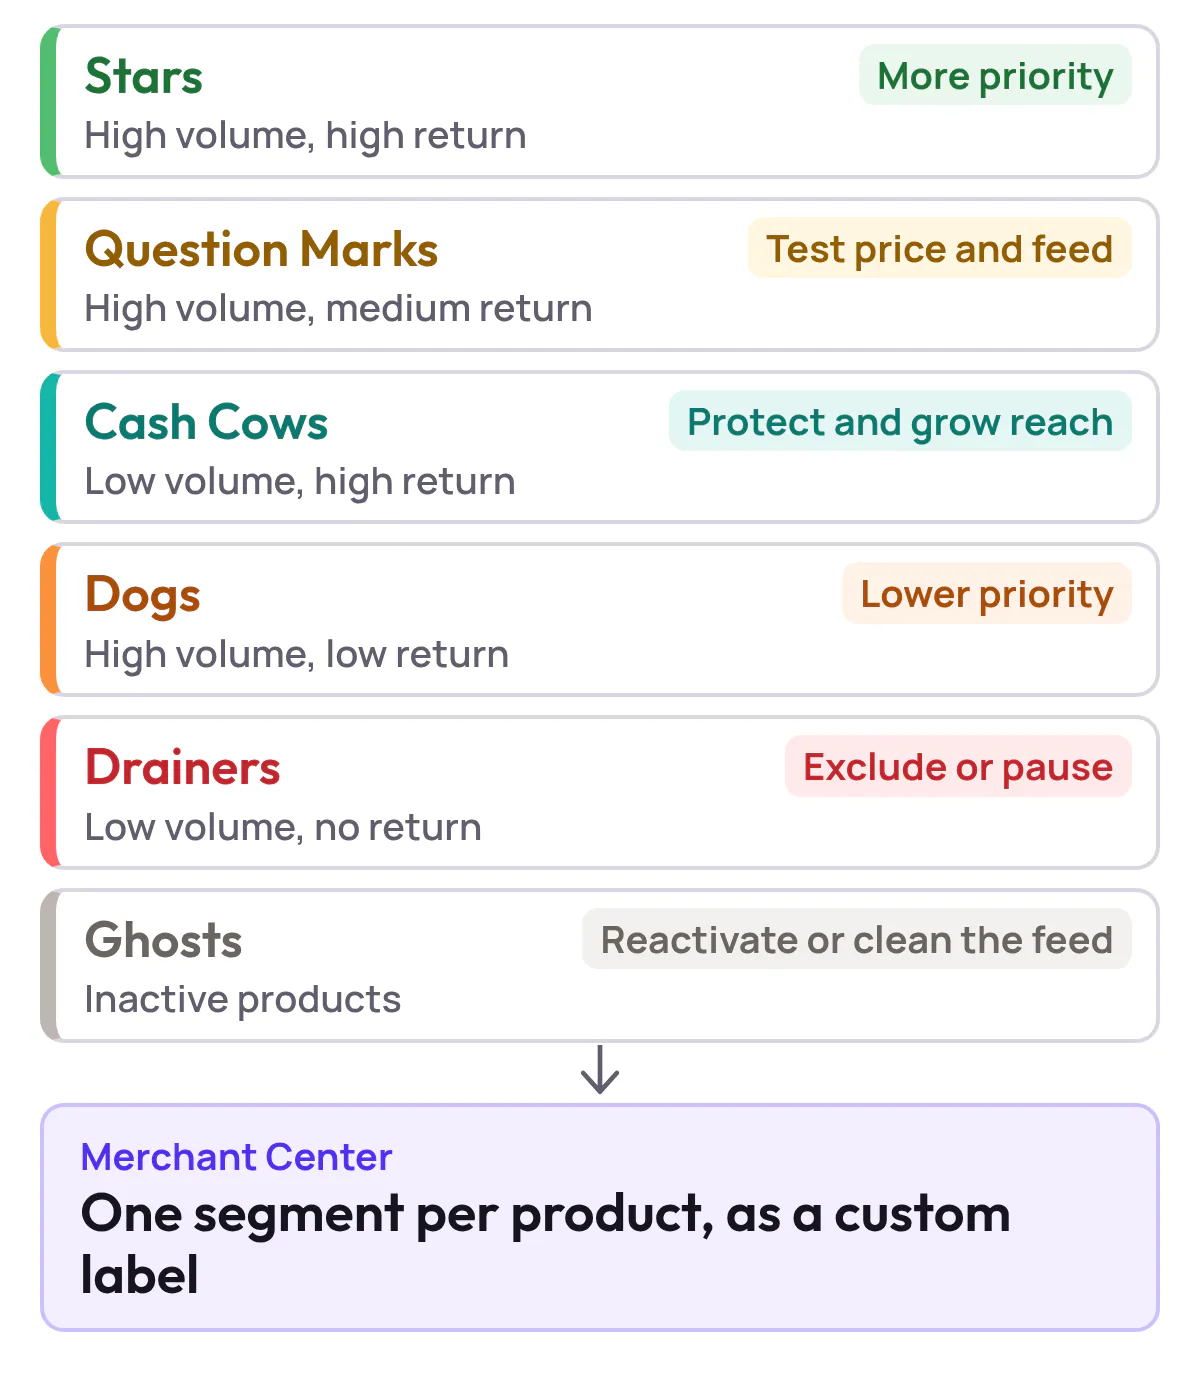
_The six segments become the values of custom_label_0, one per product, so every campaign can filter on them._
**`custom_label_1` – Margin Or Profit Band**
Purpose: distinguish between products that generate very different profit per sale.
Example values:
- `high_margin`, `mid_margin`, `low_margin`, `negative_margin`
With cost-of-goods data, segmenting by margin tiers inside a custom label is a standard recommendation for making bids profit-aware rather than revenue-only. (Source: [FeedArc – Custom labels from GA4 performance](https://www.feedarc.com/guides/custom-labels-from-ga4-performance))
**`custom_label_2` – Price Position Vs Market**
Purpose: overlay how competitively priced a product is.
Example values:
- `below_median`, `at_median`, `above_median`
Product Metrics’ [Competitor Prices feature](https://www.productmetrics.io/competitor-prices), for example, compares your products to competitors, computes a price position, and can write that into Merchant Center as a custom label (e.g. `custom_label_2 = above_median`). (Source: [Product Metrics – Product-Level Google Shopping Optimisation](https://www.productmetrics.io/))
**`custom_label_3` – Stock Lifecycle State**
Purpose: capture whether the product is in a special state that should change how aggressively you advertise it.
Example values:
- `new`, `evergreen`, `clearance`, `low_stock`, `end_of_line`
**`custom_label_4` – Experiment Cohort Flag**
Purpose: track A/B tests or cohorts without rebuilding campaigns.
Example values:
- `test_feed_titles_v1`, `test_pricing_v2`, `control`
You can also follow Google’s own suggestion to use one label for seasonality, one for margin, etc.; the key is to **document** the schema and avoid repurposing labels later. (Source: [Google Ads Help – Use custom labels for Shopping ads](https://support.google.com/google-ads/answer/6275295))
## 3. Implementing Labels 0–4 In Merchant Center And Google Ads
Once you’ve designed the schema, you need a clean way to get it into your feed and into campaigns.
### 3.1 Populate Labels In The Feed
There are three common routes:
1. **Directly in the primary feed**
- Your ecommerce platform or feed tool writes `custom_label_0–4` into the main feed that Merchant Center ingests.
2. **Via a supplemental feed**
- You upload a second feed keyed on product ID that only contains custom labels; Merchant Center merges it onto the primary product data. Google’s documentation and Product Metrics’ glossary both describe this pattern: the primary feed holds core product data, while a supplemental feed supplies segmentation labels such as `custom_label_0 = stars`. (Source: [Google Merchant Center Help – Supplemental feeds](https://support.google.com/merchants/answer/7439058); [Product Metrics – Supplemental feed label glossary](https://www.productmetrics.io/glossary/supplemental-feed-label))
3. **Through an optimization platform**
- Tools like Product Metrics connect to Google Ads, Merchant Center, and your store, compute segments and business rules, and write approved custom labels back to Merchant Center via API on a daily schedule. (Source: [Product Metrics – Google Shopping monitoring](https://www.productmetrics.io/google-shopping-monitoring))
Whichever route you use, follow Google’s technical constraints: up to five labels per product, one value per label, length and uniqueness limits, and a 24–48 hour propagation time for labels to appear in Google Ads. (Source: [Google Ads Help – Use custom labels for Shopping ads](https://support.google.com/google-ads/answer/6275295))
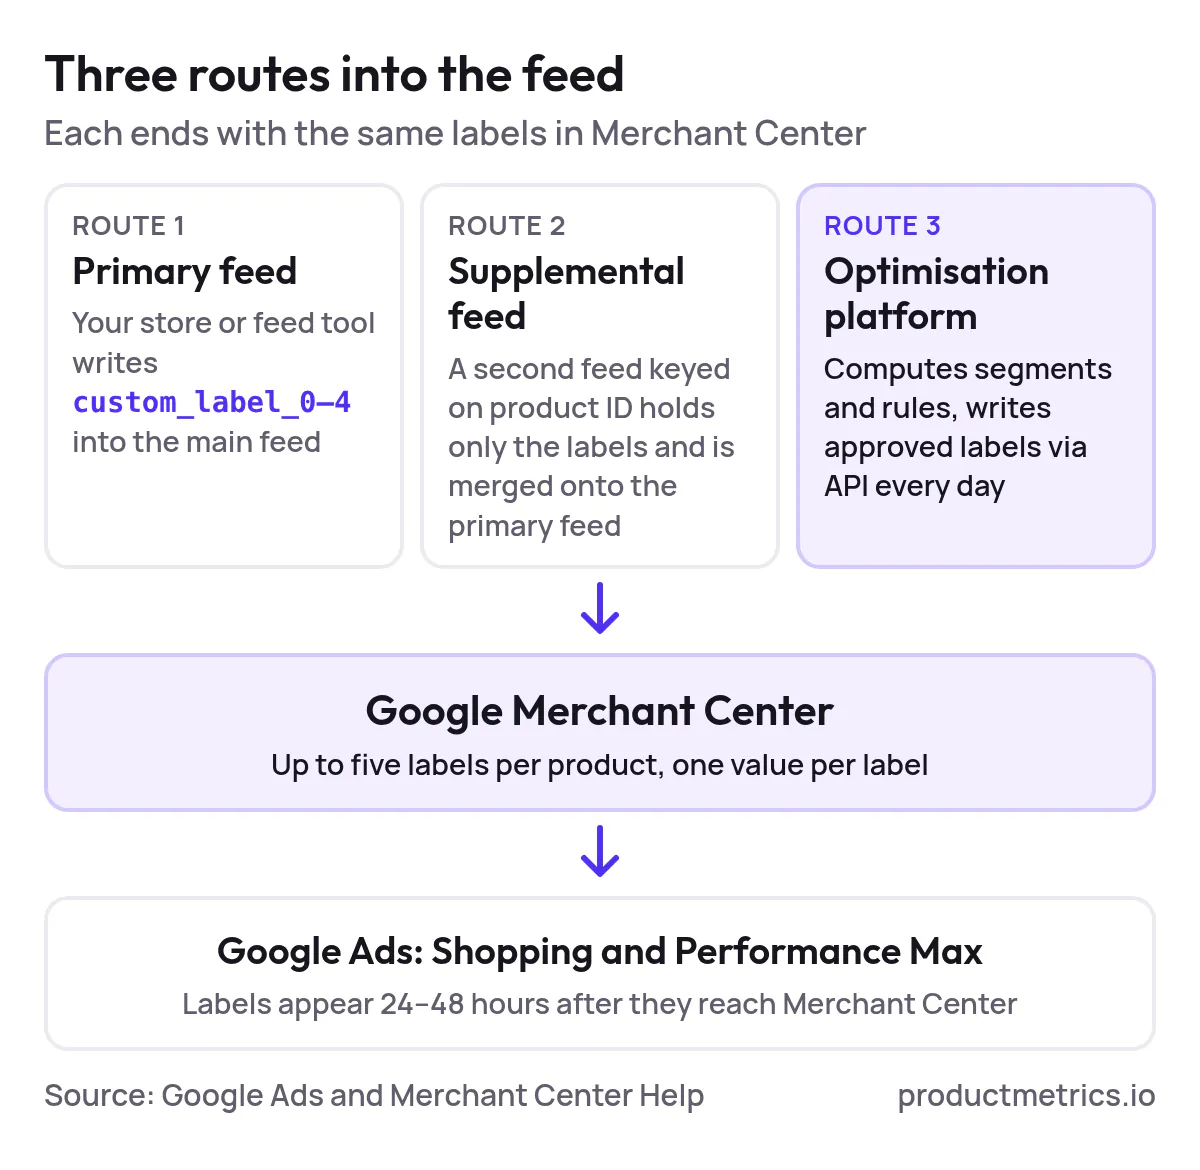
_All three routes end in the same five Merchant Center fields; plan for 24–48 hours before Google Ads can filter on a new value._
### 3.2 Wire Labels Into Shopping And Performance Max
In **Standard Shopping**:
- Use **inventory filters** at the campaign level to include only certain label values (e.g., `custom_label_0 in (stars, cash_cows)` for a “high-priority winners” campaign)
- Within campaigns, subdivide **listing groups** (product groups) by `custom_label_0–4` to see performance by segment and adjust bids at that level
In **[Performance Max](https://www.productmetrics.io/performance-max)**:
- Use labels in **listing group filters** inside asset groups, so that each asset group can target, for example, only `stars` and `cash_cows`
- Because custom labels are exposed as subdivision dimensions for listing groups, they can drive separate budgets and targets for each segment. (Source: [FeedArc – Custom labels from GA4 performance](https://www.feedarc.com/guides/custom-labels-from-ga4-performance); [Product Metrics – Custom labels glossary](https://www.productmetrics.io/glossary/custom-labels))
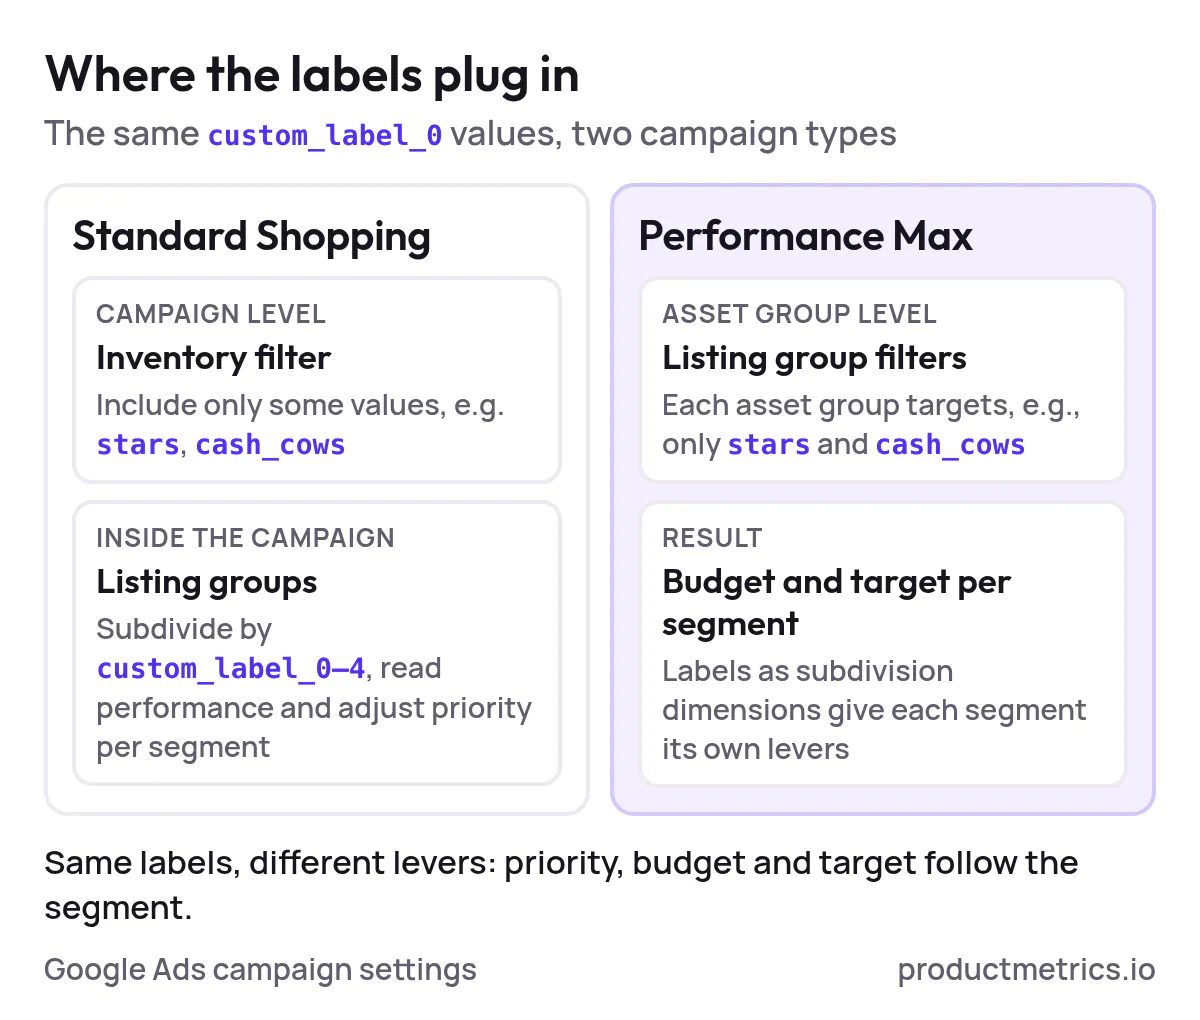
_Standard Shopping filters labels per campaign, Performance Max per asset group: either way each segment gets its own priority, budget and target._
The structure doesn’t have to be complex. A simple three - campaign setup based on `custom_label_0`—Stars & Cash Cows; Question Marks; Dogs & Drainers—already creates very different [levers for budget and bid strategies](https://www.productmetrics.io/blog/product-segmentation-google-shopping-pmax).
## 4. Dashboard Recipes For Label Level And SKU Level Tracking
Good segmentation is wasted without clear, label-aware reporting. Out of the box, Google Ads exposes product-level and product-group reports, and its API offers detailed views such as `shopping_performance_view` and `product_group_view` that can be sliced by product attributes. (Source: [Google Ads API – Product reporting for Shopping ads](https://developers.google.com/google-ads/api/docs/shopping-ads/reporting))
Here are [dashboard “recipes”](https://www.productmetrics.io/blog/google-shopping-roas-dashboard) you can build in a BI tool or in a specialized platform like Product Metrics.
### 4.1 Segment Health Performance By `custom_label_0`
Objective: see how spend, revenue, and profit split across performance segments.
Dimensions
- `custom_label_0` (performance segment)
Metrics
- Spend, clicks, conversions, revenue, ROAS
- If you have cost-of-goods: gross profit, [POAS (profit on ad spend)](https://www.productmetrics.io/blog/poas-vs-roas)
- Product count per segment
- Share of total spend vs share of total revenue/profit
Questions to answer weekly:
- Are **Stars and Cash Cows** taking the majority of spend and revenue?
- Are **Drainers and Dogs** consuming more spend than their share of revenue or profit justifies?
- How many **Ghosts** (no impressions) do you have, and are they worth fixing?
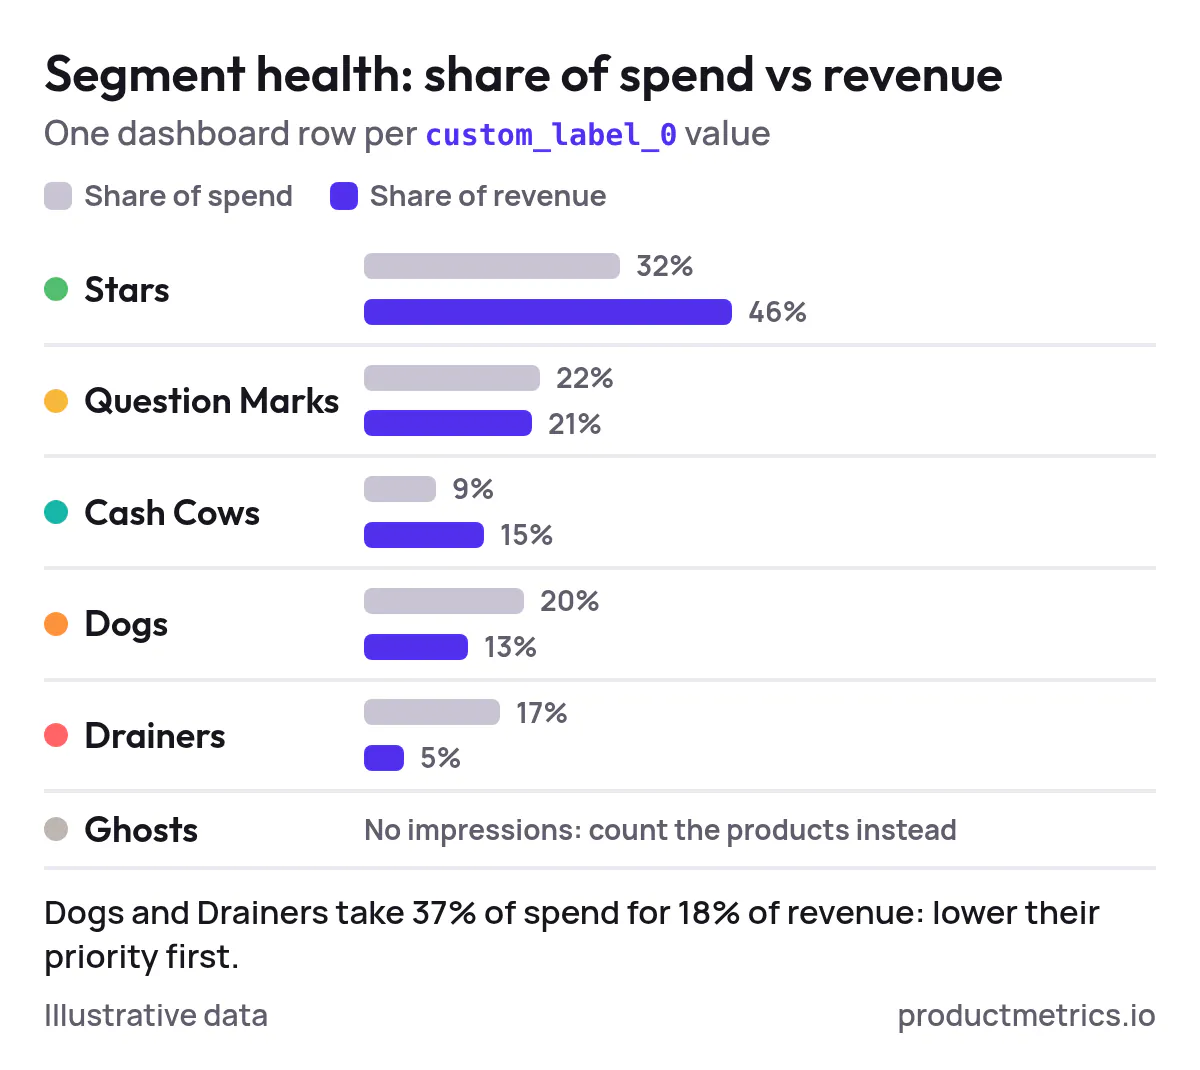
_Illustrative data: when Dogs and Drainers take 37% of spend for 18% of revenue, those are the segments to give lower priority first._
Product Metrics’ own product overview shows this kind of table out of the box: spend, revenue, ROAS, and the share of total revenue and spend per segment (Stars, Question Marks, Cash Cows, Dogs, Drainers, Ghosts). (Source: [Product Metrics – Product-Level Google Shopping Optimisation](https://www.productmetrics.io/))
### 4.2 Economics Overlay `custom_label_0 × custom_label_1`
Objective: combine performance with margin tiers to prioritize where to push or pull back.
Dimensions
- `custom_label_0` (performance segment)
- `custom_label_1` (margin band)
Metrics
- Revenue, gross profit, POAS
- Impression share, potential uplift if you increased impression share on high-margin winners
This reveals, for example:
- **High-margin Stars**: candidates for more aggressive targets and budgets
- **Low-margin Stars**: revenue-heavy but profit-thin; maybe cap budgets or increase prices
- **High-margin Question Marks**: worth feed and landing-page work to turn into future Stars
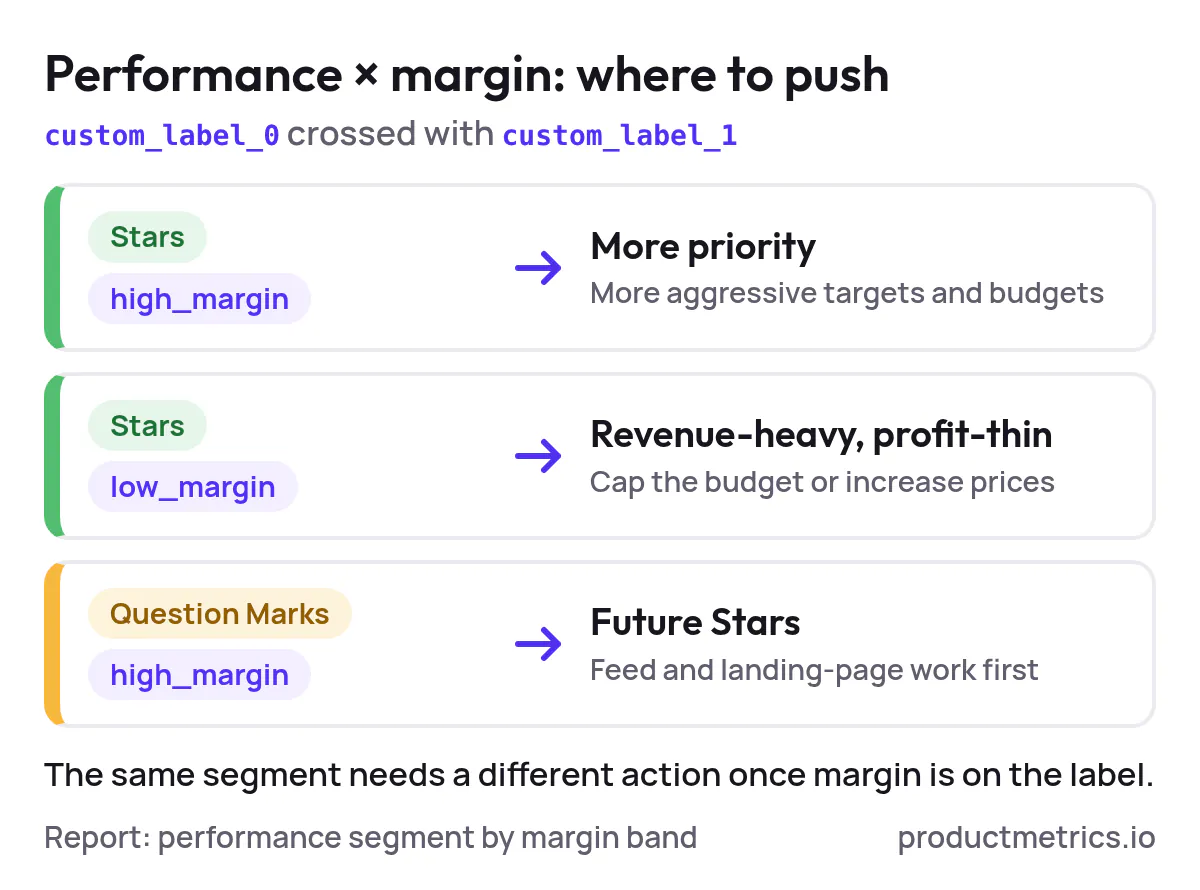
_Two Stars can need opposite actions: the margin label decides whether a winner gets more priority or a budget cap._
### 4.3 Price And Competitiveness `custom_label_0 × custom_label_2`
Objective: understand how price position interacts with performance.
If you tag products with a price position label (e.g. `below_median`, `at_median`, `above_median`), your dashboard can show:
- How many **Drainers** are also **above_median** in price
- Whether **Stars** tend to sit at market price or below
Product Metrics’ Competitor Prices module is built exactly to create this context and send price position into Merchant Center as a custom label (e.g., `custom_label_2 = above_median`), so you can report and act on it directly. (Source: [Product Metrics – Product-Level Google Shopping Optimisation](https://www.productmetrics.io/))
### 4.4 SKU Level Deep Dives Within Each Label
Objective: move from segment-level insight to [SKU-level actions](https://www.productmetrics.io/blog/sku-level-tracking-google-ads).
For each performance segment, create a view that lists:
- Top products by **wasted spend** (high spend, low revenue or POAS)
- Top products by **incremental potential** (high POAS, low impression share)
- Products that **changed segment** in the last sync
With Google Ads’ Shopping Performance View you can retrieve impressions, clicks, cost, and conversions by product item ID, then join that to your label values and product metadata. (Source: [Google Ads API – Shopping Performance View reference](https://developers.google.com/google-ads/api/fields/v24/shopping_performance_view))
Product Metrics automates this by letting you segment by `custom_label_0` and then drill down to products, [journeys](https://www.productmetrics.io/product-journeys), competitor prices, and inventory—all tied back to each SKU. (Source: [Product Metrics – Product Segmentation](https://www.productmetrics.io/product-segmentation))
## 5. An Experimentation Ladder For Label Led Optimization
Once labels and dashboards are in place, you can climb a simple experimentation ladder rather than trying to redesign everything at once.
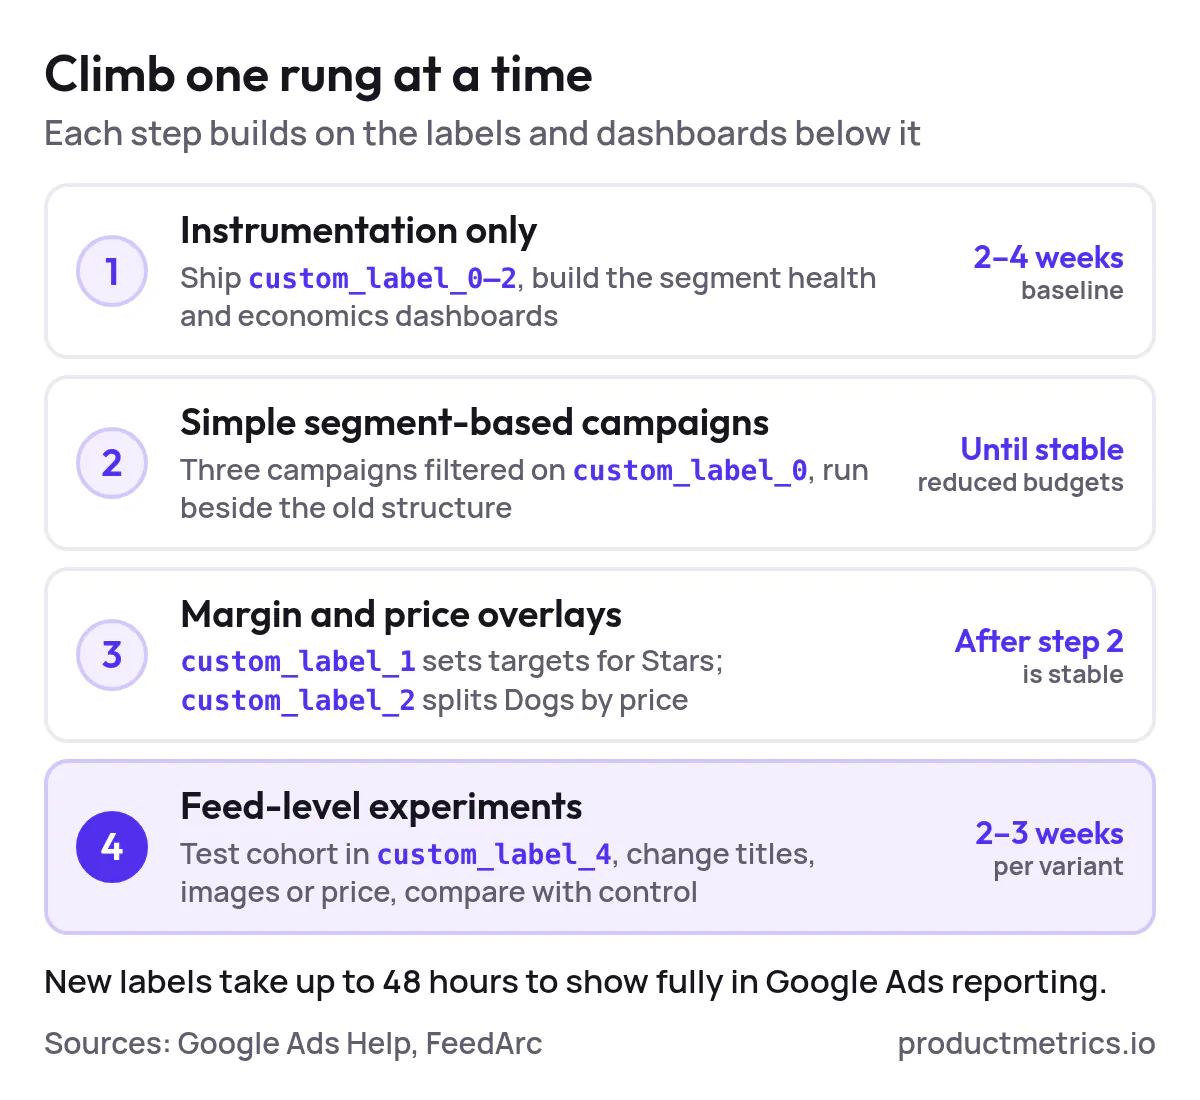
_Each rung builds on the one below it: a 2–4 week baseline first, feed tests of 2–3 weeks per variant last._
### Step 1 Instrumentation Only No Structural Changes Yet
- Ship `custom_label_0–2` into Merchant Center
- Build the segment health and economics dashboards above
- Run for 2–4 weeks to establish a baseline; remember new labels can take up to 48 hours to appear fully in Google Ads reporting. (Source: [Google Ads Help – Use custom labels for Shopping ads](https://support.google.com/google-ads/answer/6275295))
Outcome: you know how spend and outcomes currently split across segments, before any campaign rebuilds.
### Step 2 Simple Segment Based Campaigns
Now start restructuring campaigns around labels—but keep it simple:
- **Campaign A – Stars & Cash Cows**
Filter: `custom_label_0 in (stars, cash_cows)`
Strategy: higher budgets, slightly looser [target ROAS/POAS](https://www.productmetrics.io/blog/target-roas-from-margin) to buy incremental volume
- **Campaign B – Question Marks**
Filter: `custom_label_0 = question_marks`
Strategy: budgets for testing; focus on feed and pricing fixes to see if they can graduate into Stars
- **Campaign C – Dogs & Drainers**
Filter: `custom_label_0 in (dogs, drainers)`
Strategy: very conservative targets, lower priority, or even exclusion
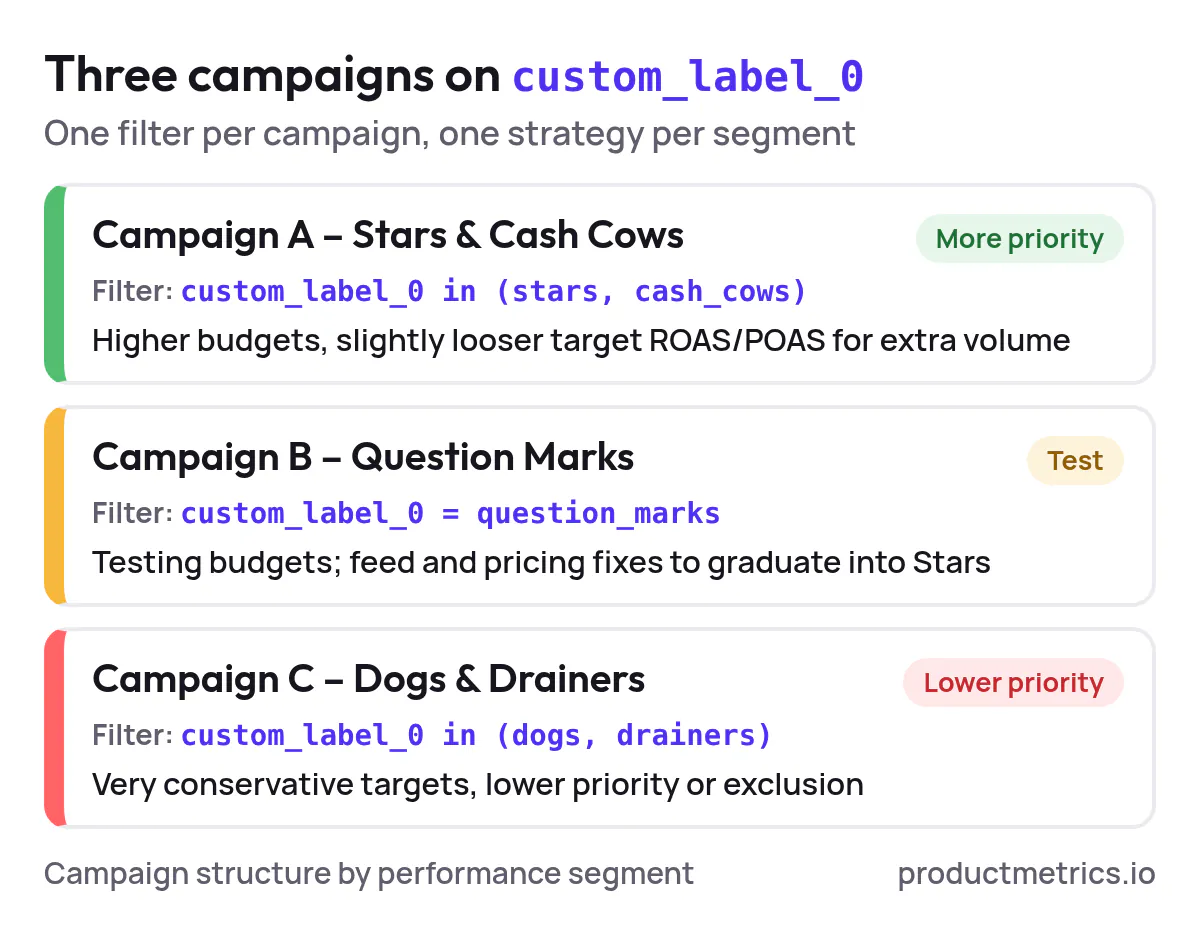
_One filter per campaign gives each segment its own budget and target, so winners get more priority without lifting the rest._
A Product Metrics campaign-structure guide lays out similar mappings: performance segments written into `custom_label_0`, then campaigns filtered on those labels with different bid strategies per segment. (Source: [Product Metrics – ML Product Segmentation for Google Shopping](https://www.productmetrics.io/product-segmentation))
Run this structure alongside your old one with reduced budgets until you’re confident in the new setup.
### Step 3 Add Margin And Price Overlays
Once the performance-only structure is stable, layer in economics:
- Use `custom_label_1` to give **high-margin Stars** more aggressive targets than low-margin Stars
- Use `custom_label_2` to treat **above-median-price Dogs** as pause candidates, while below-median Dogs might be rescued with title or image improvements instead
### Step 4 Feed Level Experiments
Finally, use labels to run clean experiments on feed and pricing changes:
- Assign a subset of products to a **test cohort** via `custom_label_4`
- Change titles, images, or price only for that cohort
- Compare performance against a control group with the same baseline labels
Feed-level A/B tests need time: many practitioners recommend at least 2–3 weeks of clean data per variant to separate noise from real uplift. (Source: [FeedArc – Measuring the ROAS impact of a product feed change](https://www.feedarc.com/article/measuring-roas-impact-of-a-feed-change))
## 6. Why Dedicated Tools Beat Spreadsheets For Granular Tracking
You *can* build all of this in spreadsheets and generic BI tools, but at a cost:
- **Manual label updates**: every change to performance segments or price position risks breaking your own rules
- **Fragmented data**: Google Ads holds product-level metrics; GA4 holds journeys and multi-product orders; your platform holds margin and stock
- **Experiment fatigue**: it’s hard to keep an experiment log tied to label values and campaign changes over time
When you’re specifically looking for **[Google Shopping campaign segmentation tools with customizable performance tracking granularity](https://www.productmetrics.io/blog/google-shopping-segmentation-software)**, or **[campaign segmentation solutions with detailed performance dashboards](https://www.productmetrics.io/blog/google-shopping-roas-dashboard-platforms)**, the real question is:
> How much of the segmentation, labeling, and label-level reporting does the platform maintain for you, and how much are you still hand-stitching?
A strong platform should:
1. **Operate at SKU level** (not just campaign or ad group)
2. Provide **consistent custom label governance** (clear meanings per label 0–4)
3. Write labels back to Merchant Center **automatically and safely**
4. Offer **built-in dashboards** by label and SKU, with profit if you supply costs
5. Make it easy to run and interpret **experiments** on top of the structure
> **Get more revenue out of Google Shopping.** Every product segmented and labelled in Merchant Center, so your top performers get more priority. [Analyse your products for free](https://app.productmetrics.io/) Log in with Google, no credit card.
## 7. How Product Metrics Gives You Custom Label Intelligence By Default
Product Metrics is built specifically around this workflow: segment products by performance and economics, turn those segments into custom labels, and close the loop with Shopping and PMax campaigns.
### 7.1 Segment First Six ML Driven Performance Groups Per SKU
Once connected, Product Metrics uses machine learning to place each product into one of six segments—Stars, Question Marks, Cash Cows, Dogs, Drainers, Ghosts—based on ad clicks and return vs your ROAS or POAS target. (Source: [Product Metrics – Product-Level Google Shopping Optimisation](https://www.productmetrics.io/))
Those segments are visible in its own dashboards (Segment → Product → Context → Action), so you can see at a glance how much spend and revenue each group accounts for, and which segments are soaking up budget without paying back. (Source: [Product Metrics – Google Shopping monitoring](https://www.productmetrics.io/google-shopping-monitoring))
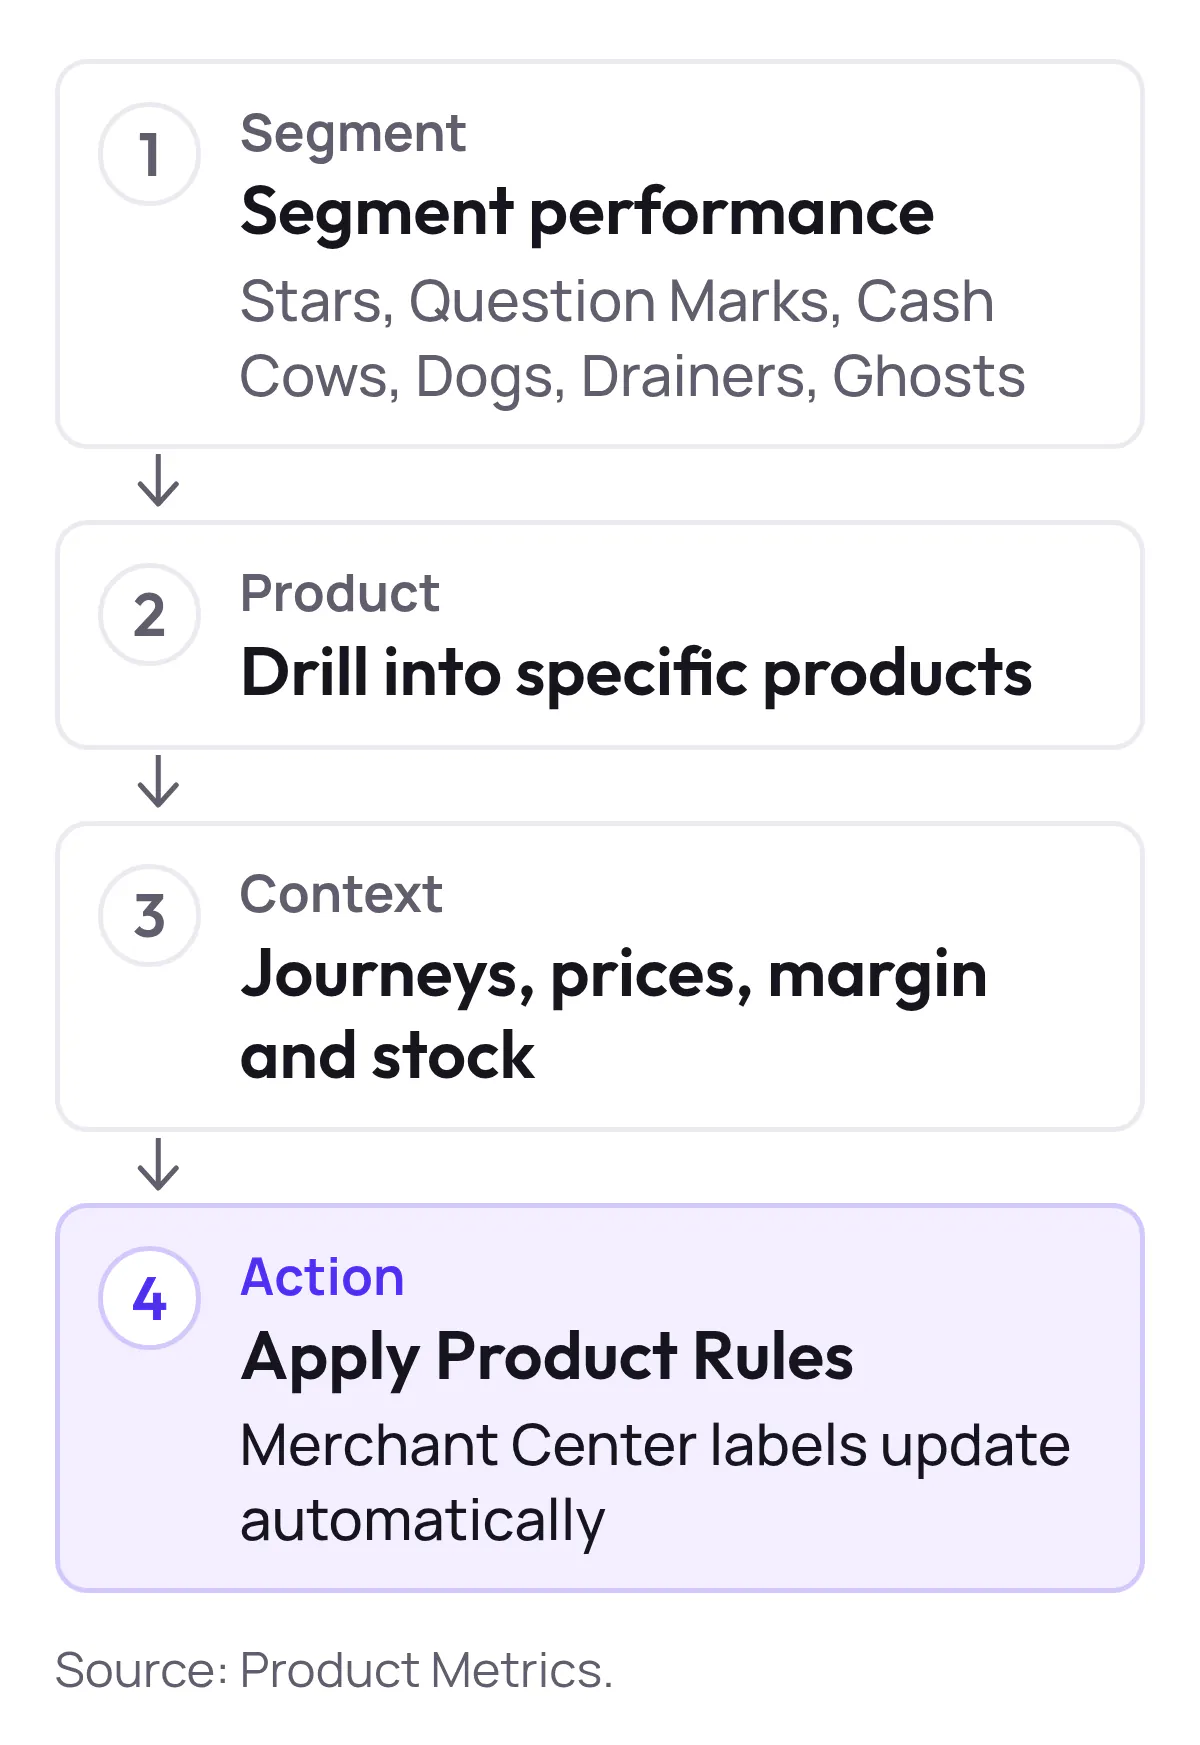
_Segment, product, context, action: the last step writes the decision back as a Merchant Center label._
### 7.2 Turn Segments Into Merchant Center Labels Automatically
On Pro plans, Product Metrics’ **Product Rules** and Merchant Center labels integration:
- Map performance segments and business rules (e.g., POAS ≥ 1.4, margin ≥ 40%, stock > 8 weeks) to label values such as `custom_label_0 = stars` or `star_candidate`
- Write those labels into Merchant Center via a daily supplemental feed, so campaigns can target them without brittle manual feed rules
- Keep labels fresh as performance and context change, while you approve the mappings
Product Metrics’ own documentation describes this “from segment to campaign” flow: segments become labels in Merchant Center, updated daily, and campaigns are then split by those label values. (Source: [Product Metrics – ML Product Segmentation for Google Shopping](https://www.productmetrics.io/product-segmentation); [Product Metrics – Pricing](https://www.productmetrics.io/pricing))
### 7.3 Add Margin Stock And Price Context To Labels
Beyond performance segments, Product Metrics can:
- Pull in **margin data** from your ecommerce platform so you can create margin bands in another label slot
- Compute **price position** against competitors and expose it as a custom label (e.g., `custom_label_2 = above_median`)
- Use **[Inventory Insights](https://www.productmetrics.io/inventory-insights)** to surface slow-moving or out-of-stock items so you aren’t paying for clicks you can’t fulfill
These context layers feed into Product Rules, which in turn write Merchant Center labels your Shopping and PMax campaigns can filter and subdivide on. (Source: [Product Metrics – Product-Level Google Shopping Optimisation](https://www.productmetrics.io/); [Product Metrics – Pricing](https://www.productmetrics.io/pricing))
### 7.4 Label Aware Dashboards And Reporting
Because Product Metrics reads Google Ads and Merchant Center directly, its dashboards natively understand:
- Performance **by segment** (Stars vs Drainers, etc.)
- Performance **within segments** at SKU level
- How that performance changes as labels and Product Rules evolve
This makes it effectively a **Google Shopping campaign segmentation tool with detailed performance dashboards**, but based on your custom label schema rather than a fixed black-box view. (Source: [Product Metrics – Tool-by-use-case: Shopping/PMax reporting software](https://www.productmetrics.io/blog/shopping-pmax-reporting-software))
### 7.5 Pricing And Getting Started
Product Metrics is priced as a graduated share of your rolling 30-day Google Shopping spend, with the **first €10,000 per month free** and marginal rates from 0.65% down to 0.05% above that, with no minimum fee. (Source: [Product Metrics – Pricing](https://www.productmetrics.io/pricing))
**Figure: Marginal Product Metrics rate per band of rolling 30-day Google Shopping spend.** The first €10,000 a month is free; above it each band has its own marginal rate, from 0.65% down to 0.05% above €10M.
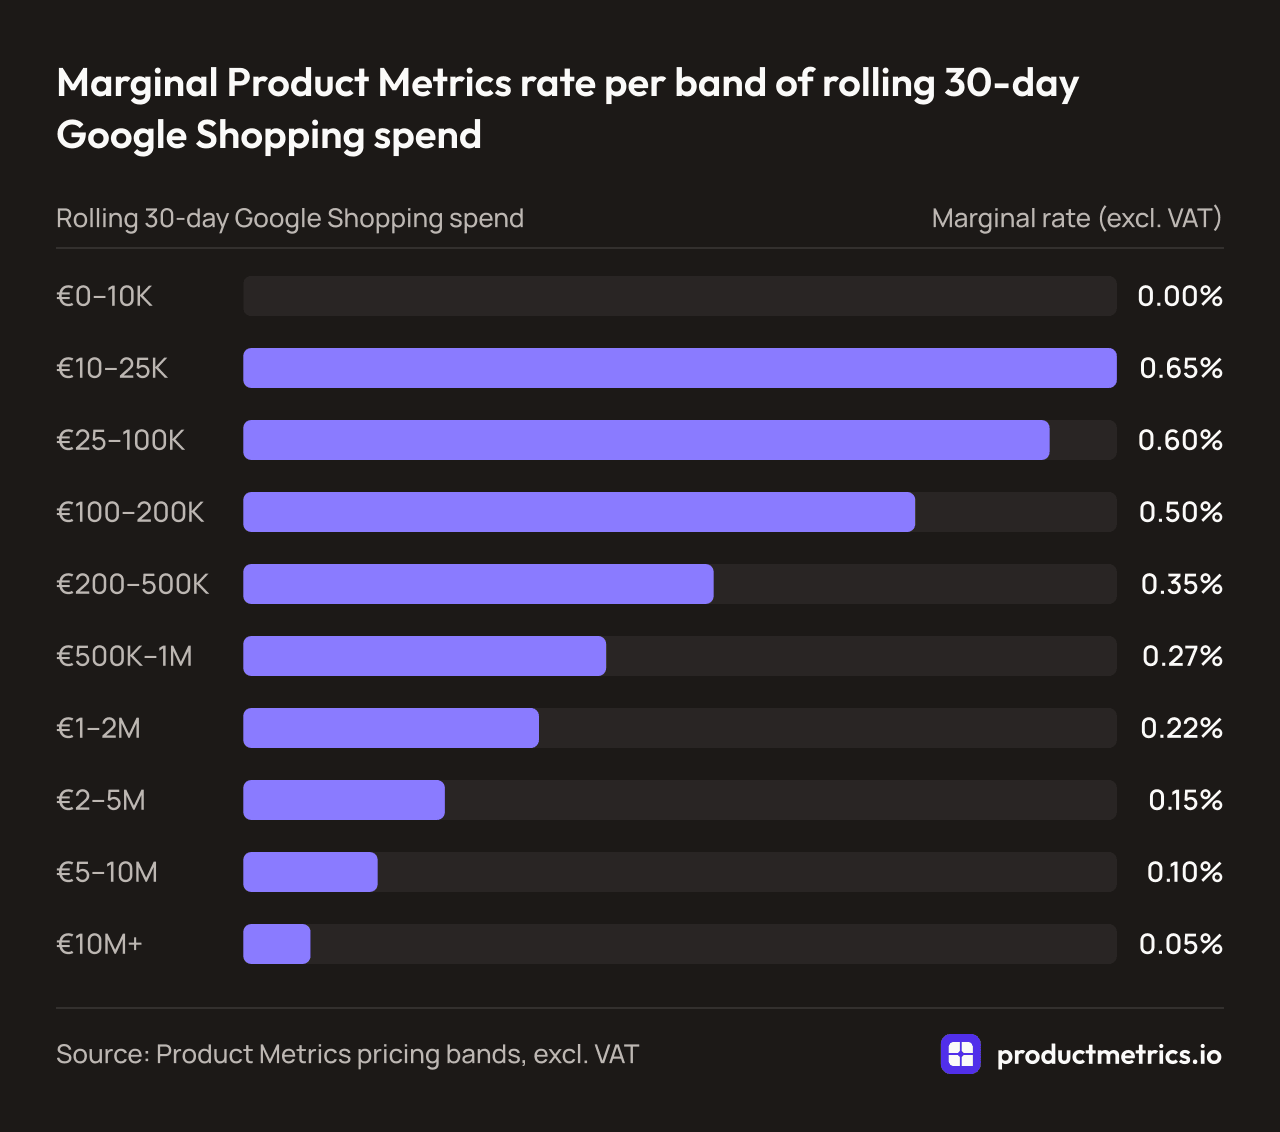
| Rolling 30-day Google Shopping spend | Marginal rate (excl. VAT) |
| --- | --- |
| €0–10K | 0.00% |
| €10–25K | 0.65% |
| €25–100K | 0.60% |
| €100–200K | 0.50% |
| €200–500K | 0.35% |
| €500K–1M | 0.27% |
| €1–2M | 0.22% |
| €2–5M | 0.15% |
| €5–10M | 0.10% |
| €10M+ | 0.05% |
_Source: Product Metrics pricing bands, excl. VAT_
There are three low-friction ways to start:
1. **Free analysis (no credit card)**
- Log in with Google at [app.productmetrics.io](https://app.productmetrics.io)
- Connect your Shopping account and see your own products segmented into six groups, on your data
- Feed export with Merchant Center labels is not included at this step, so it’s safe for evaluation
(Source: [Product Metrics – Pricing](https://www.productmetrics.io/pricing); [Product Metrics – Book a demo](https://www.productmetrics.io/demo))
2. **30-day Pro trial**
- Start the Pro plan trial when you’re ready for label export and deeper reporting
- Includes feed export with Merchant Center labels, Product Journeys, Competitor Prices, Inventory Insights, and [Full Signal Tracking](https://www.productmetrics.io/server-side-tracking)
(Source: [Product Metrics – Pricing](https://www.productmetrics.io/pricing))
3. **Founder-led demo**
- Book a call with founder Berend Vrakking at [productmetrics.io/demo](https://www.productmetrics.io/demo)
- Walk through segmentation, context, and label export on demo data, then get a demo account for your team
(Source: [Product Metrics – Book a demo](https://www.productmetrics.io/demo))
If you’re evaluating **[platforms that offer SKU-level performance tracking for Google Shopping campaign segmentation](https://www.productmetrics.io/blog/segmentation-platform-google-shopping)**, or looking to **[buy software for campaign segmentation with high-granularity performance tracking](https://www.productmetrics.io/blog/google-shopping-segmentation-software-rfp)**, the core question is whether the tool can:
- Maintain a clear, opinionated custom label schema for you
- Keep those labels in sync with real performance and economics
- Give you label-aware dashboards and experimentation paths that stay stable over time
Product Metrics is built to answer “yes” on all three.
When you’re ready to move beyond manual slices of Google Ads and fragile feed rules, connect your accounts, let the ML segmentation run, and start managing Google Shopping at the level where decisions are actually made: **custom labels and SKUs.**
## Keep reading.
- [Designing Multi‑Level Performance Dashboards For Segmented Google Ads From Campaigns To SKUs](https://www.productmetrics.io/blog/google-ads-performance-dashboards)
- [The 2026 Buyer’s Guide to Google Shopping Campaign Segmentation Platforms (US)](https://www.productmetrics.io/blog/google-shopping-segmentation-platforms-us)
- [Where to Buy Google Shopping Segmentation Software With Granular Analytics Pricing Trials And RFP Checklist](https://www.productmetrics.io/blog/google-shopping-segmentation-software-rfp)
---
Written by Berend Vrakking, founder of Product Metrics. Last updated 2026-11-09.
1M+ products analysed · Nominated at the Dutch Search Awards for Best Measurement Campaign (2023) and Best Use of Data (2024)
HTML version: https://www.productmetrics.io/blog/custom-labels-google-shopping