---
title: "Data-Driven PMAX: Customer Signals, Listing Optimization, and What’s Next"
description: "Data-Driven PMAX: turn first-party customer signals and product data into Performance Max segments, custom labels and asset groups that protect margin."
canonical: "https://www.productmetrics.io/blog/data-driven-pmax"
pageType: article
language: en
publisher: "Product Metrics"
author: "Berend Vrakking"
datePublished: 2026-11-09
dateModified: 2026-11-09
image: "https://www.productmetrics.io/og/blog/data-driven-pmax.png"
---
> Content index: https://www.productmetrics.io/llms.txt
# Data-Driven PMAX: Customer Signals, Listing Optimization, and What’s Next
## Key takeaways
- Start by mapping high-value customer cohorts and tying them back to products.
- Encode those insights into your feed via custom labels and structured attributes.
- Consolidate campaigns around a few clear product roles and lifecycle stages.
[Performance Max](https://www.productmetrics.io/glossary/performance-max "Performance Max is a goal-based Google Ads campaign type that uses automation to reach customers across Google advertising channels.") has grown up.
Where it started as an opaque “set it and forget it” black box, today you have campaign-level negatives, channel reporting, asset-group insights, and new channel-priority controls that give you far more levers than in the early versions. But the brands pulling away from the pack are winning on a different axis: how well they connect **customer data** and **product metadata** to smart [PMAX product segmentation](https://www.productmetrics.io/blog/pmax-product-segmentation).
This guide shows how to:
- Translate first-party customer signals into PMax product segments.
- Use feed and listing optimization to make those segments “visible” to Google.
- Apply practical segmentation frameworks that protect margin and improve [ROAS](https://www.productmetrics.io/glossary/roas "Return on ad spend (ROAS) is the revenue your ads generate for every euro you spend on them.").
- Understand the latest trends in [Google Shopping campaign segmentation](https://www.productmetrics.io/blog/campaign-segmentation-google-shopping) so your structure doesn’t fall behind.
Throughout, we’ll point out where a platform like **ProductMetrics** can automate the heavy lifting so you’re not rebuilding segments by hand every week.
## What Are the Benefits of PMax Product Segmentation in Ads?
PMax optimizes at the campaign level using [Smart Bidding](https://www.productmetrics.io/glossary/smart-bidding "Smart Bidding is a set of Google Ads bidding strategies that use Google AI to optimise for conversions or conversion value in every auction.") and cross-network signals, but it still needs clear, structured inputs to understand which products deserve budget. Thoughtful product segmentation inside PMax gives you several compounding advantages:
### 1. Budget Flows to the Right Inventory
When you group products by business logic—margin tiers, lifecycle stage, stock health, or acquisition role—you can assign different targets and budgets to each cluster. High-margin heroes and replenishable SKUs can carry more aggressive investment than low-margin clearance items without needing dozens of micro-campaigns.
[Feed-driven rules](https://www.productmetrics.io/blog/merchant-center-feed-rules) that tier products by margin or stock and map them to listing groups let budget follow your most profitable inventory automatically as catalog conditions change.
### 2. Cleaner Signals, Faster Learning
Over-segmentation at the listing-group level can starve PMax of data; the algorithm still optimizes at the campaign level, so dozens of tiny groups dilute conversion volume. Practitioners testing across multiple ecommerce accounts have found that consolidating to a handful of meaningful groups (for example, low/medium/high margin) gives PMax enough data density to detect real patterns.
The sweet spot: **few, strategically distinct product segments** that map to how you actually make money.
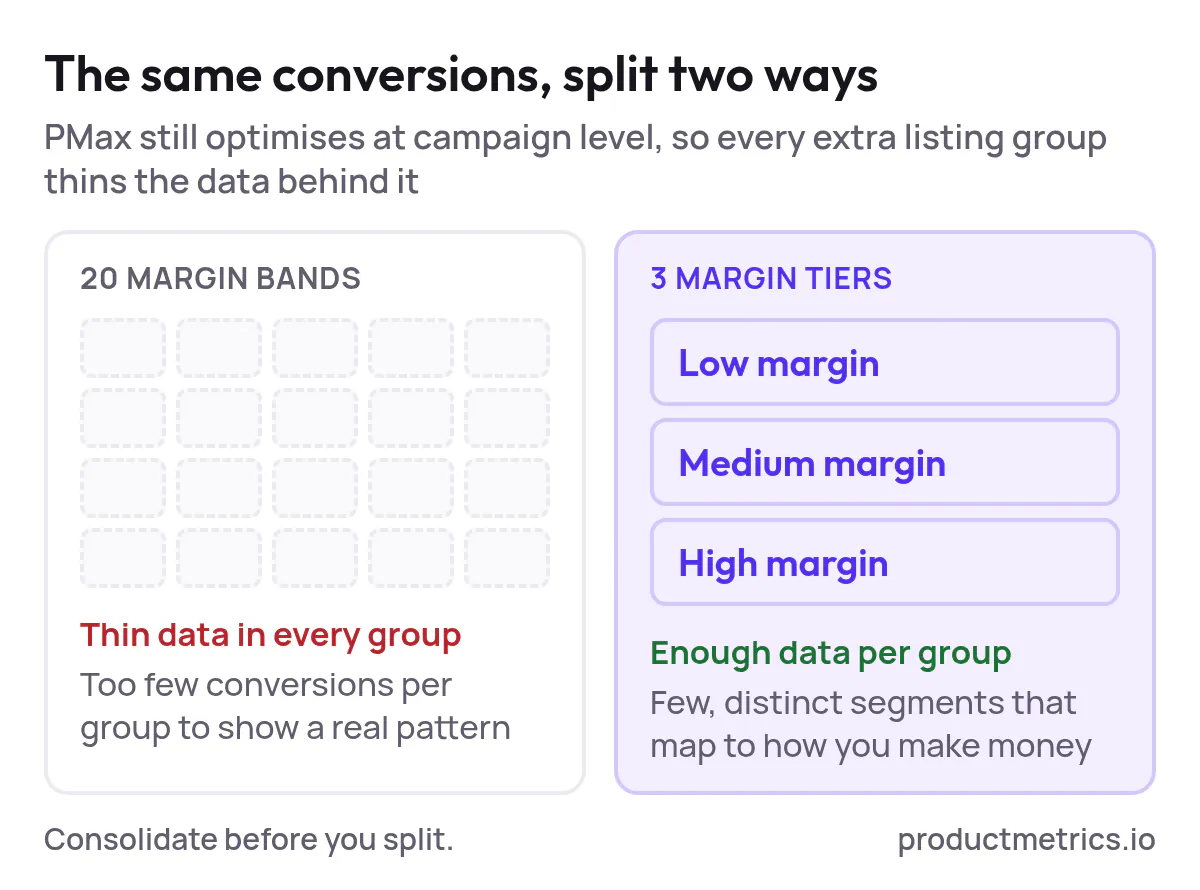
_Splitting the same conversions across 20 listing groups leaves each one too thin to learn from; three margin tiers keep the data dense._
### 3. Real Control in an Automated System
Newer PMax controls—like [campaign-level negative keywords](https://www.productmetrics.io/blog/google-ads-negative-keywords), brand exclusions, and channel reporting—reduce some of the “black box” risk. But they don’t change one core truth: PMax is still only as good as the signals you feed it.
Product segmentation is how you:
- Keep low-margin SKUs and zombie products from soaking up profitable spend.
- Isolate brand-search cannibalization so you can protect your Search campaigns.
- Attach different creative, audiences, and bids to segments that behave differently.
### 4. A Bridge Between Performance and Merchandising
When segments are built from **real customer behavior** (which products new customers discover you with, which SKUs repeat buyers love, which categories drive upsell), your campaign structure mirrors your merchandising strategy. Over time, this gives both marketing and merchandising teams a shared language and a shared scorecard.
## How PMax Actually Uses Product and Customer Data
Before you re-architect PMax, it’s worth grounding how it really works under the hood.
- **Unified inventory:** PMax pulls from Search, Shopping, YouTube, Display, Discover, Gmail, and Maps under a single Smart Bidding model. Your [product feed](https://www.productmetrics.io/glossary/product-feed "A product feed is a file or data source that lists your products, one per row, with attributes such as ID, title, price and availability.") is the backbone of how it understands *what* you sell.
- **Auction-time bidding:** Bids are adjusted in real time using device, location, context, and your chosen ROAS or CPA goals.
- **Cross-channel attribution:** Every conversion path—YouTube view, Shopping click, branded search—feeds one central model, which then looks for similar profiles.
- **First-party signal dependence:** As platform tracking gets noisier, PMax relies more on [first-party conversion data](https://www.productmetrics.io/blog/what-is-server-side-tracking), offline conversions, and rich feed attributes to steer optimization.
Two implications for segmentation:
1. **Listing groups are filters, not magic levers.** They tell Google *which* products are eligible in a given asset group, but they don’t create separate machine-learning models. Atomizing into 20 margin bands often hurts more than it helps because you’re spreading limited conversions across too many groups.
2. **Signals must be high-intent and high-quality.** Product metadata and customer data should both describe reality with enough precision—margin, lifecycle, categories, high-AOV purchasers, new-customer propensity—that Google’s model can make smarter bets.
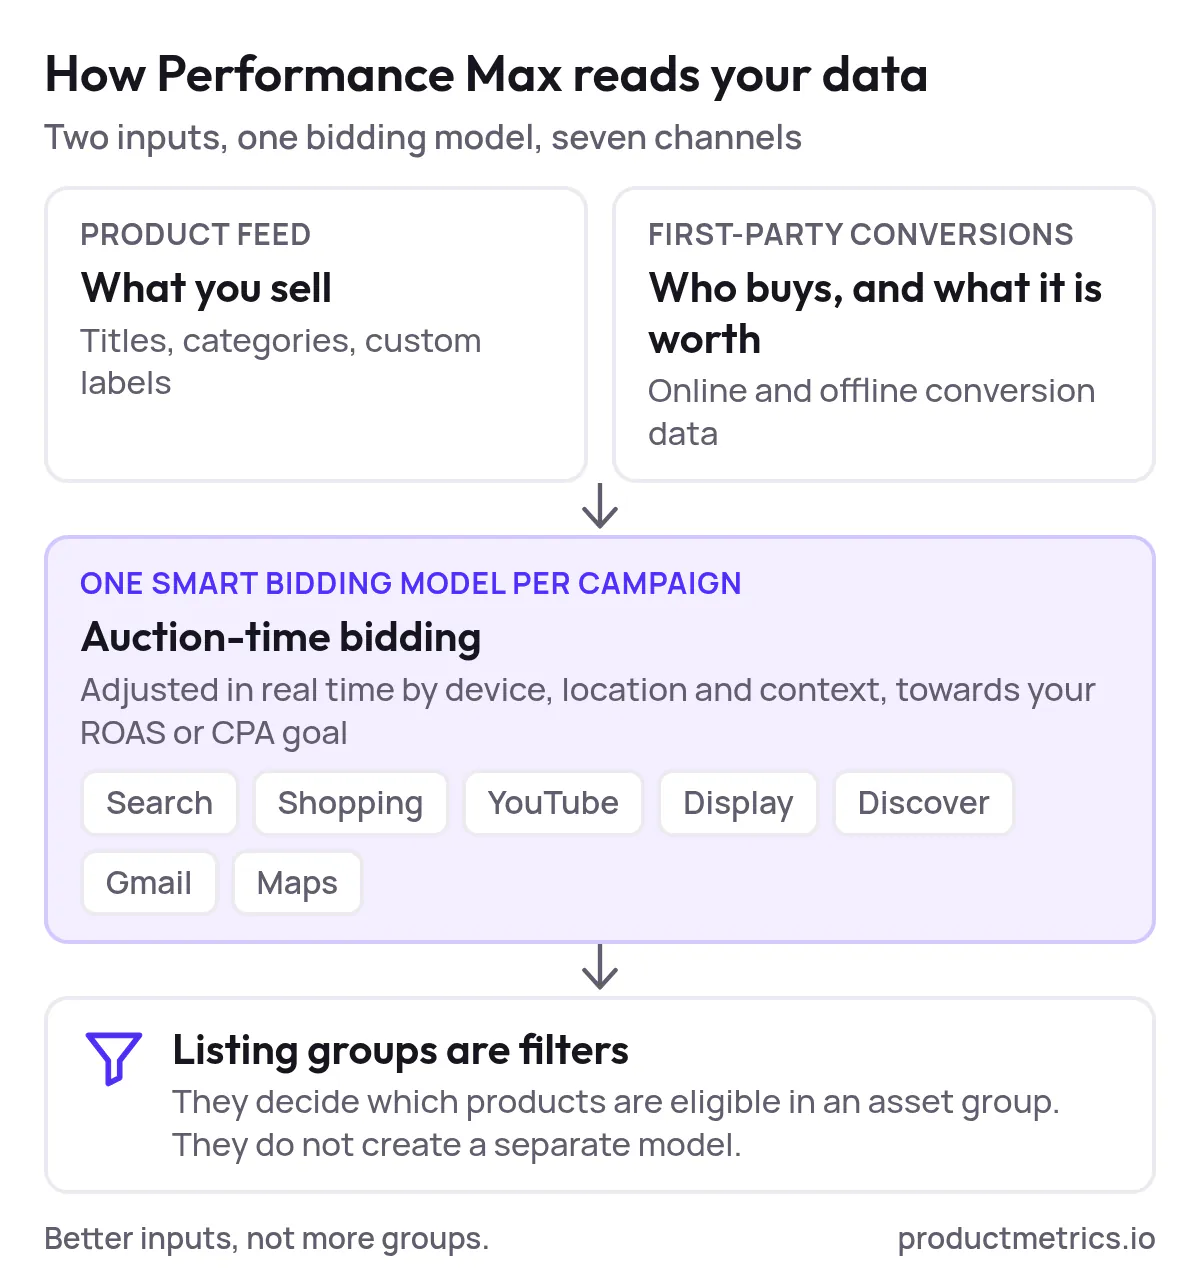
_Performance Max runs one bidding model per campaign across seven channels; listing groups only decide which products are eligible, so better inputs beat more groups._
## How to Use Customer Data for PMax Product Segmentation
The biggest untapped opportunity in Shopping right now is treating **customer data** as a first-class input to your product strategy, not just to audience lists.
Here’s a practical workflow you can implement (and later automate with ProductMetrics):
### Step 1: Define Your High-Value Customer Cohorts
Start in your analytics, data warehouse, or CDP and build segments based on **outcomes**, not vanity metrics:
- [New vs. returning customers](https://www.productmetrics.io/blog/what-is-ncac)
- High-LTV purchasers (e.g., top 20–30% by lifetime gross profit)
- High-AOV buyers
- Category loyalists (customers who repeatedly buy in one category)
- Subscription or replenishment customers
Many businesses now [send high-value and new-customer signals back to ad platforms](https://www.productmetrics.io/server-side-tracking) so algorithms can optimize against them, rather than optimizing purely for last-click revenue.
### Step 2: Map Cohorts Back to Products
Next, answer: *Which products create these customers?*
For each SKU or category, compute:
- Share of orders from new customers
- Share of orders from your high-LTV cohort
- Average number of repeat orders tied to that product over 6–12 months
- Average gross profit per order (not just revenue)
This turns your catalog into a **customer-signal map**:
- Some products are **gateway SKUs**: low to medium margin but excellent at acquiring new customers who later buy profitable items.
- Others are **profit anchors**: high margin, high repeat rate, often purchased by existing customers.
- Some are **category expanders**: they get buyers to try a new category they haven’t purchased before.
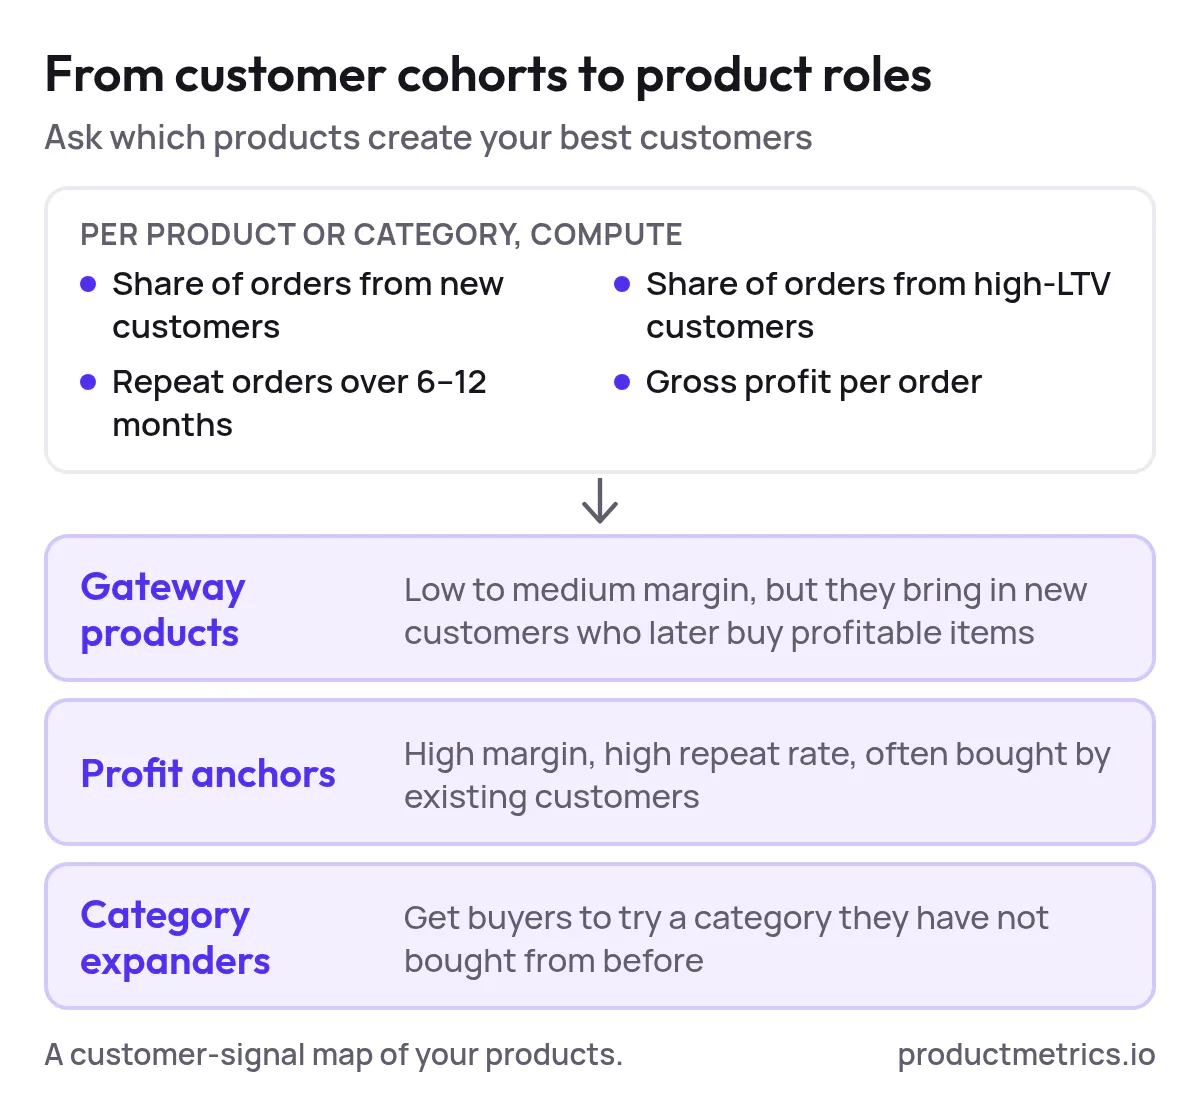
_Four customer metrics per product are enough to give every product a role: gateway, profit anchor or category expander._
### Step 3: Translate Customer Signals Into Feed Attributes
You now want Google to “see” those roles inside your feed.
Common patterns include:
- `custom_label_0`: acquisition_role → `gateway`, `anchor`, `expander`
- `custom_label_1`: margin_tier → `low`, `mid`, `high`
- `custom_label_2`: lifecycle → `new`, `evergreen`, `clearance`
- `custom_label_3`: stock_health → `overstock`, `normal`, `low`
Feed-rule and [product-segmentation tools](https://www.productmetrics.io/blog/google-shopping-segmentation-software) often let you set IF/THEN rules based on stock, margin, recent sales, etc., then push those [custom labels](https://www.productmetrics.io/glossary/custom-labels) directly into Merchant Center and your PMax listing groups.
ProductMetrics can sit on top of your order and customer data, compute these roles automatically, and keep labels fresh as behavior shifts—so a product that stops acquiring new customers is no longer treated as a gateway SKU.
### Step 4: Reflect Those Roles in PMax Asset Groups and Targets
With labels in place, structure your PMax like this:
- **Gateway asset group**
- Listing group filter: `custom_label_0 = gateway`, exclude very low margins.
- Goal: new-customer growth; more flexible ROAS target.
- Audience signals: broad in-market and affinity segments, plus lookalikes of high-LTV buyers.
- **Profit anchor asset group**
- Listing group filter: `custom_label_0 = anchor`, `margin_tier ∈ {mid, high}`.
- Goal: profit-focused ROAS or POAS; tighter efficiency targets.
- Audience signals: existing customers and remarketing lists.
- **Clearance / long-tail asset group**
- Listing group filter: `lifecycle = clearance OR (sales_last_60_days = 0)`.
- Goal: clean up inventory with strict bids and caps.
This way, PMax learns on coherent product roles tied directly to your customer strategy instead of a flat catalog.
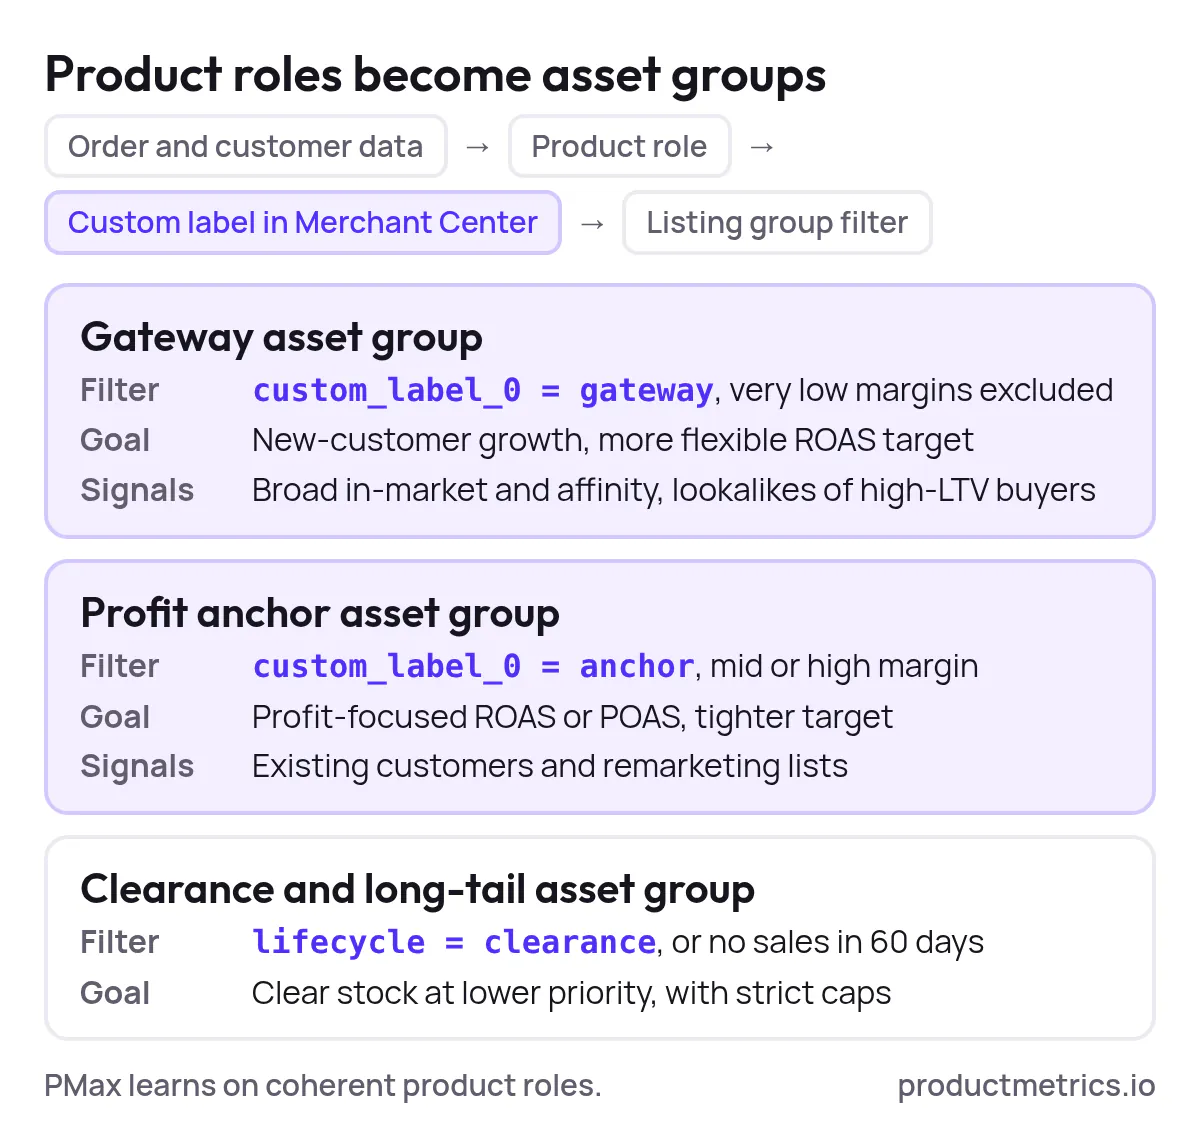
_Once the role sits in a custom label, each asset group gets its own filter, goal and audience signals, without rebuilding the campaign._
## Effective PMax Product Segmentation Techniques for Better ROI
Once customer and product data are connected, you can deploy segmentation playbooks that reliably move ROAS and profit.
### 1. Profit and POAS Based Product Tiers
Instead of optimizing only to revenue, mature teams increasingly optimize for **[profit on ad spend (POAS)](https://www.productmetrics.io/glossary/poas)**, [feeding gross profit back as the conversion value](https://www.productmetrics.io/blog/poas-vs-roas). Combine that with margin-based product labels to create three simple tiers inside PMax:
1. **Protect** – low-margin, low-profit SKUs. Conservative bids, [strict ROAS/POAS targets](https://www.productmetrics.io/break-even-roas-calculator).
2. **Grow** – mid-margin or gateway products that drive valuable new customers. Moderate bids, flexible targets.
3. **Dominate** – high-margin profit anchors. Assertive bids where impression share is strategically important.
You can maintain a single campaign for simplicity but enforce these tiers via listing-group bid adjustments, budget allocations, and feed rules.
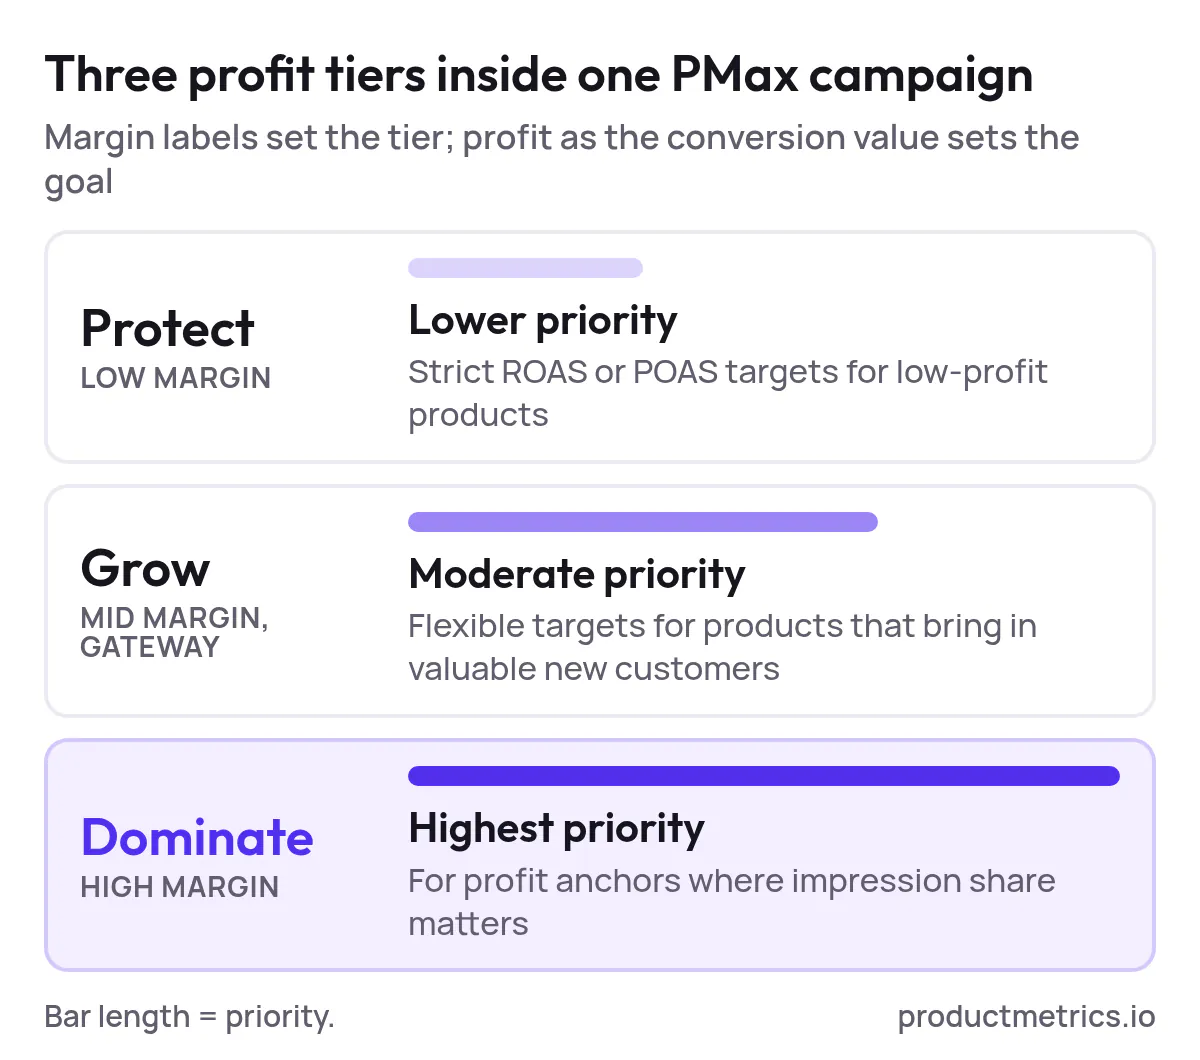
_Three tiers are enough: low-margin products get lower priority, high-margin anchors get the highest, all inside one campaign._
### 2. Lifecycle Segmentation New Evergreen Clearance
Feed attributes and custom labels let you segment by product lifecycle:
- **New arrivals:** Higher budgets, more exploratory audience signals, looser targets while the model learns.
- **Evergreen heroes:** Stable bidding with tight efficiency expectations.
- **Clearance/legacy:** Discounted pricing but controlled bids to avoid over-spending on end-of-life stock.
Automated rules that [watch stock quantity and recent sales](https://www.productmetrics.io/inventory-insights) can move SKUs between these lifecycle buckets without human intervention.
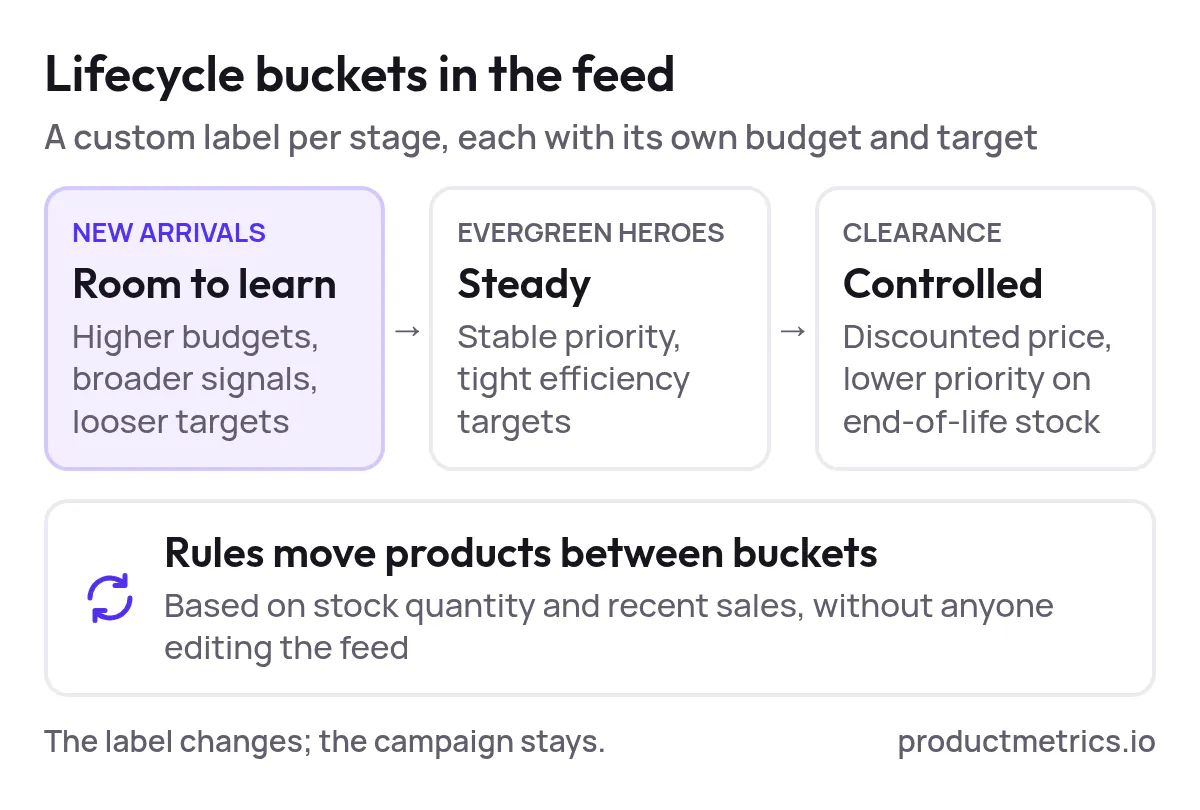
_The lifecycle label changes as stock and sales change, so a product moves from new arrival to evergreen to clearance without a campaign rebuild._
### 3. Acquisition vs Retention Product Roles
Use your customer mapping to identify products that:
- Mostly attract **new** customers, or
- Mostly serve **existing** customers.
Then:
- Build an acquisition-focused asset group that excludes recent converters and prioritizes gateway products.
- Build a retention-focused group for profit anchors, using existing-customer lists as signals and more personalized creative.
This aligns campaign goals with real customer journeys instead of treating every product click as equal.
### 4. Category and Price Band Segmentation
[Classic Shopping structures](https://www.productmetrics.io/blog/product-segmentation-google-shopping-pmax) remain relevant in PMax:
- Segment by **category → product type → item ID** to align with how shoppers browse and how you measure performance.
- Layer in **price bands** (e.g., `<$50`, `$50–$150`, `>$150`) so you can:
- Tighten bids on premium products where CPCs are justified.
- Relax bids on entry-level items that introduce people to the brand.
The key is not to explode into dozens of tiny groups; keep segments large enough to gather statistically meaningful data.
### 5. Zombie and Low Quality Product Isolation
Across many PMax accounts, a small subset of SKUs drives the majority of conversions, while [a long tail receives impressions but no sales](https://www.productmetrics.io/blog/performance-max-for-ecommerce). Feed-automation strategies that:
- Flag SKUs with zero sales over the last 30–60 days above a price threshold, and
- Move them into a **low-bid, low-priority asset group**
help you keep catalog coverage without letting these products [drain spend from proven winners](https://www.productmetrics.io/product-segmentation).
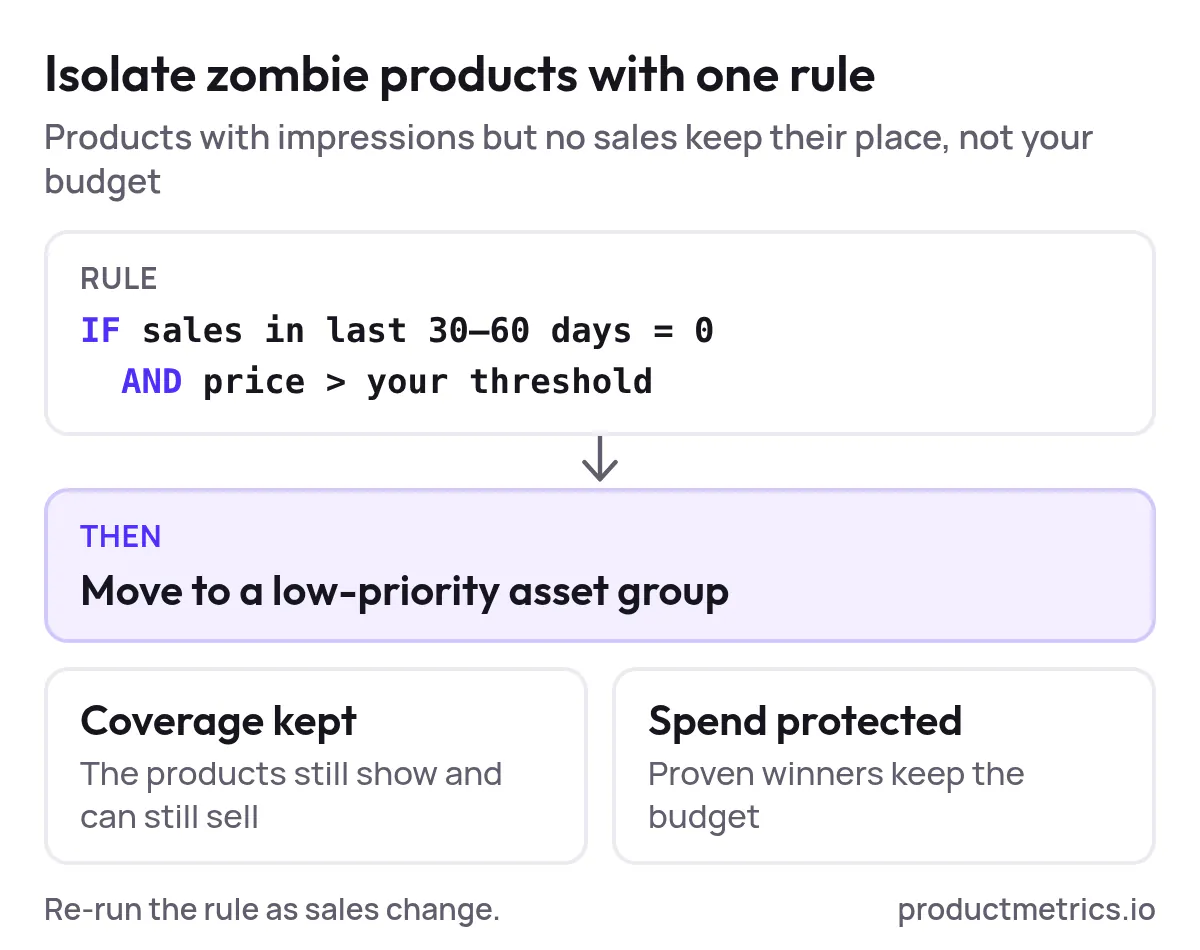
_One rule on sales and price moves zombie products to a low-priority asset group: they stay visible, and proven winners keep the budget._
> **Get more performance out of Performance Max.** Give your best-performing products more priority, segmented on your own data. [Analyse your products for free](https://app.productmetrics.io/) Log in with Google, no credit card.
## How to Optimize Product Listings for PMax Segmentation
Segmentation doesn’t work if Google can’t understand your products. Listing optimization is what turns your segments into **machine-readable intent signals**.
### Focus on Titles and Product Data Structure
For Shopping-driven PMax performance, your [product title](https://www.productmetrics.io/blog/google-shopping-product-title-optimization) is effectively both your **headline** and your primary **keyword signal**. Best practices from high-performing Shopping programs include:
- Front-load critical details (brand, product type, key attribute) in the first ~70 characters.
- Include differentiating attributes like size, color, material, or model.
- Keep titles tightly aligned with the product and landing page—no promotional fluff.
In your feed schema:
- Use consistent, hierarchical **product_type** values (e.g., `Shoes > Running Shoes > Road Running`).
- Ensure correct **[Google product category](https://www.productmetrics.io/blog/google-shopping-category)** values so you appear in the right auctions.
- Standardize brand names, gender, age group, and other required attributes.
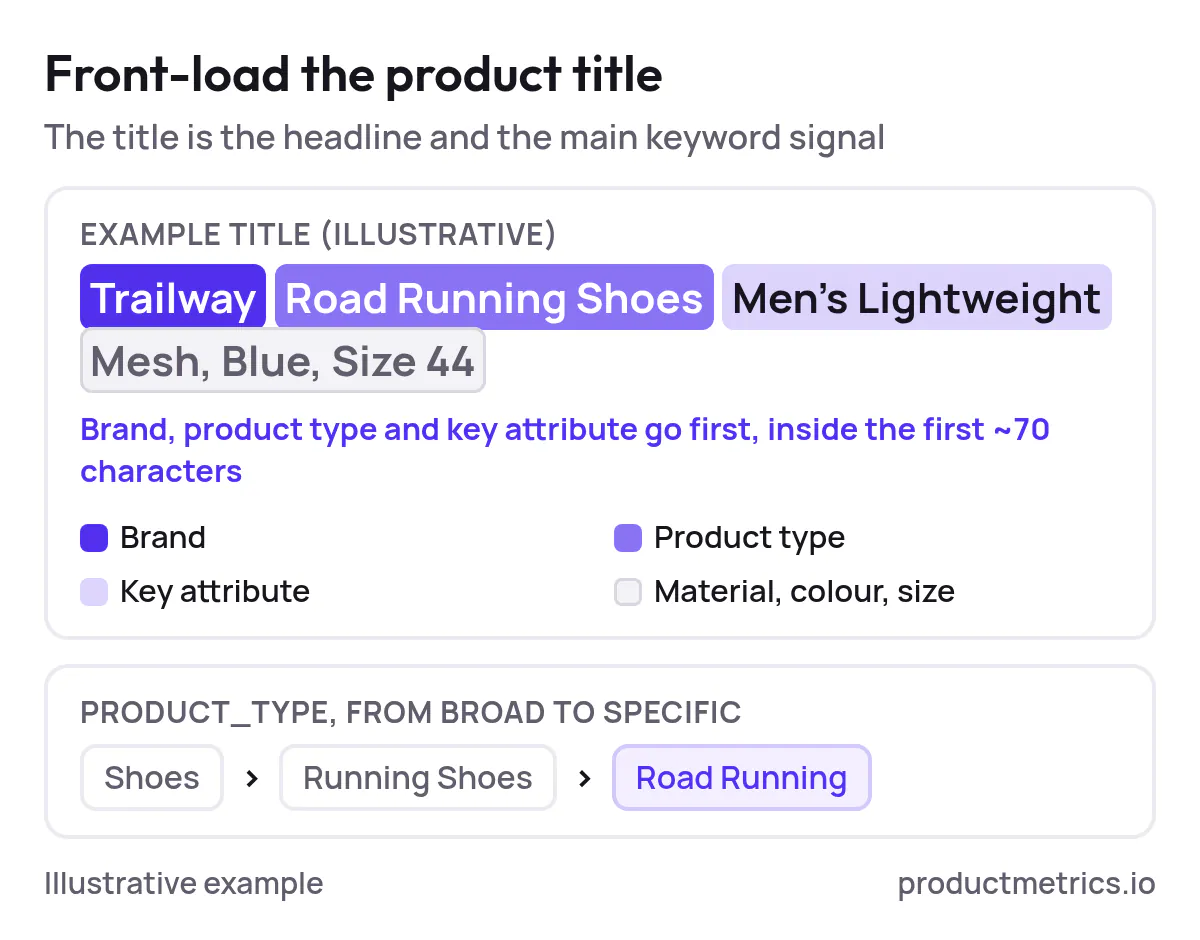
_Brand, product type and key attribute lead the title, and product_type runs from broad to specific (illustrative example)._
### Use Custom Labels as the Connective Tissue
Custom labels are the bridge between your **data strategy** and your **campaign structure**. By encoding margin, lifecycle, acquisition role, and stock health in labels, you can:
- Filter listing groups quickly without rebuilding the campaign.
- Adjust bidding and targets at the segment level.
- Run clean performance comparisons: e.g., `gateway` vs. `anchor` products at the same ROAS target.
Tools that combine feed management with automation rules make it straightforward to keep these labels current as margins and inventory shift. ProductMetrics can plug into the same workflow, but with the added layer of **customer-level signals** baked in.
### Don’t Forget Creatives and Assets
For asset groups that lean heavily on YouTube, Display, or Discovery inventory, your product segments should be reflected in:
- Creative angles (acquisition segments focus on education and social proof; anchor segments focus on urgency and upsell).
- Value propositions (price/discount vs. quality/longevity).
- Landing-page experiences tailored to the segment’s role.
## How to Analyze PMax Product Segmentation Results
Segmentation only pays off if you measure it.
Key views and metrics to monitor include:
- **By asset group / listing group**
- ROAS or POAS
- Conversion rate and revenue per click
- Impression share and search lost IS (budget vs. rank)
- **By label (custom_label_0/1/2)**
- New-customer orders vs. returning
- Average order value and gross profit per order
- Contribution to overall revenue and profit
- **By lifecycle**
- Sell-through speed for new products
- Stockout risk and overstock exposure
Use these views to answer:
- Are gateway products actually feeding high-LTV customers into the funnel?
- Are clearance segments clearing inventory efficiently, or just burning spend?
- Are high-margin anchors getting the impression share their profit contribution warrants?
When volume is limited, prioritize **simple, high-contrast tests** (three margin tiers instead of seven; two lifecycle buckets instead of five) so PMax can learn on robust datasets.
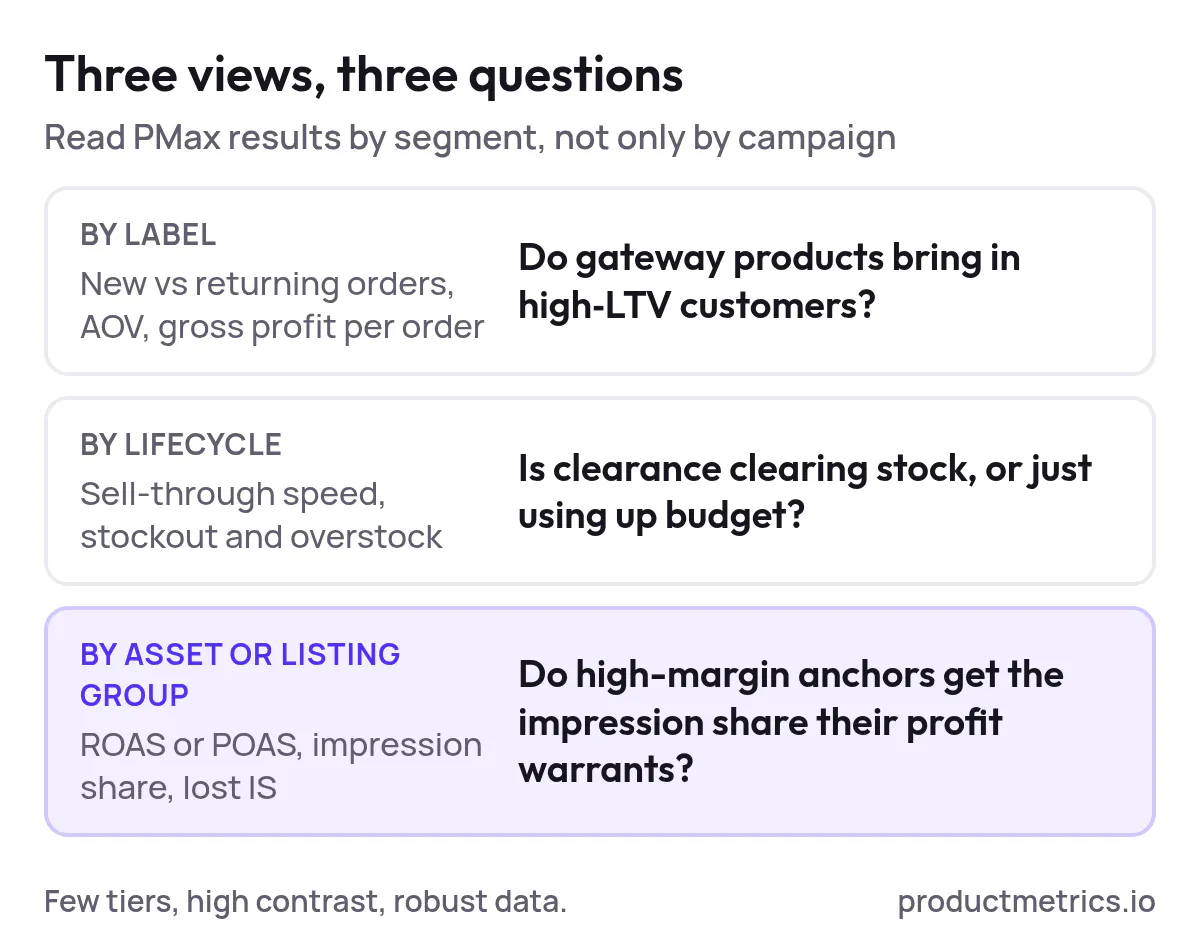
_Each view answers one question: whether gateways bring in high-LTV customers, whether clearance clears stock, and whether anchors get their share._
## What Are the Latest Trends in Google Shopping Campaign Segmentation?
Several macro-shifts are reshaping how sophisticated teams think about Shopping and PMax segmentation:
1. **From Channel Thinking to Signal Thinking**
With PMax dominating Shopping inventory for many advertisers, the real game is no longer “Standard vs. PMax” but “How strong are my signals?” Robust first-party data, offline conversions, and high-quality product attributes are becoming the main levers.
2. **More Transparency and Levers Inside PMax**
Google has steadily added search-term reporting, campaign-level negatives, channel-performance reports, and now channel-priority controls. These don’t replace segmentation, but they make good segmentation far more actionable.
3. **Profit and Business Outcome Optimization**
Advanced teams are sending profit, new-customer value, and category-expansion signals back to PMax instead of optimizing to top-line revenue alone. This makes product segmentation by margin, acquisition role, and category impact a central strategic task.
4. **Automation of Feed and Signal Engineering**
Manual spreadsheet-driven feed tweaks can’t keep pace with dynamic catalogs. Automated product-feed management and “signal engineering” platforms are emerging as core infrastructure, piping clean, enriched product and customer signals into PMax 24/7.
5. **Consolidation Over Fragmentation**
As machine-learning models mature, the consensus is shifting away from hyper-granular campaign structures toward consolidated setups with clear, high-contrast segments. This preserves learning efficiency while still encoding your business logic via labels and asset groups.
In short: the frontier is no longer trick bids or hacks—it’s **data design**.
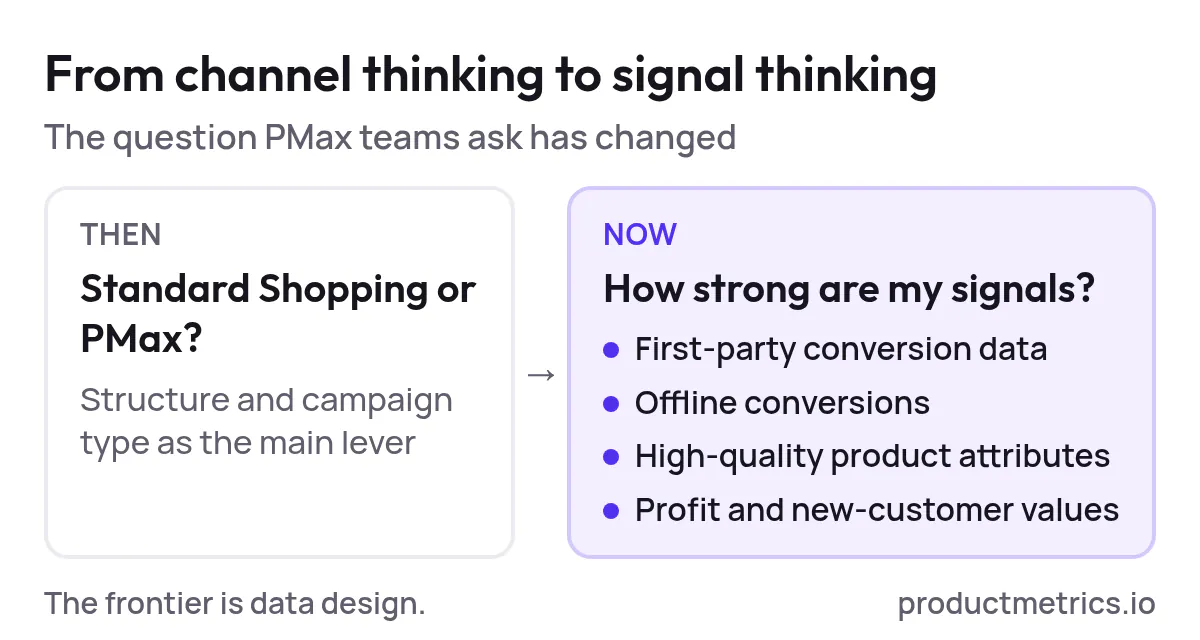
_The question has moved from which campaign type to run to how strong the signals are that every campaign type learns from._
## Operationalizing Data-Driven PMax With ProductMetrics
Building and maintaining this level of segmentation by hand is painful. That’s where ProductMetrics can become your [operating layer for Shopping and PMax](https://www.productmetrics.io/performance-max).
A typical ProductMetrics-powered workflow looks like this:
1. **Unify product and customer data**
Connect your ecommerce platform, analytics, and CRM so order- and customer-level data is available alongside your catalog.
2. **Compute meaningful product roles**
Define business rules once (e.g., margin thresholds, high-LTV cohorts, stock bands), then let ProductMetrics continuously calculate which SKUs are gateways, anchors, or clearance based on live data.
3. **Write roles into your feed**
Sync those roles into Merchant Center via custom labels and structured attributes so your PMax campaigns can see and act on them.
4. **Monitor performance by segment, not just by campaign**
Use dashboards that surface ROAS/POAS, new-customer contribution, and profit by segment, helping your team iterate on segmentation and targets instead of guessing.
5. **Feed insights back into merchandising and pricing**
When you know which products actually create high-value customers or expand categories, merchandising, pricing, and inventory planning can all respond in lockstep.
## Next Steps
If you’re running PMax today and feel like performance is plateauing, the fastest path to a step-change is usually **better inputs, not more budgets**.
To recap:
- Start by mapping high-value customer cohorts and tying them back to products.
- Encode those insights into your feed via custom labels and structured attributes.
- Consolidate campaigns around a few clear product roles and lifecycle stages.
- Optimize listings so Google can easily understand and categorize your products.
- Measure performance at the segment level and iterate.
When you’re ready to turn this into an always-on system rather than an annual restructuring project, talk to the ProductMetrics team about a **PMAX product-segmentation audit** and see where your biggest signal gaps are.
## Keep reading.
- [PMAX Product Segmentation: A Setup‑to‑Scale Playbook for Google Shopping](https://www.productmetrics.io/blog/pmax-product-segmentation)
- [Product Segmentation Marketing: Six Segments, Six Actions](https://www.productmetrics.io/blog/product-segmentation-marketing)
- [Performance Max For New Customers - Setup, Value Rules, And Bidding Uplifts](https://www.productmetrics.io/blog/performance-max-new-customers)
---
Written by Berend Vrakking, founder of Product Metrics. Last updated 2026-11-09.
1M+ products analysed · Nominated at the Dutch Search Awards for Best Measurement Campaign (2023) and Best Use of Data (2024)
HTML version: https://www.productmetrics.io/blog/data-driven-pmax