---
title: "The 2026 Ecommerce ROAS Optimization Tools Landscape - How Performance Teams Evaluate, Pilot, and Scale"
description: "The 2026 ecommerce ROAS optimization tools landscape - how performance teams evaluate, pilot and scale Google Shopping tools with custom dashboards."
canonical: "https://www.productmetrics.io/blog/ecommerce-roas-optimization-tools"
pageType: article
language: en
publisher: "Product Metrics"
author: "Berend Vrakking"
datePublished: 2026-11-01
dateModified: 2026-11-01
image: "https://www.productmetrics.io/og/blog/ecommerce-roas-optimization-tools.png"
---
> Content index: https://www.productmetrics.io/llms.txt
# The 2026 Ecommerce ROAS Optimization Tools Landscape - How Performance Teams Evaluate, Pilot, and Scale
## Key takeaways
- What actually qualifies as **“ecommerce ROAS optimization tools for Google Shopping with custom reporting dashboards.”**
- Practical evaluation frameworks performance teams use to shortlist tools.
- How to design pilots that prove impact before you roll a platform out across your whole catalog.
## TL;DR for Busy Ecommerce Performance Teams
If you run Google Shopping or [Performance Max](https://www.productmetrics.io/glossary/performance-max "Performance Max is a goal-based Google Ads campaign type that uses automation to reach customers across Google advertising channels.") in 2026, you’re already living in an AI‑first world. Google’s automated bidding and cross‑channel campaigns can drive strong [ROAS](https://www.productmetrics.io/glossary/roas "Return on ad spend (ROAS) is the revenue your ads generate for every euro you spend on them."), but only when you have the right supporting stack: feed tooling, experimentation, and—crucially—customizable reporting dashboards that expose product‑level performance.
This guide takes a category‑level, vendor‑agnostic look at:
- The full spectrum of [ecommerce ROAS optimization tools for Google Shopping](https://www.productmetrics.io/blog/google-shopping-roas-optimization-tools).
- What actually qualifies as **“ecommerce ROAS optimization tools for Google Shopping with custom reporting dashboards.”**
- Practical evaluation frameworks performance teams use to shortlist tools.
- How to design pilots that prove impact before you roll a platform out across your whole catalog.
## 1. Why ROAS Optimization on Google Shopping Looks Different in 2026
### 1.1. AI‑First Campaign Types Are Now the Default
Performance Max campaigns give advertisers access to all major Google Ads channels—Search, YouTube, Display, Discover, Gmail and Maps—from a single campaign, using Google’s AI to maximize conversions or conversion value against your bidding goal. (Source: [Google Ads Help](https://support.google.com/google-ads/answer/14587068?hl=en))
Google positions Performance Max as the campaign type that “drives the strongest performance and ROAS across all of Google’s channels,” and reports that Google AI‑powered Performance Max delivers higher ROAS and sales effectiveness than Search‑only strategies on average. (Source: [Google Ads Help](https://support.google.com/google-ads/answer/12851703?hl=en))
For ecommerce advertisers, that means:
- You’re rarely running **pure Standard Shopping** in isolation anymore.
- Most incremental lift comes from **value‑based Smart Bidding** ([Maximize conversion value](https://www.productmetrics.io/glossary/maximize-conversion-value "Maximize conversion value is a Google Ads Smart Bidding strategy that sets each bid to get the most conversion value from your budget, rather than the most conversions.") with or without a [target ROAS](https://www.productmetrics.io/glossary/target-roas "Target ROAS is the average conversion value per unit of advertising cost that you ask Google Ads to aim for.")) and better signals, not from manual bid micromanagement. (Source: [Google Ads Help – Bidding](https://support.google.com/google-ads/faq/10286469?hl=en))
### 1.2. Value‑Based Bidding Raises the Bar on Measurement
Target ROAS and Maximize conversion value bidding strategies use Google’s Smart Bidding to predict the value of each potential conversion and bid accordingly, so they are only as good as the values and signals you feed them. (Source: [Google Ads Help – About Target ROAS](https://support.google.com/google-ads/answer/6268637?hl=en-419))
Google’s own value‑based bidding guidance emphasizes:
- Tracking **actual revenue or profit‑aligned values** on all relevant campaigns before switching to target ROAS.
- Avoiding overly tight budgets when you’re using target ROAS, so the system can actually find incremental conversion value. (Source: [Google Value‑Based Bidding Best Practices](https://services.google.com/fh/files/emails/value_based_bidding_best_practice_guide.pdf))
That pushes more responsibility onto your **tools and dashboards**:
- You need product‑level views of **revenue, margin, and stock**, not just campaign‑level ROAS.
- You need customizable reporting dashboards that can surface where Smart Bidding is starved of signal versus where it’s overspending.
### 1.3. Product‑Level Reporting Is Finally First‑Class
In June 2026, Google expanded **product reporting** so that product‑level metrics like cost and conversions are now available across more campaign types (Performance Max, Standard Shopping, Video, App and Demand Gen) instead of being limited to Shopping on Search. (Source: [Google Ads Help – About Product Reporting](https://support.google.com/google-ads/answer/17035334?hl=en))
That matters for ROAS optimization tools because it:
- Gives you a centralized product‑level view across campaigns.
- Makes it easier to detect when the same SKU appears in multiple campaigns and is cannibalizing performance.
- Provides the raw data that third‑party tools and custom dashboards can reshape into **[product‑level ROAS or POAS (profit on ad spend)](https://www.productmetrics.io/blog/poas-vs-roas)** views.
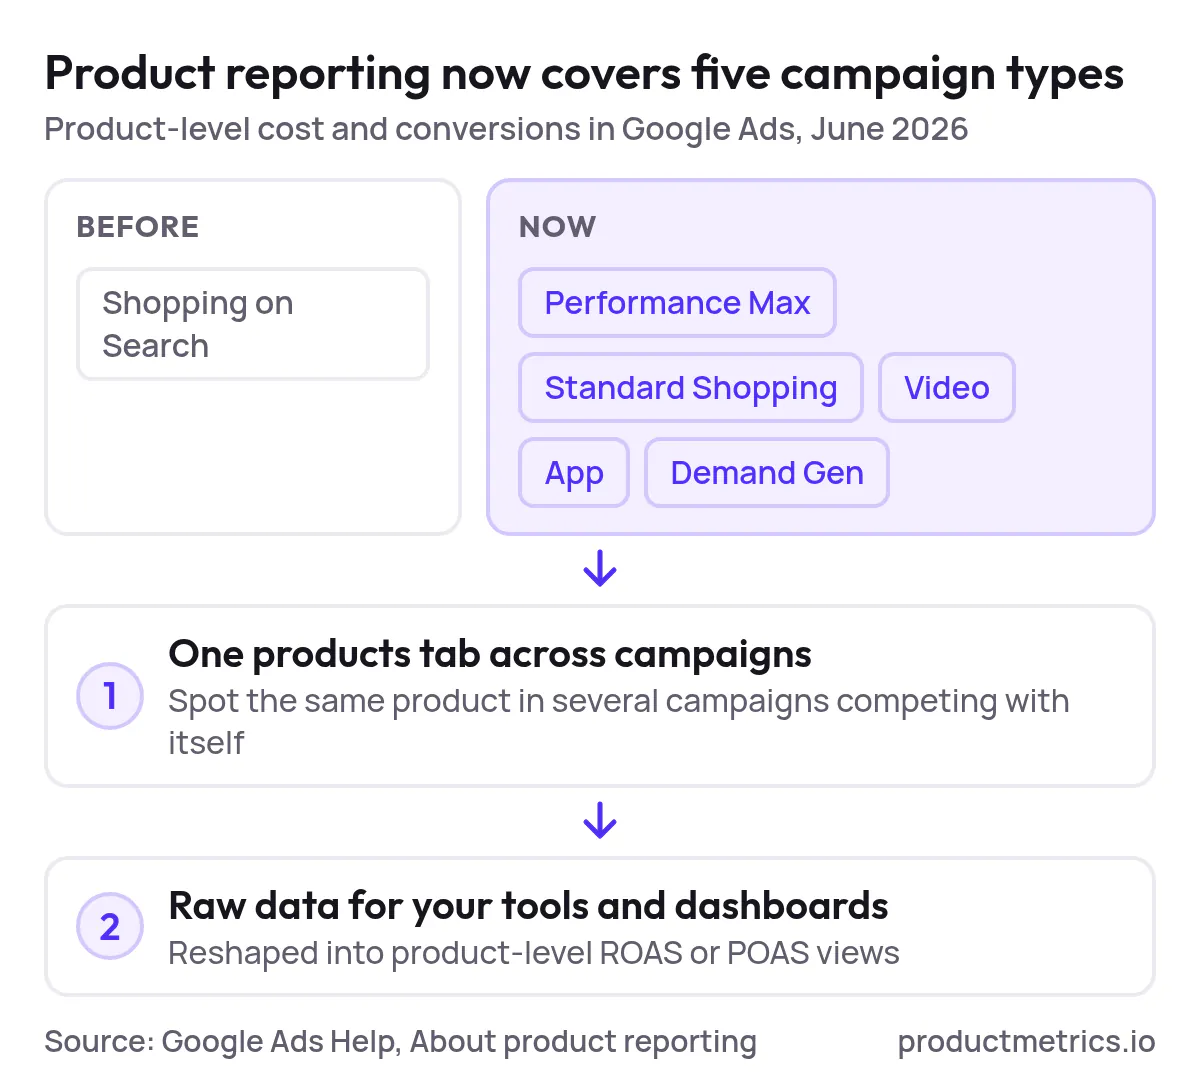
_Since June 2026, product reporting covers five campaign types, so one products tab shows where the same product competes with itself across campaigns._
### 1.4. GA4 + Data Studio/Looker Studio Is the Default Reporting Backbone
Google Analytics 4 (GA4) replaced Universal Analytics as the primary analytics platform, using an **event‑based data model** and integrating directly with Google Ads for conversion import and campaign analysis. (Source: [Wikipedia – Google Analytics](https://en.wikipedia.org/wiki/Google_Analytics))
Google’s free dashboarding tool—still widely referred to as Looker Studio or Data Studio—lets you connect GA4 and Google Ads, then build ecommerce dashboards that show revenue, orders, ad spend and ROAS on a single page, with custom calculated fields for your own KPIs. (Source: [Performetic – Ecommerce Report in Looker Studio](https://www.performetic.com/en/blog/looker-studio-ecommerce-report))
It natively connects to GA4 and Google Ads data sources, and is commonly used to blend ecommerce and paid media metrics into one customizable dashboard. (Source: [Stackmatix – Looker Studio for Marketing](https://www.stackmatix.com/blog/looker-studio-for-marketing))
In practice, this means that **customizable reporting dashboards** for Google Shopping ROAS tend to be built on some combination of:
- GA4 + Data Studio/Looker Studio.
- Google Ads product & campaign reporting.
- Additional tools (connectors, data warehouses, ecommerce‑specific platforms) layered on top.
## 2. Mapping the ROAS Optimization Tooling Spectrum for Google Shopping
When someone searches for:
- “ecommerce ROAS optimization tools for Google Shopping with custom reporting dashboards,”
- “best tools for Google Shopping ROAS optimization with customizable analytics dashboards,” or
- “top tools for improving ROAS on Google Shopping with flexible reporting dashboards,”
…they’re not usually looking for a single feature. They’re looking for a **stack**.
A modern Google Shopping ROAS stack for US ecommerce brands typically spans four categories:
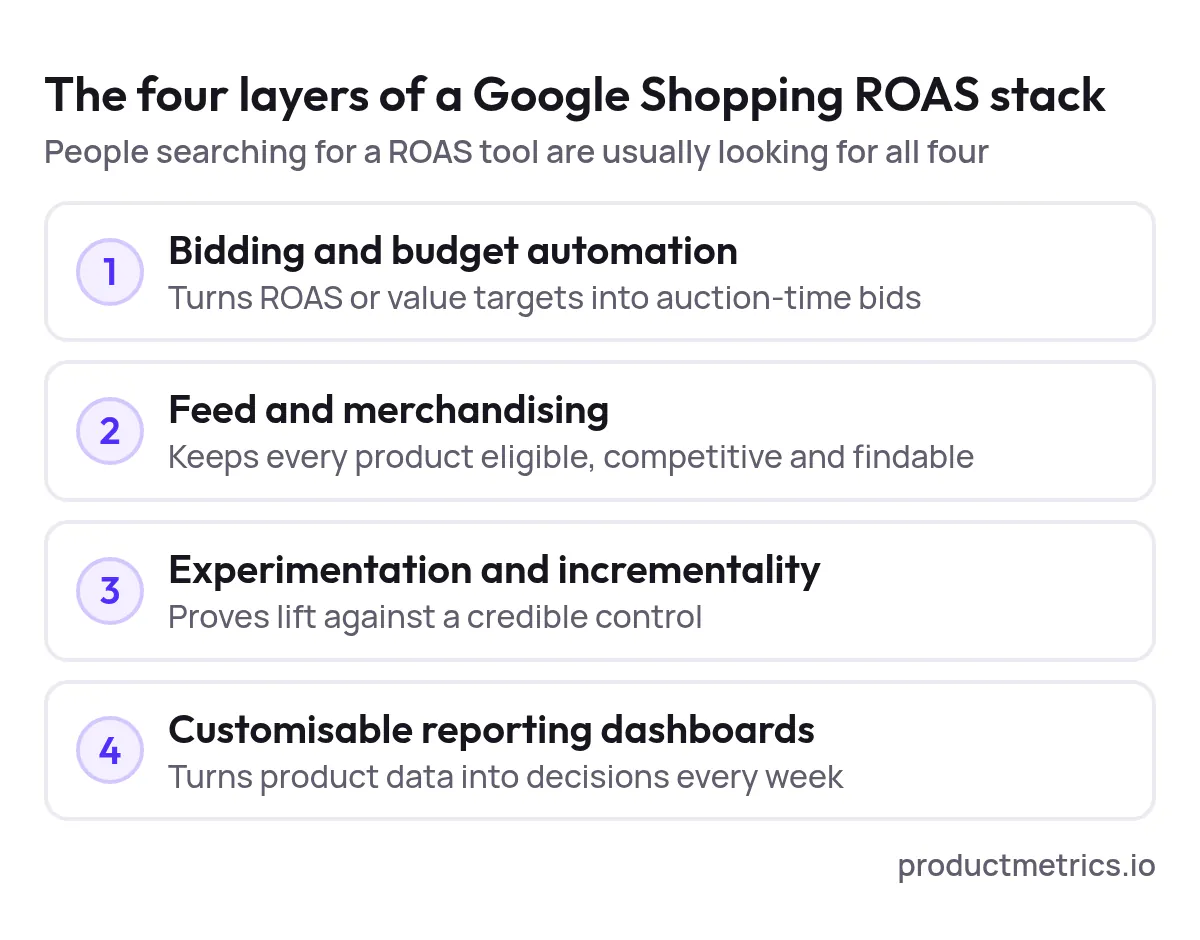
_A search for one ROAS tool is usually a search for a stack: bidding, feed, experiments and dashboards each solve a different part._
### 2.1. Bidding and Budget Automation
**Role:** Turn your ROAS or value targets into auction‑time bids across millions of queries.
Examples of capabilities (native or third‑party):
- Value‑based bidding strategies (Maximize conversion value, Target ROAS). (Source: [Google Ads Help – Bidding](https://support.google.com/google-ads/faq/10286469?hl=en))
- Cross‑channel optimization via Performance Max campaigns.
- Rule‑based or AI‑assisted budget allocation across campaigns and product segments.
Key questions for this layer:
- Can it respect profit or POAS constraints, not just revenue ROAS?
- Can it treat [product segments](https://www.productmetrics.io/product-segmentation) (e.g., “Stars” vs. “Drainers”) differently based on their true economics?
### 2.2. Feed and Merchandising Tools
**Role:** Ensure every product is eligible, competitive, and findable.
Typical capabilities:
- Feed health monitoring and sync with Google Merchant Center.
- [Title, description, and attribute optimization](https://www.productmetrics.io/google-shopping-feed/optimization) at scale.
- [Competitive pricing and availability context](https://www.productmetrics.io/competitor-prices) at the product level.
For instance, Google’s own Shopping product reporting highlights how disapprovals, limited eligibility, and price versus competitors all affect whether products can show and win auctions. (Source: [Google Ads Help – About Product Reporting](https://support.google.com/google-ads/answer/17035334?hl=en))
Third‑party tools increasingly combine this with **market price position** and stock data to decide which SKUs to push, pause or re‑price in Shopping campaigns. (Source: [Product Metrics – Product‑Level Optimization](https://www.productmetrics.io/))
### 2.3. Experimentation and Incrementality Tooling
**Role:** Prove whether changes in bidding, feed strategy, or tooling actually improve ROAS and profit.
This layer can be:
- Built‑in (Google’s A/B experiment framework for comparing Performance Max to Standard Shopping). (Source: [Google Shopping Solutions – Tools for Performance Max](https://www.shoppingsolutions.withgoogle.com/expertise/tools-for-performance-max-campaigns))
- External [experimentation or MMM platforms](https://www.productmetrics.io/blog/incrementality-testing).
- Lightweight, using geo splits or product‑group splits plus rigorous reporting.
The goal is always the same: go beyond “the ROAS went up” to **“we measured an incremental lift vs. a credible control.”**
### 2.4. Analytics and Customizable Reporting Dashboards
**Role:** Turn raw performance and product data into decisions a performance team can act on every week.
These can be:
- GA4 + Data Studio/Looker Studio dashboards that blend ecommerce and Google Ads metrics, including ROAS. (Source: [Bay20 – Custom GA4 Ecommerce Dashboard](https://www.bay20.com/building-a-custom-ga4-e-commerce-dashboard-in-looker-studio/))
- [Ecommerce analytics platforms](https://www.productmetrics.io/blog/ecommerce-analytics-platform) that aggregate ad spend, revenue, and customer metrics into a single view.
- Specialized **product‑level Google Shopping analytics** focused on segmenting products by clicks and return, then pushing labels back into Merchant Center for bidding rules. (Source: [Product Metrics – Product Segmentation](https://www.productmetrics.io/))
For Google Shopping ROAS work, the most valuable dashboards are typically:
- **Product‑centric:** You can sort, filter, and segment by SKU, category, margin band, and stock status.
- **Campaign‑aware:** You can see how Performance Max and Standard Shopping are allocating impressions and spend by product.
- **Profit‑aligned:** You can switch between ROAS, POAS, and contribution margin views.
- **Customizable:** PPC managers can change dimensions, metrics, and thresholds without needing engineering or BI every time.
## 3. What Really Counts as “Ecommerce ROAS Optimization Tools for Google Shopping With Custom Reporting Dashboards”
From a performance team’s point of view, a tool fits this description if it does three things **together**:
1. **Understands product‑level economics** (revenue, margin, and inventory) for items advertised via Google Merchant Center. (Source: [Google Ads Help – About Product Reporting](https://support.google.com/google-ads/answer/17035334?hl=en))
2. **Connects that product view to Google Ads data** (impressions, clicks, cost, conversions, conversion value, ROAS) either directly or via GA4 and official connectors. (Source: [Stackmatix – Looker Studio for Marketing](https://www.stackmatix.com/blog/looker-studio-for-marketing))
3. **Surfaces all of that in customizable dashboards**, where you can:
- Slice performance by product segments, brands, categories, and campaigns.
- Build custom metrics like POAS, blended CAC or LTV‑based ROAS.
- Save and share views that match how your team works.
If a platform only runs bids but doesn’t give you a flexible analytics layer, it’s a **bidding tool**, not a full ROAS optimization solution. If it only offers a static report you can’t customize, it’s **reporting**, not optimization.
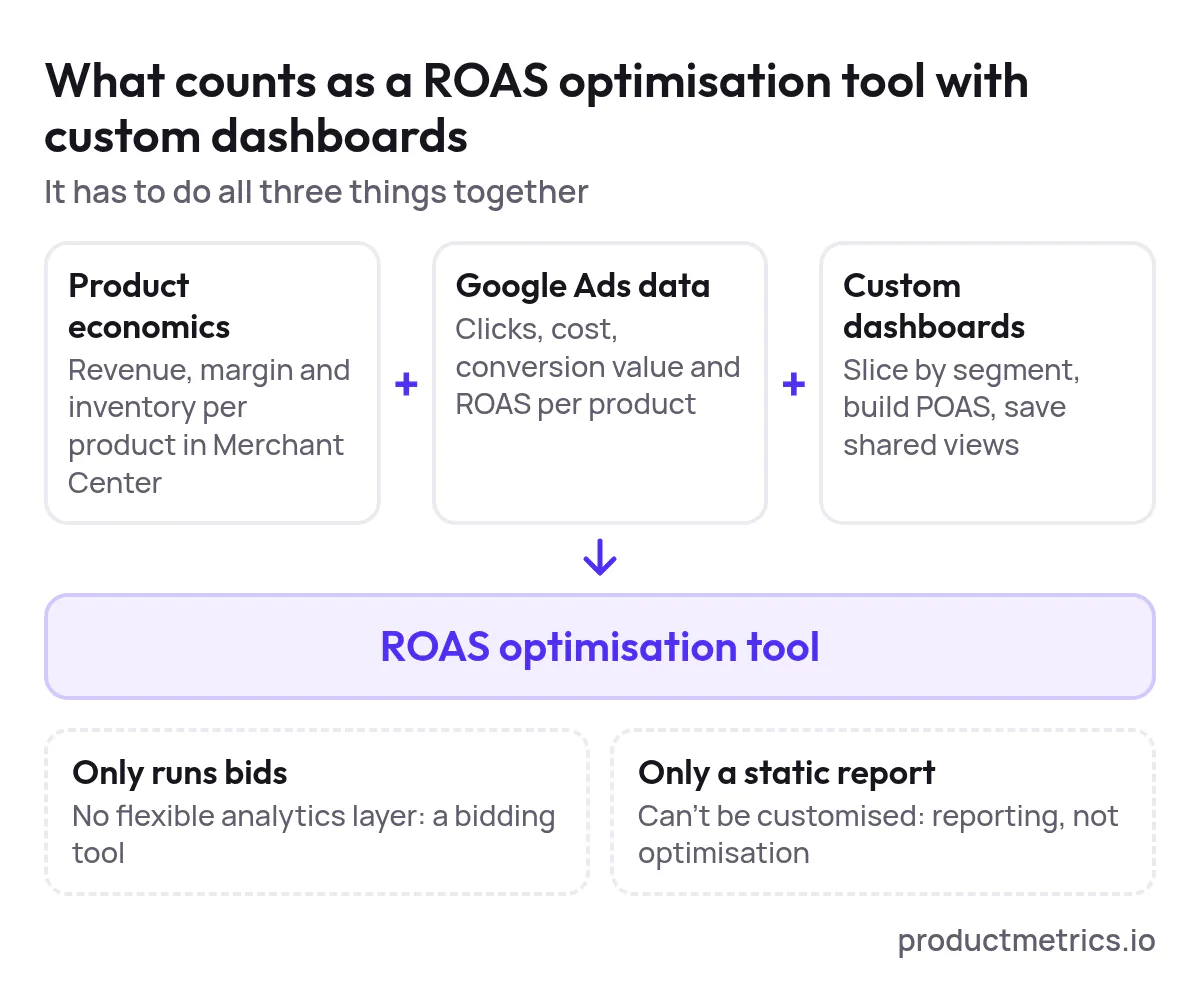
_Only a tool that joins product economics, Google Ads data and customisable dashboards qualifies; bids alone or a static report do not._
In the US ecommerce context, most high‑performing teams combine:
- Smart Bidding (often Performance Max with value‑based bidding). (Source: [Google Ads Developers – Performance Max](https://developers.google.com/google-ads/api/performance-max/getting-started?type=standard))
- Product‑level reporting and segmentation (either manually in product reporting or via tools that segment by clicks and return). (Source: [Product Metrics – Product Segmentation](https://www.productmetrics.io/))
- Custom dashboards in Data Studio/Looker Studio or similar BI tools that expose ROAS and profit per product and campaign. (Source: [Performetic – Ecommerce Report in Looker Studio](https://www.performetic.com/en/blog/looker-studio-ecommerce-report))
## 4. An Evaluation Framework Performance Teams Actually Use
When you evaluate **Google Shopping ROAS optimization tools with customizable dashboards**, you’re really answering five questions.
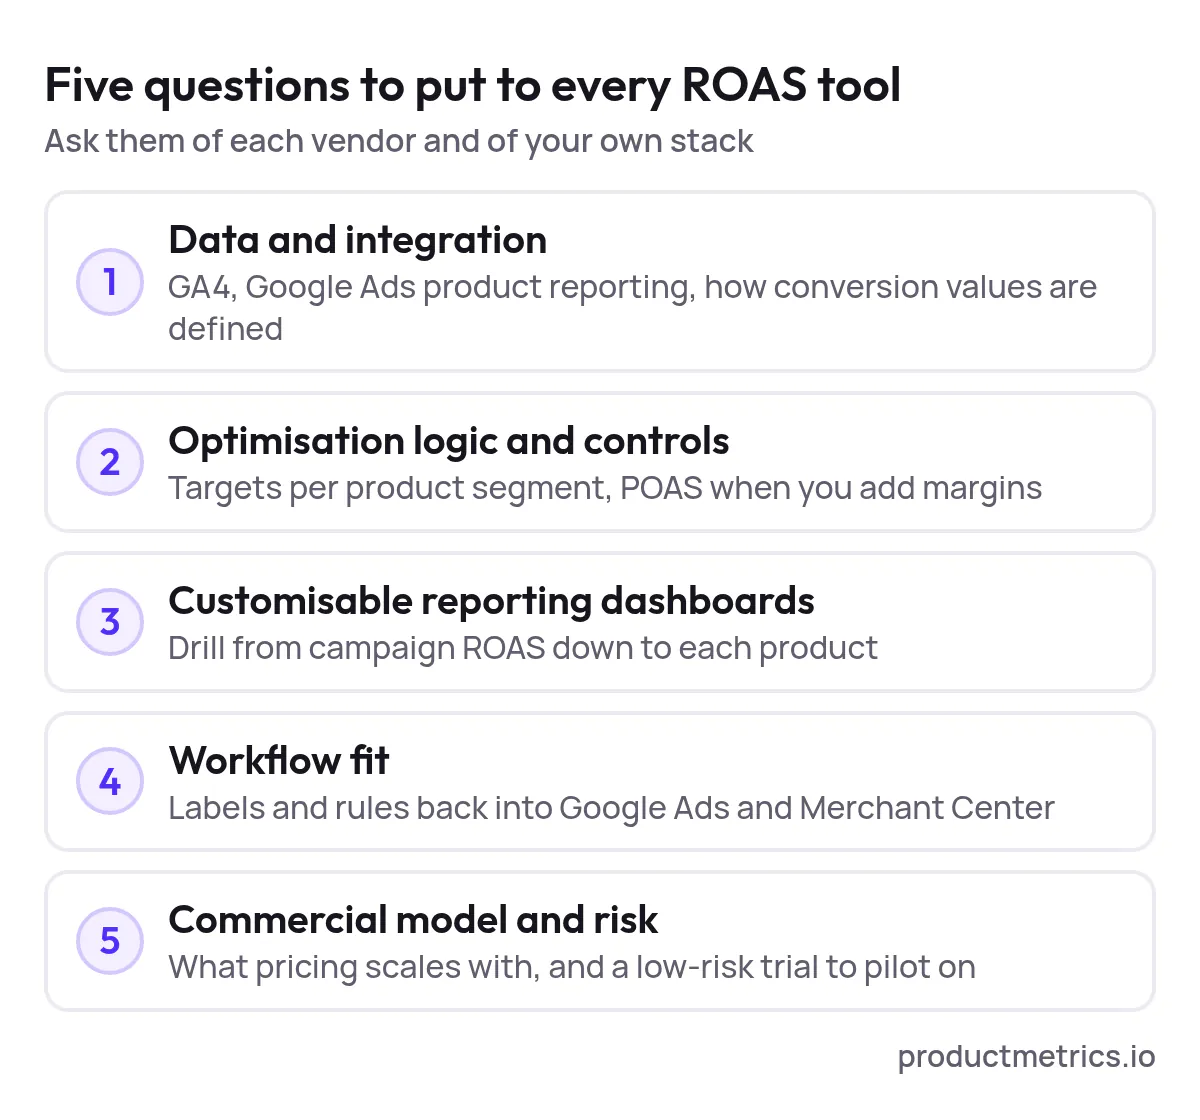
_Put the same five questions to every vendor, and to your own stack, before you shortlist._
### 4.1. Data and Integration
**Questions to ask vendors (and of your own stack):**
1. **What data sources are supported natively?**
At minimum, you’ll want GA4 and Google Ads; many teams also connect additional sources like Meta Ads or data warehouses into Data Studio/Looker Studio. (Source: [Stackmatix – Looker Studio for Marketing](https://www.stackmatix.com/blog/looker-studio-for-marketing))
2. **Is product‑level Google Ads reporting fully supported?**
In 2026, Google’s product reporting provides a central products tab with metrics across Performance Max, Shopping, Video, App and Demand Gen campaigns. Tools that don’t consume these newer views are already behind. (Source: [Google Ads Help – About Product Reporting](https://support.google.com/google-ads/answer/17035334?hl=en))
3. **How are [conversion values](https://www.productmetrics.io/glossary/conversion-value) defined?**
Are they pulled from GA4 ecommerce events, from Google Ads conversions, or both—and how are discrepancies handled?
### 4.2. Optimization Logic and Controls
Here you’re aligning the tool with Google’s Smart Bidding behavior:
- Does the platform assume **Target ROAS on every campaign**, or can it support Maximize conversion value without a target where budgets are tight or volatile? (Source: [Google Ads Help – Bidding](https://support.google.com/google-ads/faq/10286469?hl=en))
- Can you define **different targets by product segment**, not only per campaign (e.g., higher allowed CPA or lower ROAS for new‑customer or high‑LTV products)? (Source: [Google Ads Help – Retailer best practices for Performance Max](https://support.google.com/google-ads/answer/11546049?hl=en))
- Does it support **profit‑based metrics** like POAS when you supply cost of goods or margin data? (Source: [Product Metrics – Compare Alternatives](https://www.productmetrics.io/))
### 4.3. Customizable Reporting Dashboards
For the dashboard piece of **[“best tools for Google Shopping ROAS optimization with customizable analytics dashboards”](https://www.productmetrics.io/blog/google-shopping-roas-dashboard-tools)**, evaluate:
1. **Dashboard builder flexibility**
Data Studio/Looker Studio and similar tools let you build custom dashboards where you can add charts, tables, and scorecards for ROAS, revenue and orders, and define calculated fields like blended ROAS. (Source: [BeeCommercer – Data Studio Ecommerce Dashboard Guide](https://beecommercer.com/data-studio-ecommerce-dashboard-guide/))
2. **Product‑level drill‑downs**
Can you move seamlessly from campaign‑level ROAS to:
- Product‑level performance by SKU or item ID.
- Segments like “high spend, low return” vs “low spend, high return.”
- Inventory and price context alongside ad metrics. (Source: [Product Metrics – Product Segmentation](https://www.productmetrics.io/))
3. **Audience and funnel breakdowns**
GA4‑based dashboards often blend traffic sources, user behavior, and purchase data, giving you a funnel view that can be filtered down to Google Ads campaigns. (Source: [Performetic – Ecommerce Report in Looker Studio](https://www.performetic.com/en/blog/looker-studio-ecommerce-report))
4. **Shareability and governance**
Can non‑technical stakeholders easily access and interpret dashboards without breaking them? Are there role‑based views for PPC specialists vs. merchandisers vs. finance?
### 4.4. Workflow Fit
Even the best algorithm fails if it doesn’t fit team workflows.
- How does the tool slot into **weekly optimization routines** (bid adjustments, budget reallocation, product exclusions)?
- Can your team push actions (labels, rules, bid adjustments) back into Google Ads or Merchant Center without copy‑pasting CSVs?
- Does the tool support **[product‑level labels](https://www.productmetrics.io/glossary/custom-labels)** that can be used in Google Shopping campaigns for bidding and prioritization? (Source: [Product Metrics – Product Segmentation & Labels](https://www.productmetrics.io/))
### 4.5. Commercial Model and Risk
Finally, pressure‑test the economics:
- Does pricing scale with **ad spend, SKU count, seats, or data volume**?
- Are there **free or low‑risk trials** where you can run controlled pilots on a subset of spend before committing long‑term? (Source: [Product Metrics – Pricing & Free Analysis](https://www.productmetrics.io/))
> **Get more revenue out of Google Shopping.** Every product segmented and labelled in Merchant Center, so your top performers get more priority. [Analyse your products for free](https://app.productmetrics.io/) Log in with Google, no credit card.
## 5. Designing Pilots That Actually Prove ROAS Impact
A good pilot isolates whether a ROAS optimization tool (and its dashboards) changes outcomes—not just the way data is visualized.
### 5.1. Start With a Clear Hypothesis
Examples:
- “Product‑level segmentation plus dynamic labels will increase total conversion value at a stable or better ROAS for mid‑ and high‑margin products.”
- “Switching a subset of campaigns from fixed target ROAS to Maximize conversion value, guided by better product‑level dashboards, will recover lost volume without sacrificing profitability.”
### 5.2. Pick the Right Pilot Surface Area
Common pilot designs for Google Shopping and Performance Max:
1. **Product‑Group Split**
- Keep your existing setup as control for half of your catalog (e.g., categories or brands).
- Apply the new tool’s segmentation, labels, and bidding recommendations to the other half.
2. **Campaign Split or A/B Experiment**
- Use Google’s built‑in experiments to clone a Shopping or Performance Max campaign and test alternative bidding strategies or label logic while holding settings as constant as possible. (Source: [Google Shopping Solutions – Tools for Performance Max](https://www.shoppingsolutions.withgoogle.com/expertise/tools-for-performance-max-campaigns))
3. **“Analytics‑First” Pilot**
- Introduce the tool and its dashboards but keep bidding unchanged for an initial period.
- Measure whether better visibility leads to **different decisions** from your team (e.g., more profitable exclusions, budget shifts) even before full automation.
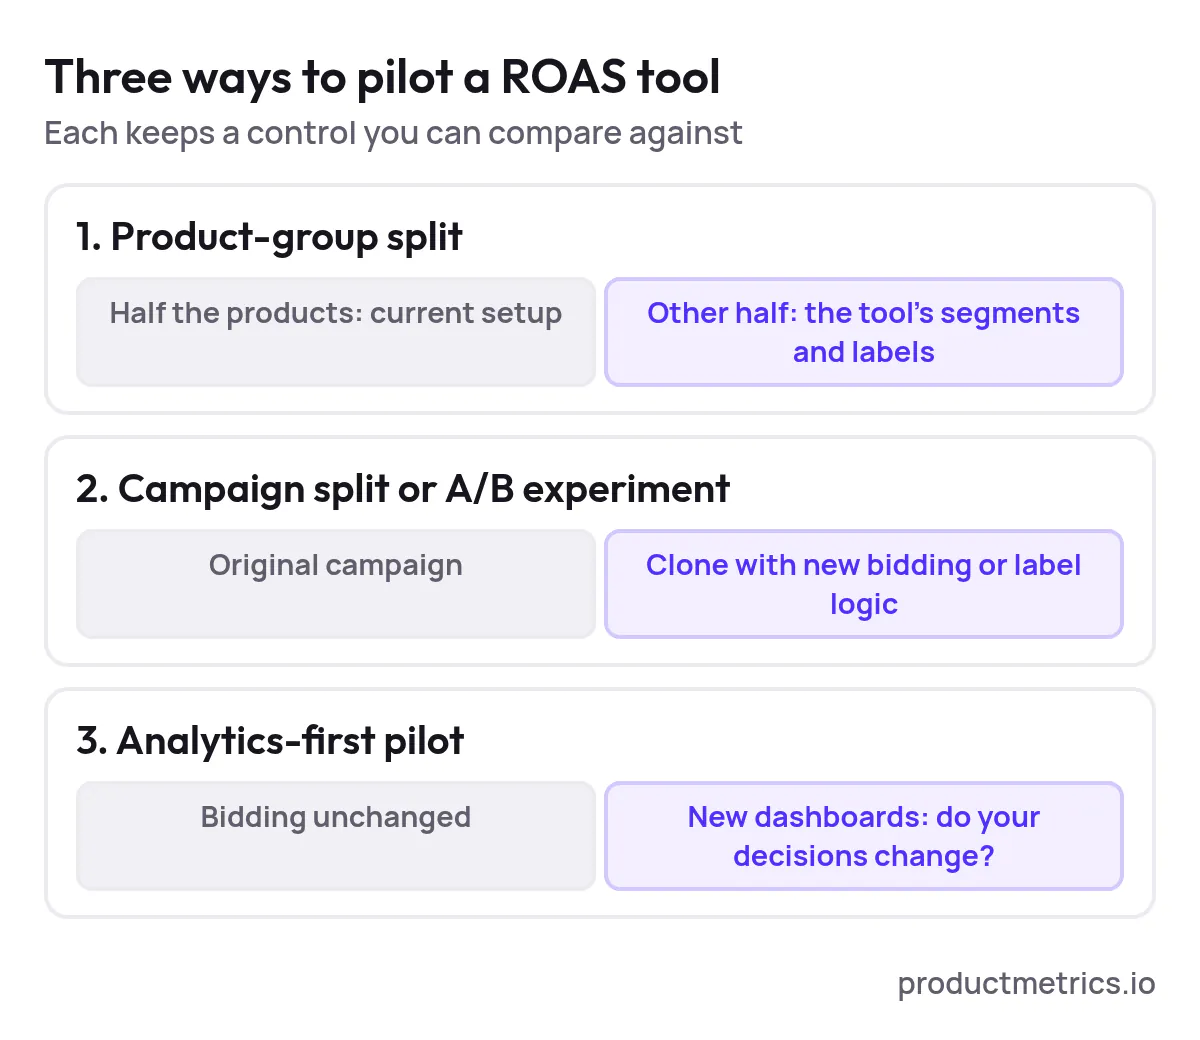
_Every pilot design keeps a control, so the result shows lift rather than a nicer report._
### 5.3. Instrument Your Pilot With the Right Dashboards
Regardless of design, your pilot reporting should include:
- **Per‑product and per‑segment ROAS/POAS.**
- **Spend distribution by segment** (e.g., how much budget is flowing to “Stars” vs. “Drainers”).
- **Incremental revenue and profit vs. baseline** for the test group.
- **Diagnostic views**: disapprovals, impression share, price position, and stock levels alongside performance. (Source: [Product Metrics – Google Shopping Monitoring](https://www.productmetrics.io/google-shopping-monitoring))
Custom GA4 + Data Studio/Looker dashboards can easily be duplicated and filtered for test vs. control campaigns, so your team is literally looking at the same layout for both arms of the pilot. (Source: [Performetic – Ecommerce Report in Looker Studio](https://www.performetic.com/en/blog/looker-studio-ecommerce-report))
### 5.4. Decide on Success Thresholds Before Launch
For example:
- +10–15% **conversion value** at the same or better ROAS.
- Stable or improved **profit per order** on key segments.
- Measurable reduction in **wasted spend** on low‑return products.
Agreeing on these thresholds upfront prevents “dashboard tourism” at the end of the pilot and accelerates a clear yes/no decision.
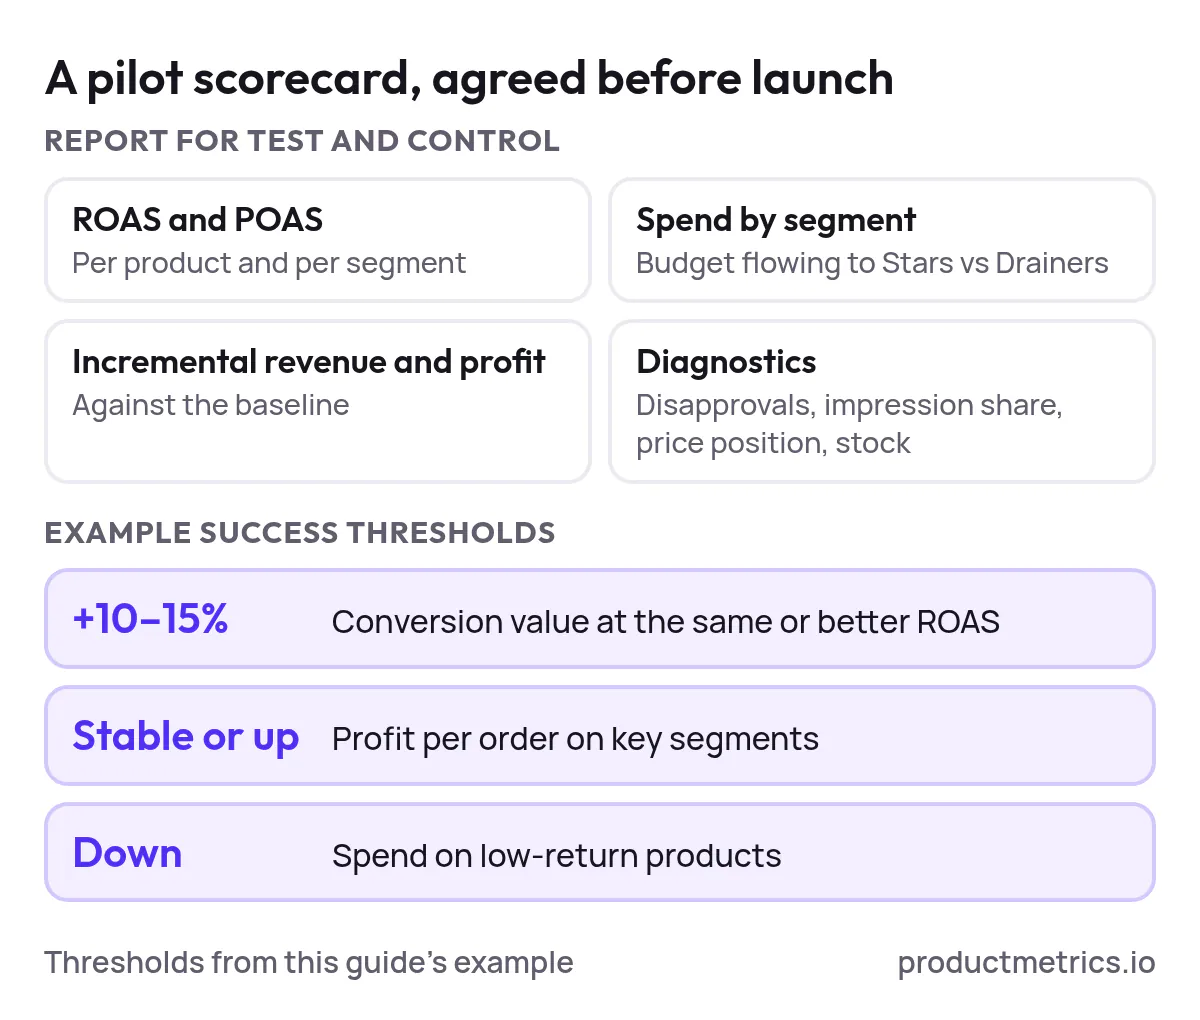
_Agree the report and the thresholds before launch, so the pilot ends in a clear yes or no._
## 6. Typical ROAS Optimization Stacks by Maturity Level
To make the tooling spectrum more concrete, here’s how US ecommerce teams often structure their Google Shopping ROAS stack in 2026.
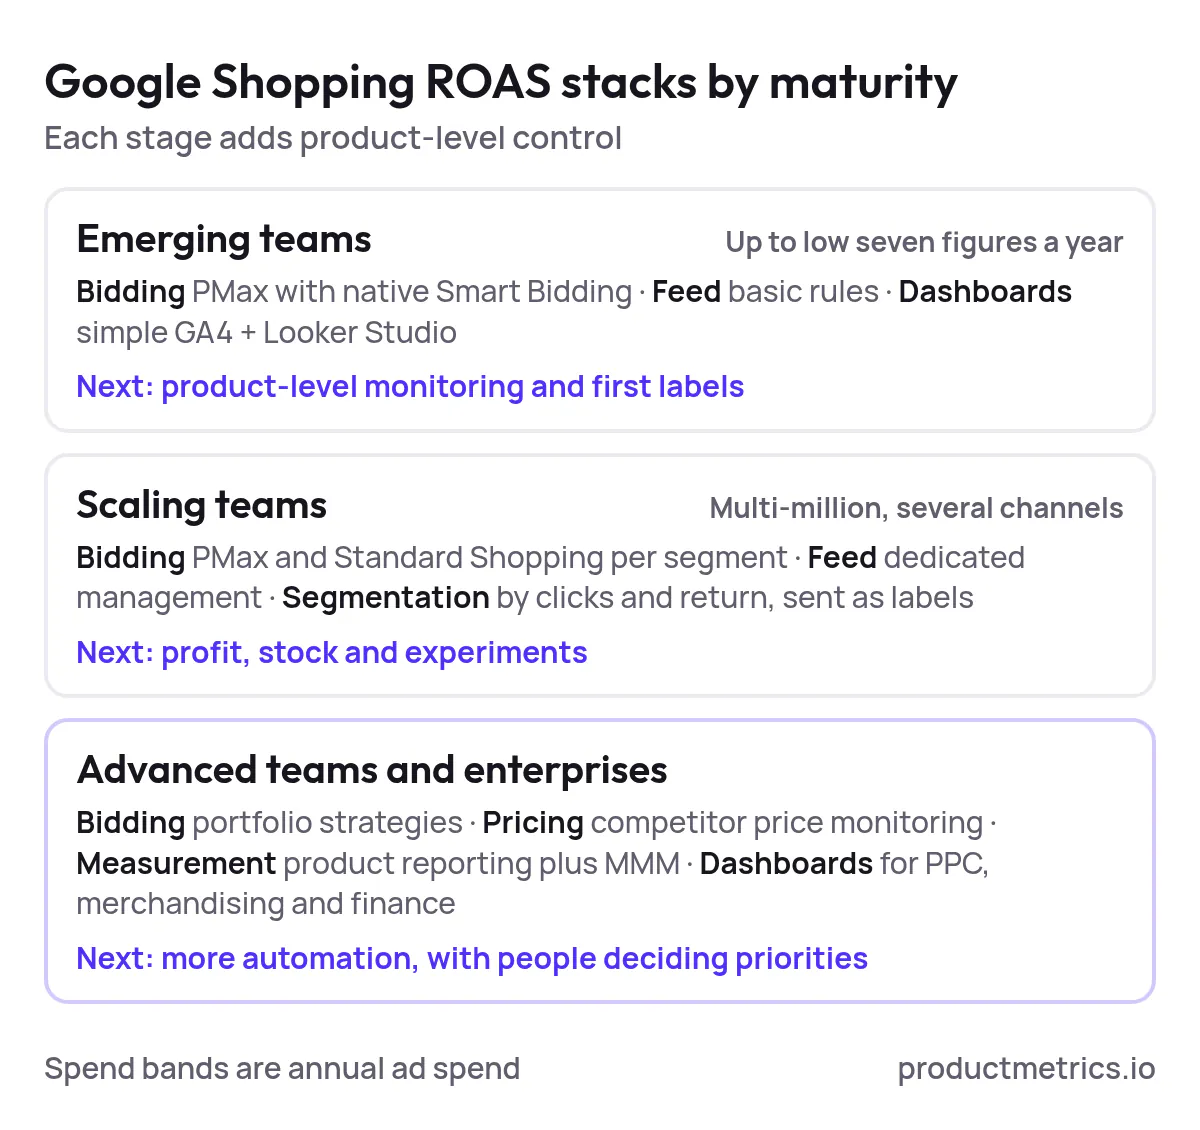
_Each maturity stage adds product-level control, from first labels to profit, stock and experiments._
### 6.1. Emerging Teams (Up to Low Seven‑Figure Annual Ad Spend)
- **Bidding:** Performance Max with Target ROAS or Maximize conversion value, using Google’s native Smart Bidding. (Source: [Google Ads Help – Bidding](https://support.google.com/google-ads/faq/10286469?hl=en))
- **Feed:** Basic Merchant Center feed rules; occasional manual fixes.
- **Dashboards:** GA4 + a simple Data Studio/Looker dashboard showing revenue, ROAS and top products. (Source: [BeeCommercer – Data Studio Ecommerce Dashboard Guide](https://beecommercer.com/data-studio-ecommerce-dashboard-guide/))
Key upgrade path: add product‑level monitoring and [start labeling at least the worst offenders and best performers](https://www.productmetrics.io/blog/product-segmentation-google-shopping-pmax).
### 6.2. Scaling Teams (Multi‑Million Annual Ad Spend, Multiple Channels)
- **Bidding:** Mix of Performance Max and Standard Shopping, often with different bidding strategies per product segment.
- **Feed:** Dedicated feed management, automated checks on [disapprovals](https://www.productmetrics.io/blog/google-merchant-center-errors) and coverage.
- **Dashboards:** Multi‑source dashboards that combine GA4, Google Ads, and sometimes competitor pricing and inventory data. (Source: [Stackmatix – Looker Studio for Marketing](https://www.stackmatix.com/blog/looker-studio-for-marketing))
- **Segmentation:** Systematic [product segmentation](https://www.productmetrics.io/glossary/product-segmentation) by clicks and return (e.g., high‑volume/high‑return vs. high‑volume/low‑return), often exported as Merchant Center labels for bidding. (Source: [Product Metrics – Product Segmentation](https://www.productmetrics.io/))
Key upgrade path: bring **profit and stock** into the loop and adopt experimentation frameworks at the campaign or product‑group level.
### 6.3. Advanced Teams and Enterprises
- **Bidding:** Sophisticated portfolio strategies, sometimes layered on top of Google’s Smart Bidding via scripts or external optimizers.
- **Feed & Pricing:** Continuous [price and assortment monitoring](https://www.productmetrics.io/blog/price-monitoring-software-compared) vs. competitors for key SKUs. (Source: [Product Metrics – Competitor Prices](https://www.productmetrics.io/))
- **Measurement:** Combination of GA4, product‑level Google Ads reporting, and potentially MMM or other incrementality models. (Source: [Think with Google – Marketing Mix Modeling Guidebook](https://www.thinkwithgoogle.com/_qs/documents/18374/Marketing_Mix_Modeling_Guidebook.pdf))
- **Dashboards:** Multiple customizable dashboards for PPC, merchandising, and finance, with consistent product identifiers so everyone can align on which SKUs to scale or lower the priority of.
Key upgrade path: automate more of the decisioning while keeping **human‑in‑the‑loop control** over which products to prioritize.
## 7. Common Pitfalls When Adopting ROAS Optimization Tools and Dashboards
Even strong tools fail when these issues creep in.
### 7.1. Optimizing for ROAS Instead of Profit
[A ROAS of 5 can still be unprofitable](https://www.productmetrics.io/break-even-roas-calculator) if it comes from low‑margin products or expensive fulfillment. Practitioners increasingly flag that ROAS alone isn’t a reliable success metric for ecommerce, advocating for POAS or contribution margin instead. (Source: [Reddit – Case learning: when “great” ROAS campaigns were loss‑making](https://www.reddit.com/r/adwords/comments/1muo02v))
Any “top tool for improving ROAS on Google Shopping with flexible reporting dashboards” should be evaluated on whether it can:
- Ingest **cost of goods and logistics costs**.
- Surface **profit‑aligned KPIs** next to ROAS.
- Help you answer, “Should we sell _more_ of this product at this price?” not just “Can we get more revenue?”
**Figure: POAS at the same ROAS of 5, by contribution margin.** POAS is ROAS × contribution margin, so the same ROAS of 5 ends at 0.5 on a 10% margin and at 2 on a 40% margin; below a POAS of 1 the product loses money.
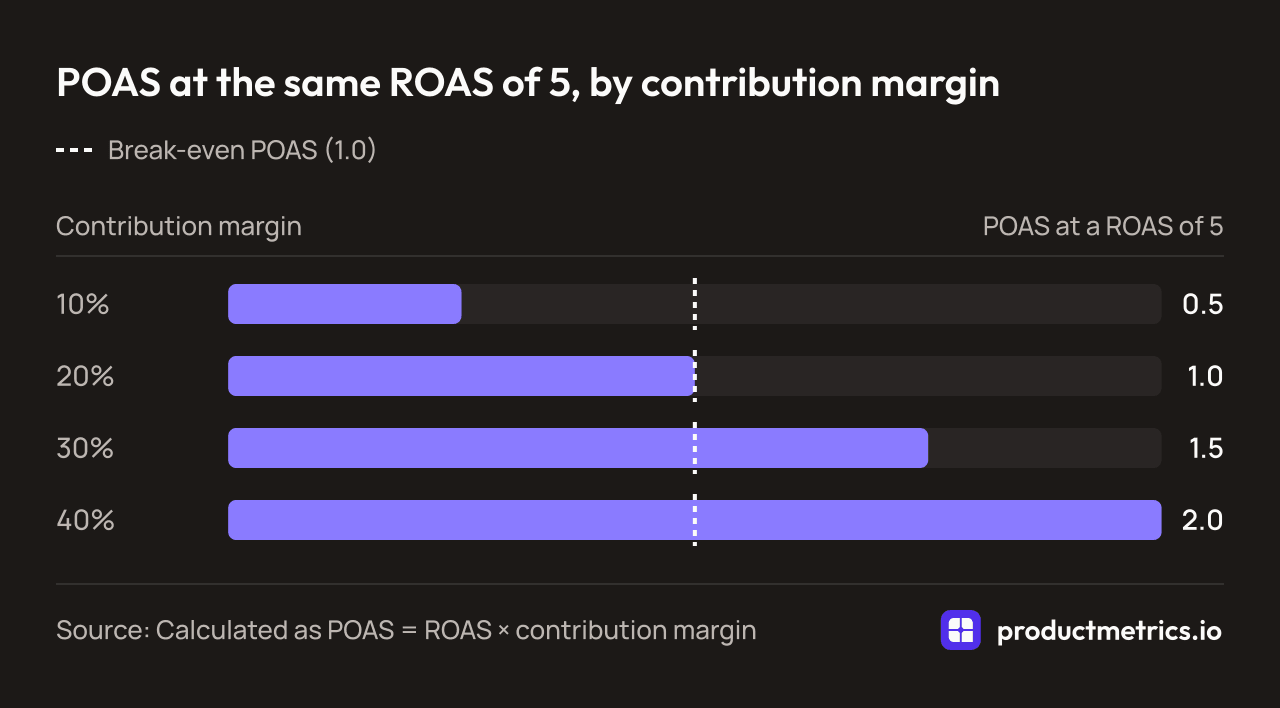
| Contribution margin | POAS at a ROAS of 5 |
| --- | --- |
| 10% | 0.5 |
| 20% | 1.0 |
| 30% | 1.5 |
| 40% | 2.0 |
Reference line: Break-even POAS (1.0).
_Source: Calculated as POAS = ROAS × contribution margin_
### 7.2. Ignoring Smart Bidding’s Data Needs
Target ROAS and other goal‑based bidding strategies rely on sufficient, high‑quality conversion data; Google recommends allowing multiple conversion cycles and enough volume before locking in targets. (Source: [Google Ads Help – About Target ROAS](https://support.google.com/google-ads/answer/6268637?hl=en-AU-u-fw-mon-mu-celsius))
If your dashboards make it _look_ like ROAS is stable but your conversion tracking is incomplete (due to [ad blockers](https://www.productmetrics.io/ad-blocker-conversion-tracking), tagging gaps, or consent issues), Smart Bidding will be optimizing on **distorted signals**.
> **Get every conversion back into Google Ads and Meta.** Full Signal Tracking gets through every adblocker, so bidding works on your full revenue. Sends revenue, profit and new customers to Google Ads and Meta. [Book a demo](https://www.productmetrics.io/demo)
### 7.3. Over‑Fitting Dashboards to One Stakeholder
Dashboards built only for executives often hide the **granular levers** PPC teams need (queries, products, segments). Dashboards built only for PPC often confuse finance or merchandising with unfamiliar metrics.
The most effective customizable reporting setups provide:
- A **shared top‑line view** (revenue, ROAS/POAS, key segments).
- Role‑specific drill‑downs for PPC, merchandising, and finance.
### 7.4. Mixing Incompatible Attribution Views
Teams frequently try to blend ad platform spend with GA4 revenue directly in a single Looker Studio chart, which community practitioners warn can create “fantasy ROAS” because the attribution models differ. (Source: [Reddit – Best GA4 + Looker Studio dashboards for ecommerce](https://www.reddit.com/r/ecommerce/comments/1n1jxk6/best_ga4_looker_studio_dashboards_for_ecommerce/))
A better pattern is to:
- Keep **platform‑attributed ROAS** and **GA4‑attributed ecommerce revenue** in separate sections.
- Use [product‑level reporting and segmentation](https://www.productmetrics.io/blog/google-shopping-roas-reporting) to reconcile patterns rather than forcing them into one blended metric.
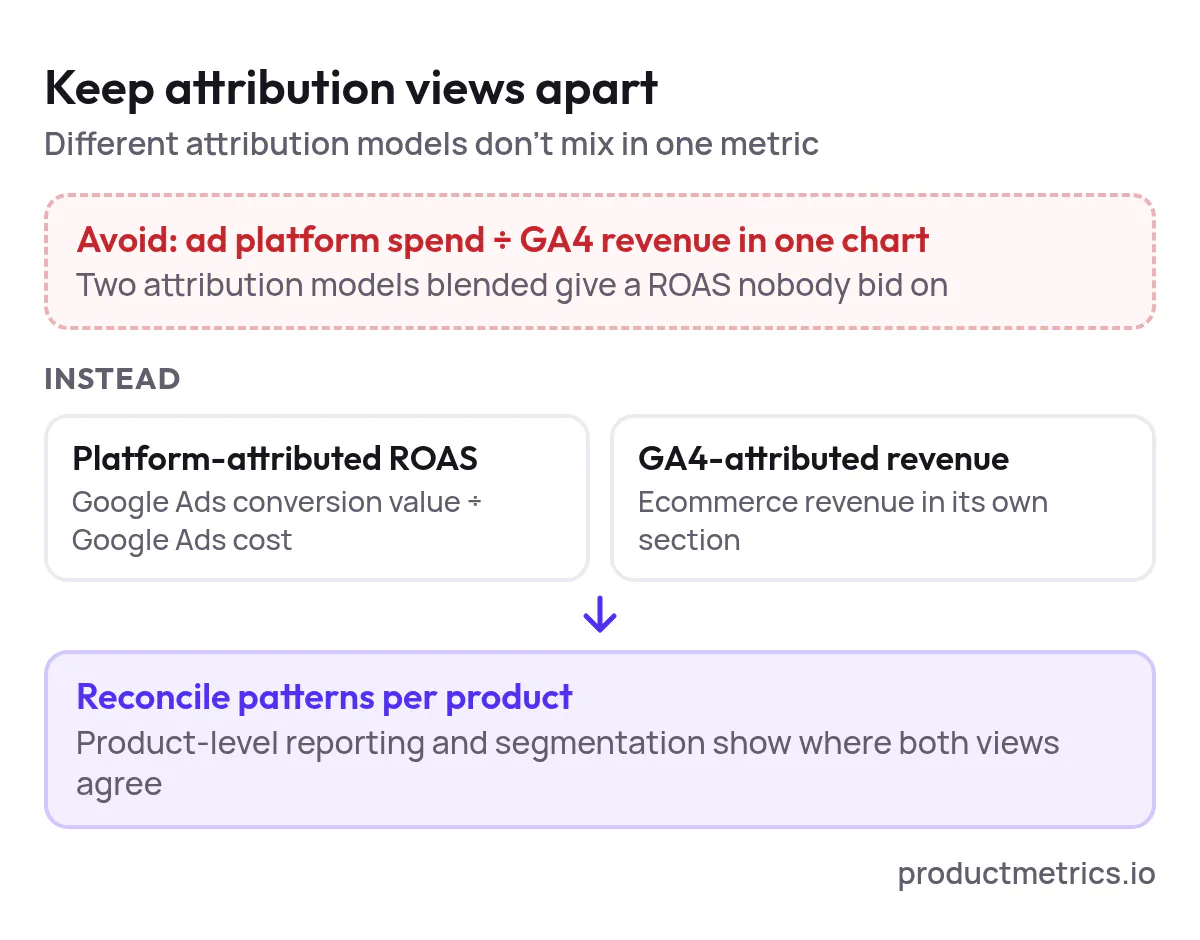
_Keep platform-attributed ROAS and GA4 revenue apart, and use product-level reporting to see where they agree._
## 8. Where Product‑Level Google Shopping Tools Fit In and How Product Metrics Is Positioned
A distinct class of tools has emerged around **product‑level Google Shopping optimization**:
- They segment products by ad clicks and return (often into a handful of intuitive buckets) using machine learning. (Source: [Product Metrics – Product Segmentation](https://www.productmetrics.io/))
- They combine [product journeys](https://www.productmetrics.io/product-journeys), competitor prices, stock, and margins into one workflow so you can see why a SKU is over‑ or under‑performing. (Source: [Product Metrics – Compare Alternatives](https://www.productmetrics.io/))
- They push segments back into Merchant Center as labels that Smart Bidding and campaign structures can use. (Source: [Product Metrics – Product Segmentation](https://www.productmetrics.io/))
- Some include **[server‑side, ad‑blocker‑resistant conversion tracking](https://www.productmetrics.io/server-side-tracking)** to improve the quality of signals reaching Google Ads. (Source: [Product Metrics – Full Signal Tracking](https://www.productmetrics.io/))
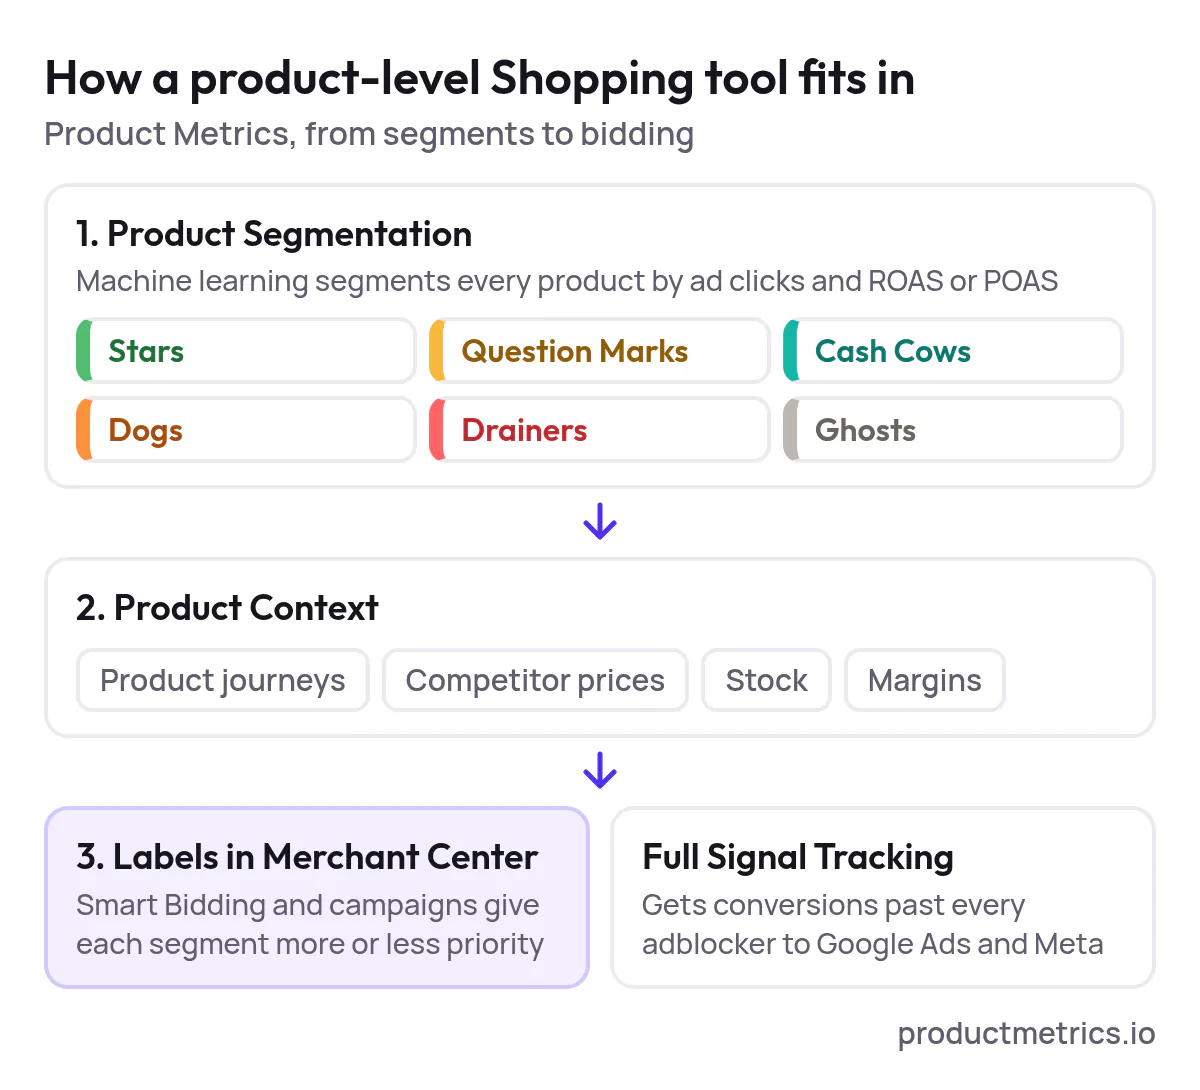
_Product Metrics segments every product, adds journeys, competitor prices, stock and margins, and sends the segment to Merchant Center as a label, so each one gets more or less priority._
Product Metrics (productmetrics.io) is one example of this category: a SaaS platform focused on product‑level Google Shopping optimization that offers advertising analytics, campaign insights, optimization tools, and performance dashboards tailored to Shopping and Performance Max. (Source: [Product Metrics – Terms & Conditions](https://www.productmetrics.io/terms))
From a performance team’s evaluation perspective, you’d assess a product‑level tool like this using the same frameworks as above, with a few extra questions:
- Does its segmentation map cleanly into your **existing campaign and feed structure**?
- Can its dashboards become the **source of truth** for product‑level ROAS/POAS across teams?
- How well does its tracking and product reporting align with Google’s own product reporting and GA4 data?
## 9. Next Steps - How to Move From Theory to a Better ROAS Stack
If you’re actively searching for **ecommerce ROAS optimization tools for Google Shopping with custom reporting dashboards**, a practical path forward is:
1. **Document your current stack**
Map bidding, feed, experimentation, and analytics layers; note pain points.
2. **Define 1–2 concrete use cases**
Examples: “Recover lost volume after a Smart Bidding change while keeping profit flat,” or “Shift budget from drainers to cash cows using product‑level segmentation.”
3. **Shortlist tools by category**
Include both generalist analytics/dashboard tools (GA4 + Data Studio/Looker Studio, connectors, BI) and [specialist product‑level Shopping tools](https://www.productmetrics.io/blog/roas-optimization-tools).
4. **Use the evaluation criteria in Section 4** to grill vendors and assess internal effort.
5. **Design one high‑quality pilot**, instrumented with dashboards that reflect how your team really works.
6. **Institutionalize the learnings**
If a tool wins its pilot, bake its dashboards and workflows into your weekly and monthly operating rhythm, instead of treating it as “yet another report.”
For brands that want to go deeper on product‑level Google Shopping optimization—segmentation, competitor pricing, tracking, and Merchant Center labels—exploring a specialized platform like Product Metrics alongside your [existing GA4 + Data Studio/Looker setup](https://www.productmetrics.io/blog/google-shopping-roas-dashboard-platforms) can be a high‑leverage next experiment. (Source: [Product Metrics – Product‑Level Google Shopping Optimisation](https://www.productmetrics.io/))
The teams that will win Google Shopping in 2026 aren’t just trusting AI or building prettier dashboards—they’re doing the hard operational work of connecting **bidding, feeds, experiments, and truly customizable product‑level reporting** into a single optimization loop.
## Keep reading.
- [How to Build a Google Shopping ROAS Dashboard That Actually Moves Revenue: Templates, Metrics and Workflows](https://www.productmetrics.io/blog/google-shopping-roas-dashboard)
- [Best Tools For Google Shopping ROAS Optimization With Customizable Dashboards](https://www.productmetrics.io/blog/google-shopping-roas-dashboard-tools)
- [Customizable Reporting For Google Shopping ROAS - Real-Time, Drag-And-Drop, And Personalized Dashboards In ProductMetrics](https://www.productmetrics.io/blog/google-shopping-roas-reporting)
---
Written by Berend Vrakking, founder of Product Metrics. Last updated 2026-11-01.
1M+ products analysed · Nominated at the Dutch Search Awards for Best Measurement Campaign (2023) and Best Use of Data (2024)
HTML version: https://www.productmetrics.io/blog/ecommerce-roas-optimization-tools