---
title: "The Practical Buyer’s Guide To Google Shopping ROAS Platforms With Customizable Dashboards"
description: "The Practical Buyer’s Guide To Google Shopping ROAS Platforms With Customizable Dashboards: demo scripts, a scoring matrix and a security checklist."
canonical: "https://www.productmetrics.io/blog/google-shopping-roas-dashboard-platforms"
pageType: article
language: en
publisher: "Product Metrics"
author: "Berend Vrakking"
datePublished: 2026-11-01
dateModified: 2026-11-09
image: "https://www.productmetrics.io/og/blog/google-shopping-roas-dashboard-platforms.png"
---
> Content index: https://www.productmetrics.io/llms.txt
# The Practical Buyer’s Guide To Google Shopping ROAS Platforms With Customizable Dashboards
## Key takeaways
- ROAS alone hides whether a Shopping campaign is actually profitable.
- Generic BI tools can connect to Google Ads, but they rarely ship opinionated Shopping templates or a PPC‑first editing experience.
- Time from 'connect' to 'first useful dashboard' is a critical evaluation metric.
If you are actively searching for phrases like 'purchase google shopping [ROAS](https://www.productmetrics.io/glossary/roas "Return on ad spend (ROAS) is the revenue your ads generate for every euro you spend on them.") optimization platform with custom dashboard features' or 'buy google shopping optimization software with advanced customizable dashboards', you are not in research mode anymore—you are ready to choose and deploy a platform.
This guide is built to help you do exactly that.
You will get:
- A clear definition of what a Google Shopping ROAS optimization platform with customizable dashboards should actually do.
- Demo scripts you can hand to any vendor (including ProductMetrics.io) to prove they can handle your real‑world reporting needs.
- An evaluation matrix to compare tools on Shopping‑specific capabilities, not generic BI buzzwords.
- A security and procurement checklist your IT and legal teams can use to move faster, not slower.
- A practical path to shortlist, pilot, and buy with confidence.
## 1. What You Are Really Buying When You Buy Google Shopping ROAS Software
Most teams first feel the pain in spreadsheets:
- Trading Google Ads exports back and forth.
- Pasting data into blended ROAS tabs, then breaking formulas.
- Spending late nights rebuilding the same 'what happened to ROAS on this product line?' decks before every leadership review.
A dedicated Google Shopping ROAS optimization platform replaces that duct tape with three core layers:
1. **A Shopping‑native data model** that pulls product‑level performance straight from Google Ads and Merchant Center and organizes it by item ID, product type, category, brand, [custom labels](https://www.productmetrics.io/glossary/custom-labels "Custom labels are five attributes in a product feed, custom_label_0 to custom_label_4, that you fill with your own text to group products in campaigns."), and campaign structure.
2. **A customizable analytics and dashboard layer** where [PPC](https://www.productmetrics.io/glossary/ppc "PPC (pay-per-click) is an online advertising pricing model in which the advertiser pays each time someone clicks an ad, not each time the ad is shown.") teams can design their own ROAS views, not wait for engineering or BI resources.
3. **Collaboration and workflow features** (alerts, annotations, sharing, permissions) so the organization can actually act on what the dashboards reveal.
When you look for '[google shopping optimization platforms with customizable analytics dashboards](https://www.productmetrics.io/blog/google-shopping-roas-dashboard-tools) for sale', you are trying to buy all three layers in one decision, not just a pretty UI.
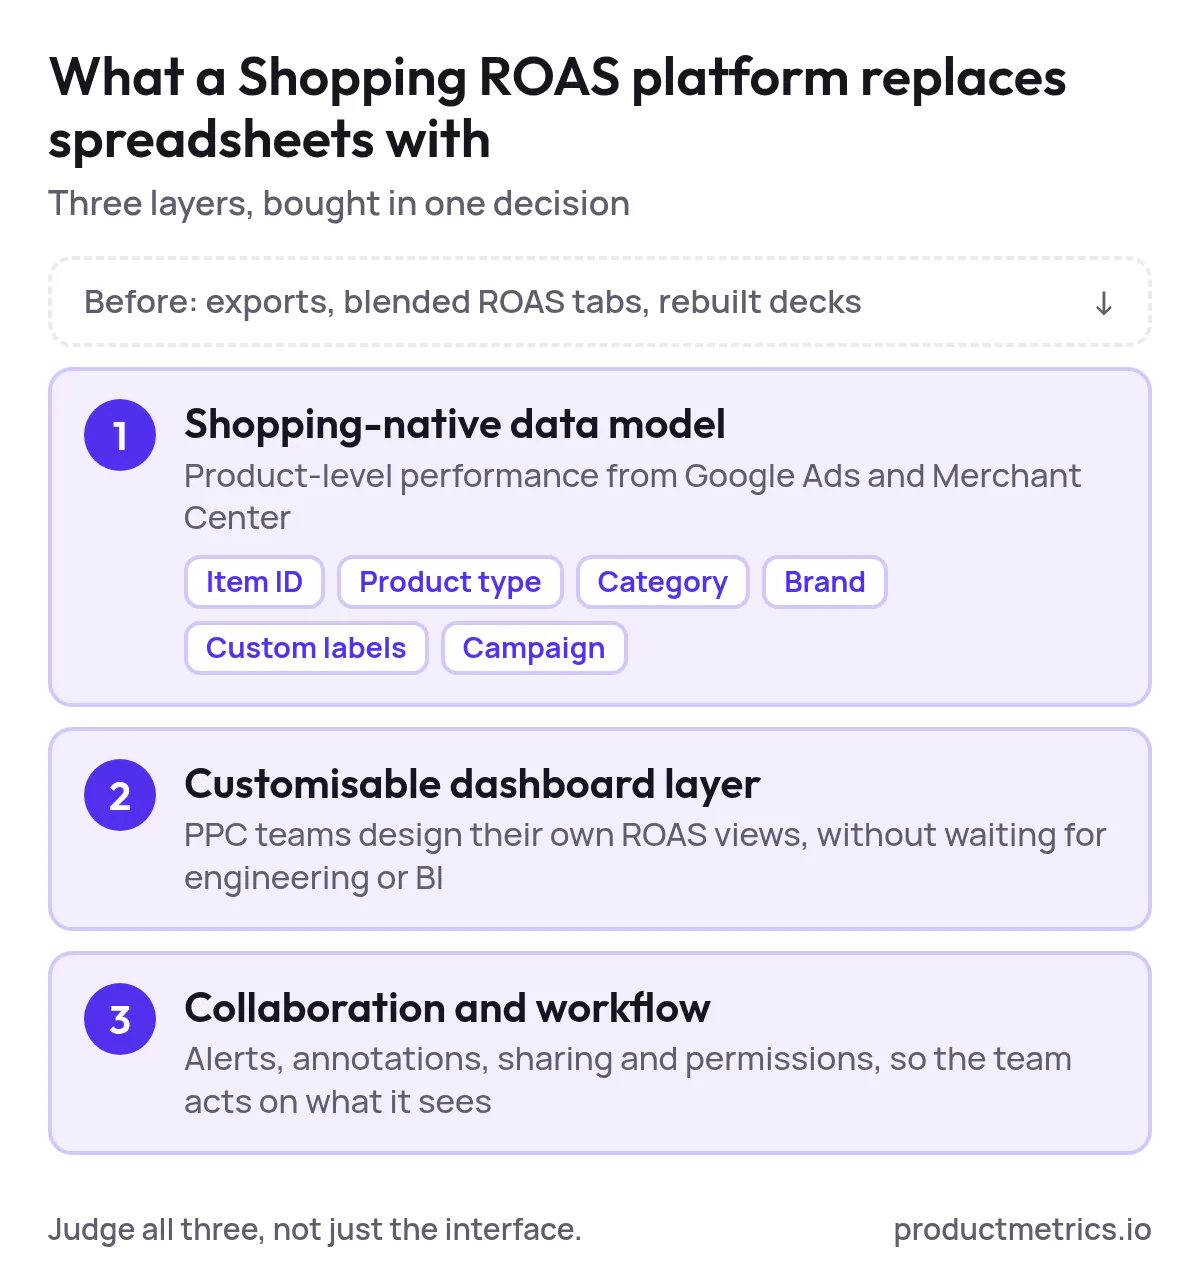
_A Shopping ROAS platform swaps exports and spreadsheet tabs for three layers: a Shopping-native data model, customisable dashboards and team workflow._
## 2. Why Customizable Dashboards Are The Real Differentiator
Many platforms say they support Google Shopping. Few make Shopping the primary use case.
If you manage Shopping or [Performance Max](https://www.productmetrics.io/performance-max) at scale, dashboards are not 'nice to have': they are your daily cockpit. The wrong dashboard experience means:
- You cannot isolate ROAS by [product group](https://www.productmetrics.io/blog/segment-google-shopping-by-product-group), margin tier, or custom label.
- It is painful to compare Shopping vs. other channels in one view.
- Every new stakeholder question turns into another one‑off spreadsheet.
Customizable dashboards change that by letting you:
- Drag and drop widgets to build tailored views for Shopping, PMax, branded vs. non‑brand, or margin tiers.
- Slice metrics by product attributes (brand, category, product type, custom labels) without requesting custom development.
- Quickly add key Shopping metrics—impressions, clicks, CTR, CPC, conversion rate, [conversion value](https://www.productmetrics.io/glossary/conversion-value "Conversion value is the amount you tell Google Ads a conversion is worth, such as sales revenue or profit margin."), and ROAS—to any view and compare time periods in a few clicks.
- Save and share dashboard presets for different audiences: practitioners, marketing leadership, finance, or merchandising.
ProductMetrics.io is designed for PPC teams that want this kind of control up front, so dashboards become part of the optimization loop—not an after‑the‑fact reporting chore.
## 3. Translate Your Search Intent Into Buying Criteria
When buyers search for long‑tail queries such as:
- 'purchase google shopping ROAS optimization platform with custom dashboard features'
- 'where to buy google shopping ROAS tools with drag-and-drop reporting dashboards'
- 'order ROAS optimization software for google shopping with personalized dashboard options'
…they are usually looking for four specific outcomes:
1. **Clarity** – A single place to see product‑level ROAS, revenue, and profit across all Shopping and PMax campaigns.
2. **Speed** – The ability to answer ad‑hoc questions from leadership in minutes, without exporting data.
3. **Control** – Flexible dashboards they can adapt to how their business actually [segments products](https://www.productmetrics.io/product-segmentation) (brand, category, margin, lifecycle stage).
4. **Proof** – Clear visibility from spend to revenue and profit, so budget increases are justified.
Use these outcomes as your short list of non‑negotiable capabilities before you invite any vendor demo.
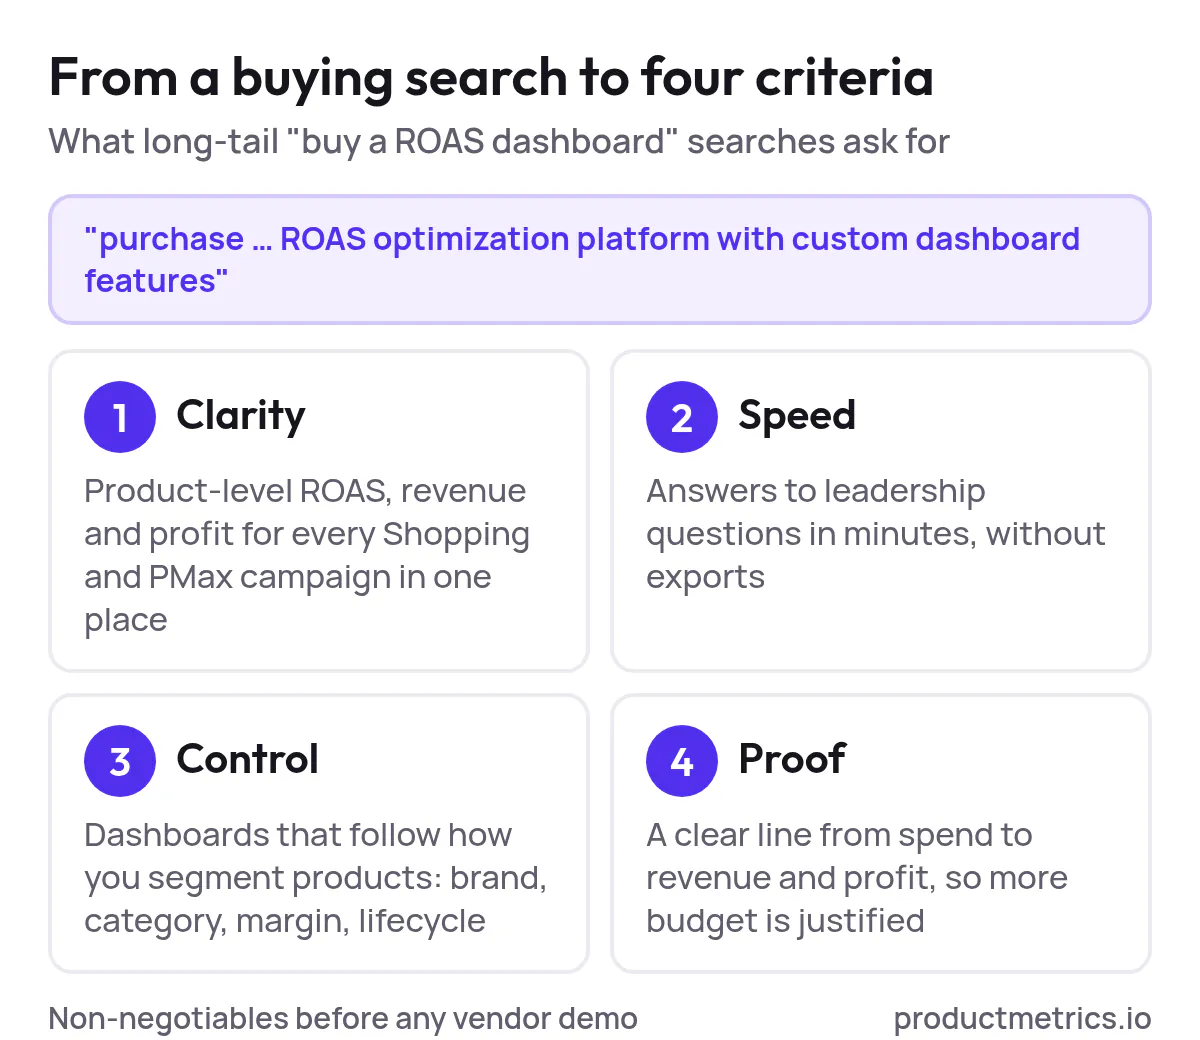
_Buying searches for ROAS dashboards come down to four outcomes: clarity, speed, control and proof._
## 4. Must‑Have Capabilities In A Google Shopping ROAS Platform With Custom Dashboards
### 4.1 Shopping‑Native Metrics And Dimensions
Your platform should treat Google Shopping as a first‑class citizen, with at least:
- Core metrics: impressions, clicks, CTR, CPC, conversion rate, conversions, conversion value, and ROAS.
- Product‑level performance: item ID, title, brand, product type, category, and condition.
- Campaign structure: campaign, ad group, product group, custom labels, and device.
If a vendor cannot show you [ROAS broken down by these attributes](https://www.productmetrics.io/blog/google-shopping-roas-reporting) in the first five minutes of a demo, they are not truly Shopping‑native.
### 4.2 Profit And Margin‑Aware Reporting
ROAS alone hides whether a Shopping campaign is actually profitable. Serious platforms allow you to:
- Pull in [cost of goods sold](https://www.productmetrics.io/glossary/cost-of-goods-sold) (COGS) or margin data via your feed or external sources.
- Build custom metrics like [product profit rate](https://www.productmetrics.io/glossary/profit-per-product), cost per profitable conversion, and category efficiency rate inside dashboards—not in a separate spreadsheet.
- Segment dashboards by margin tier, so you can dial back spend on low‑margin SKUs and double down on profitable ones.
ProductMetrics.io’s focus on customizable reporting is especially useful here: you can design views that show both ROAS and profit‑aware KPIs side by side, so you are not forced to choose one or the other during optimization.
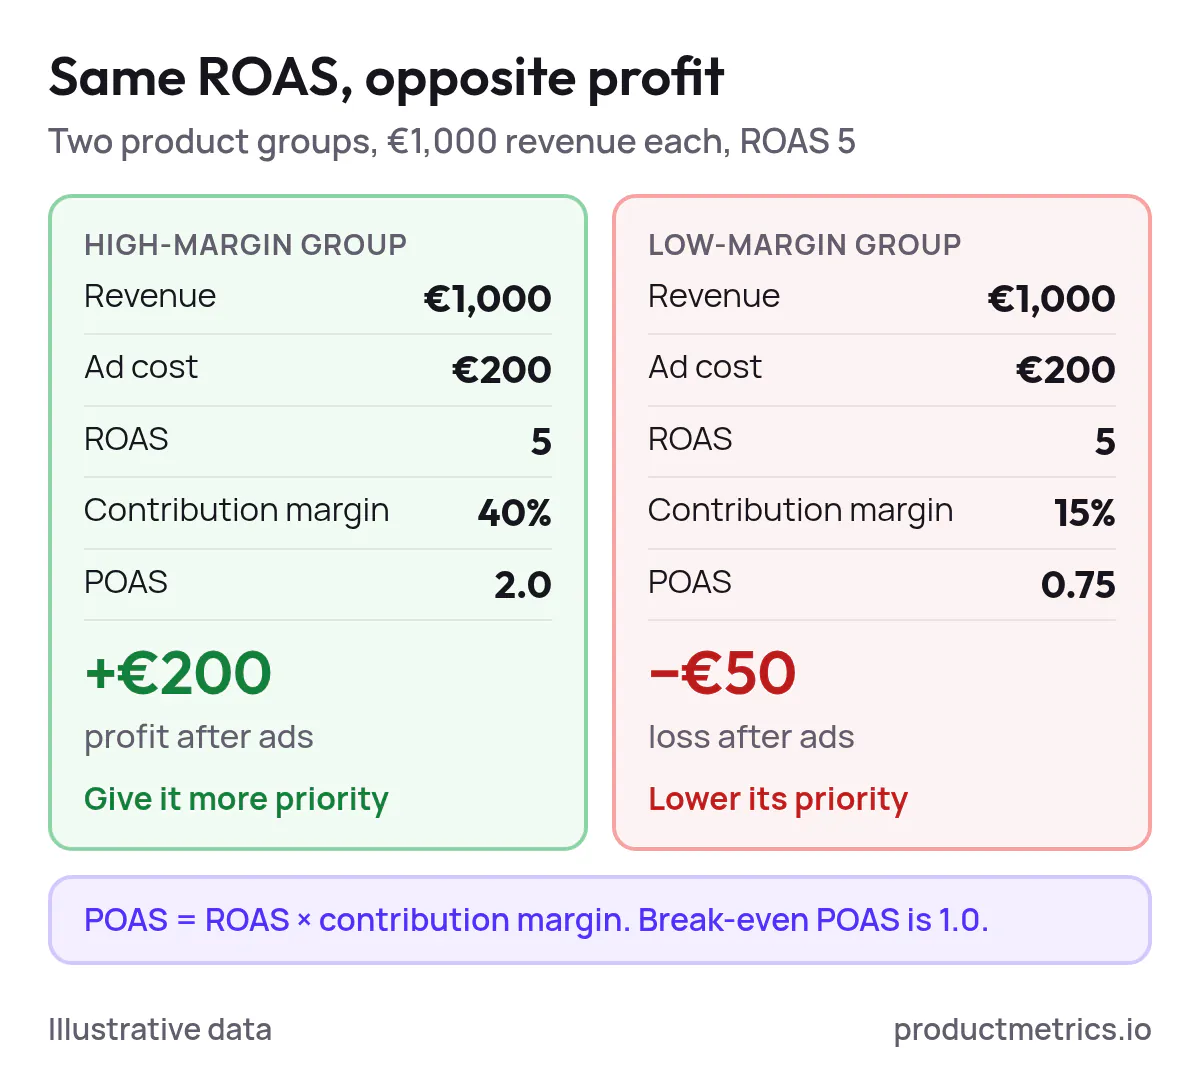
_At the same ROAS of 5, a 40% margin group earns €200 after ads and a 15% margin group loses €50: a ROAS-only view cannot tell them apart. Illustrative data._
> **Sidenote:** POAS (profit on ad spend) is ROAS multiplied by contribution margin, and break-even POAS is 1.0. The [POAS vs ROAS guide](https://www.productmetrics.io/blog/poas-vs-roas) works through both metrics.
### 4.3 Feed, Merchant Center, And Tracking Awareness
Even the best dashboard is useless if the underlying Shopping system is broken. Your ROAS platform should at minimum help you see whether:
- [Product feeds are healthy](https://www.productmetrics.io/google-shopping-feed/optimization) (no major disapprovals or missing attributes).
- Merchant Center is clear of [critical warnings](https://www.productmetrics.io/blog/google-merchant-center-errors) affecting visibility.
- [Conversion tracking](https://www.productmetrics.io/server-side-tracking) is configured correctly and reporting accurate revenue values.
- Campaign structure aligns with business logic (best sellers, high‑margin products, seasonal lines, etc.).
You do not need your ROAS platform to replace specialized feed tools, but it should surface the impact of feed and tracking issues directly in dashboards.
### 4.4 Drag And Drop PPC‑Friendly Dashboard Builder
Look for a dashboard UX that:
- Lets PPC managers add, resize, and move tiles in a drag‑and‑drop interface (without writing SQL).
- Supports filters on any Shopping dimension (brand, category, custom label, product type, campaign, device, country).
- Offers Shopping‑specific templates you can customize instead of starting from a blank canvas.
- Allows per‑widget date ranges so you can compare this week’s Shopping performance to last month while keeping other charts at a monthly roll‑up.
This is where tools in the '[google shopping optimization software with customizable reporting for ROAS tracking](https://www.productmetrics.io/blog/shopping-pmax-reporting-software)' category diverge sharply. Generic BI tools can connect to Google Ads, but they rarely ship opinionated Shopping templates or a PPC‑first editing experience.
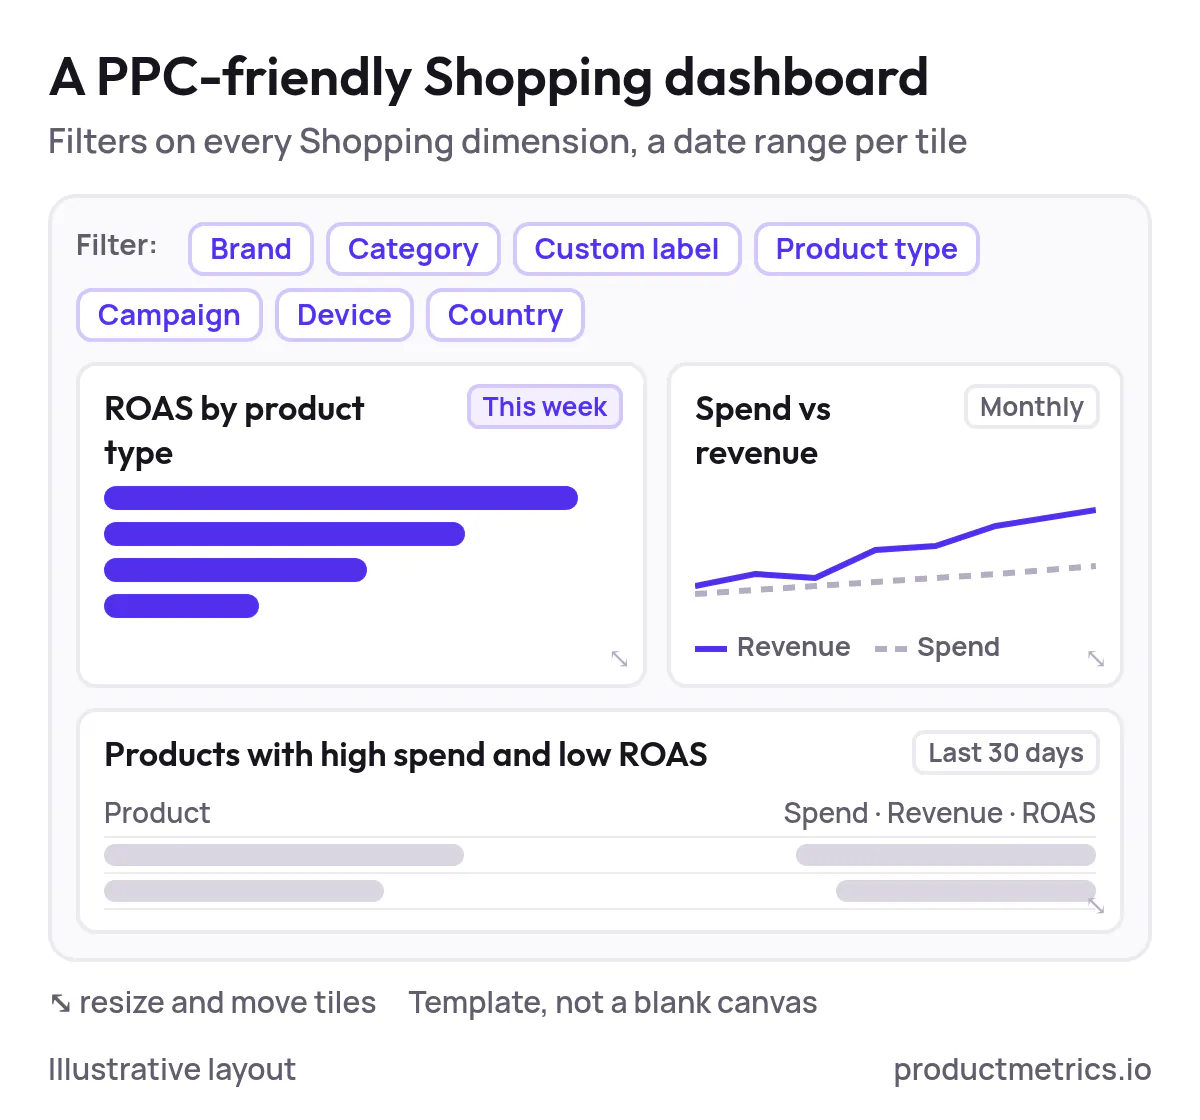
_A PPC-friendly builder filters every tile by Shopping dimension and lets each tile keep its own date range. Illustrative layout._
### 4.5 Collaboration, Sharing, And Automation
To fully replace manual reporting, your platform should make it easy to:
- Share dashboards with stakeholders via secure links or scheduled email exports.
- Annotate major changes (budget shifts, feed overhauls, new campaigns) right on the charts.
- [Set up alerts on key Shopping KPIs](https://www.productmetrics.io/google-shopping-monitoring) (ROAS drop, cost spikes, impression share collapse) so you are notified before leadership is.
- Maintain multiple workspaces or folders for agencies, brands, and regions.
ProductMetrics.io can then act as the shared source of truth for both in‑house teams and agencies, instead of forcing everyone into separate spreadsheets.
> **Get more revenue out of Google Shopping.** Every product segmented and labelled in Merchant Center, so your top performers get more priority. [Analyse your products for free](https://app.productmetrics.io/) Log in with Google, no credit card.
## 5. Demo Scenarios: How To Test Vendors In 45 Minutes
Do not let vendors run a generic slide deck. Give them focused demo scripts that match how you run Shopping today.
Below are four practical demo scenarios you can use with any vendor, including ProductMetrics.io.
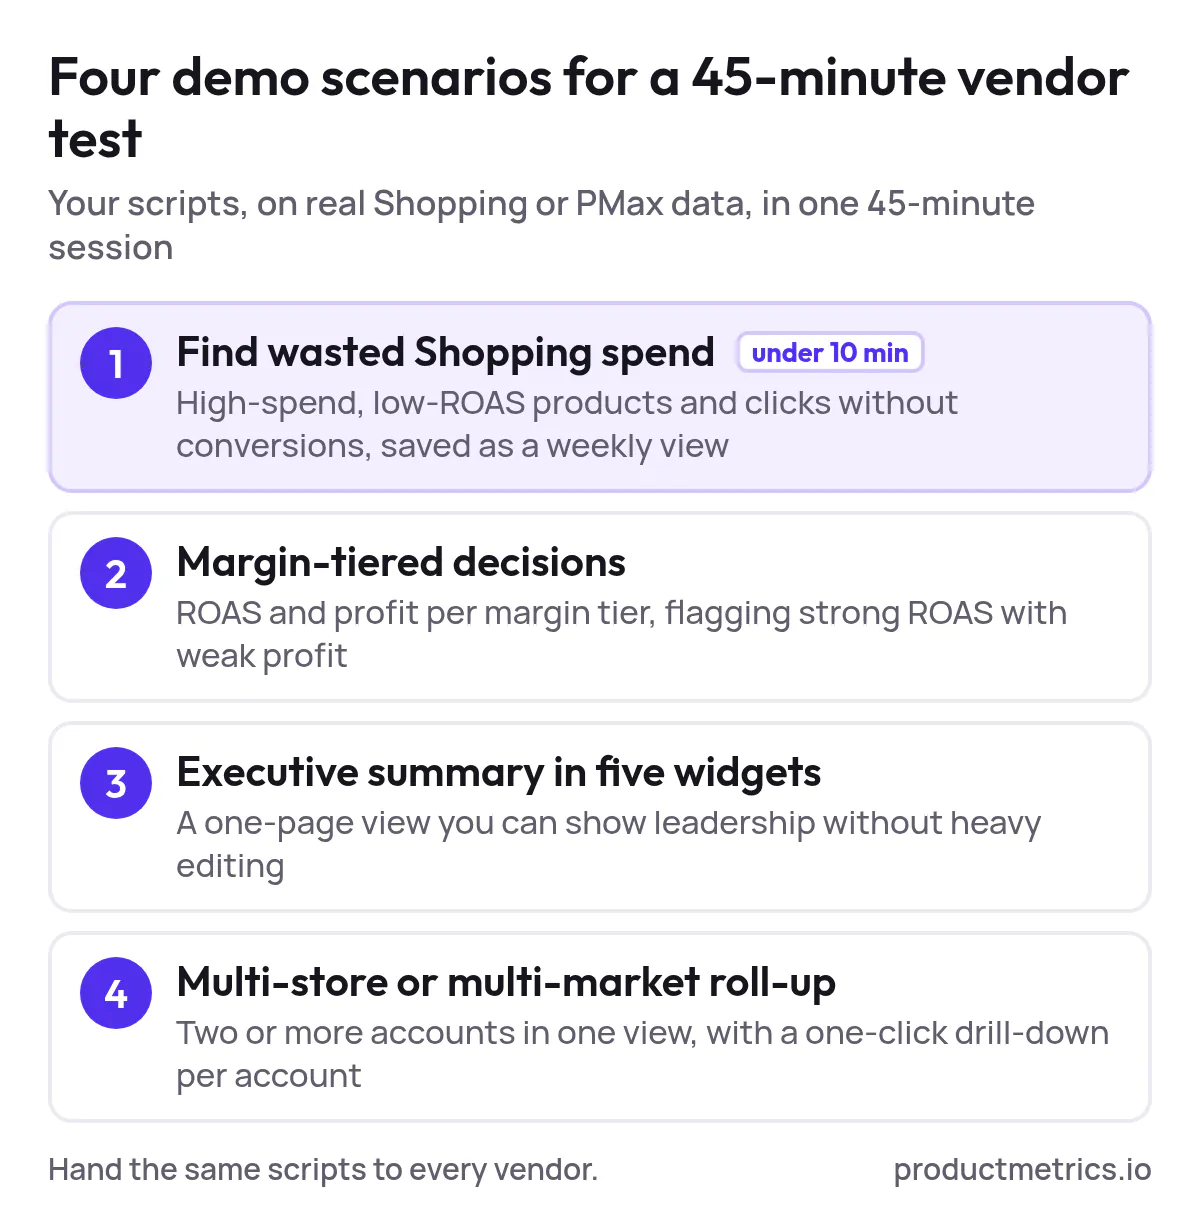
_Four scripted scenarios fit one 45-minute demo; the first, finding wasted Shopping spend, should take under 10 minutes._
### Scenario 1: Find Wasted Shopping Spend In Under 10 Minutes
Ask the vendor to:
1. Connect (or simulate) a real Google Ads account with Shopping or Performance Max data.
2. Build a dashboard that shows:
- Spend, revenue, ROAS, and profit (if margin data is available) by product type.
- A table of products with high spend and low ROAS over the last 30 days.
- A filter that shows only products with more than a chosen number of clicks but no conversions.
3. Save and name this view so the team can re‑use it weekly.
Watch for:
- How quickly they can assemble this dashboard using drag‑and‑drop.
- Whether they can add margin‑aware custom metrics directly in the UI.
- How easy it is to export or share this exact view with your stakeholders.
### Scenario 2: Margin‑Tiered Bidding Decisions
Ask the vendor to:
1. Pull in a margin or COGS column (via feed data or uploaded reference file).
2. Segment products into three tiers: high, medium, and low margin.
3. Create a dashboard that shows ROAS and profit per tier, plus top products in each.
4. Highlight products where [ROAS looks strong but profit is weak](https://www.productmetrics.io/poas-calculator).
This scenario tests whether the platform can support a profit‑first optimization mindset, not just headline ROAS.
### Scenario 3: Executive Shopping Summary In Five Widgets
Ask the vendor to build a one‑page executive dashboard that includes:
- Overall Shopping and PMax spend, revenue, and ROAS vs. previous period.
- Top 5 product categories by revenue.
- Top 5 products by revenue and their associated ROAS.
- Impression share trend for Shopping campaigns.
- A short narrative or annotations explaining what changed.
This tests whether you can confidently present the platform’s dashboards in leadership meetings without heavy editing.
### Scenario 4: Multi‑Store Or Multi‑Market Roll Up
If you manage multiple brands, countries, or Google Ads accounts, ask the vendor to:
1. Aggregate Shopping data from at least two accounts.
2. Create a roll‑up dashboard that shows:
- Total Shopping spend and ROAS across all accounts.
- A breakdown by market or store.
- A way to drill into an individual account with a single click.
This will quickly reveal whether their architecture supports your real scale or if you will hit limits the minute you grow.
> **Bring your demo scenarios to a live walkthrough.** See how every product is segmented and labelled in Merchant Center. Sends revenue, profit and new customers to Google Ads and Meta. [Book a demo](https://www.productmetrics.io/demo)
## 6. Evaluation Matrix: Comparing ROAS Tools With Custom Dashboards
Use this matrix to score any '[google shopping ROAS optimization tools with fully customizable reporting dashboards](https://www.productmetrics.io/blog/google-shopping-roas-optimization-tools)' you are considering.
| Criterion | Why it matters | What good looks like | ProductMetrics.io approach (example positioning) |
|---|---|---|---|
| Shopping data coverage | You need all key Shopping metrics and dimensions to analyze ROAS properly. | Native Google Ads connector with product‑level data (item ID, brand, category, custom labels, etc.) and standard Shopping KPIs available in every dashboard. | Position ProductMetrics.io as Shopping‑aware by default, with schemas and templates designed specifically for Shopping and PMax data. |
| Dashboard customization | PPC teams must build and adjust views without BI help. | Drag‑and‑drop editor, resizable widgets, custom formulas, filters on any Shopping dimension, and reusable templates. | Emphasize ProductMetrics.io’s customizable dashboards and ability to tailor layouts per role, market, or brand. |
| Profit and margin awareness | ROAS without margin leads to bad bidding decisions. | Ability to ingest margin/COGS, build custom profit metrics, and filter by margin tiers. | Frame ProductMetrics.io as a ROAS + profit decision layer, not just a reporting layer, via flexible custom metrics. |
| Feed and tracking visibility | Broken feeds and tracking destroy ROAS accuracy. | Dashboards that surface feed disapprovals, Merchant Center issues, and tracking anomalies impacting Shopping performance. | Position ProductMetrics.io as the place where PPCs see the impact of feed and tracking issues, even if specialized tools fix them. |
| Collaboration and governance | Agencies and in‑house teams need to share, annotate, and control access. | Role‑based permissions, shareable links, scheduled reports, annotations, and workspaces. | Emphasize how ProductMetrics.io can act as a shared, governed performance workspace for PPC, merchandising, finance, and leadership. |
| Time to value | Long implementations kill internal momentum. | First useful Shopping dashboard live in days, not months; clear onboarding checklist. | Encourage prospects to start with a focused 30‑day pilot built around two or three core Shopping dashboards. |
You can expand this matrix into a full RFP, but even a simple 1–5 score for each row will quickly separate platforms that just connect to Google Ads from those that are [truly built for Shopping ROAS](https://www.productmetrics.io/blog/roas-optimization-tools).
## 7. Security, Privacy, And Procurement Checklist
When you 'shop for ROAS optimization dashboards for Google Shopping campaigns', procurement and InfoSec will ask another set of questions entirely. Prepare answers and documentation early to keep deals moving.
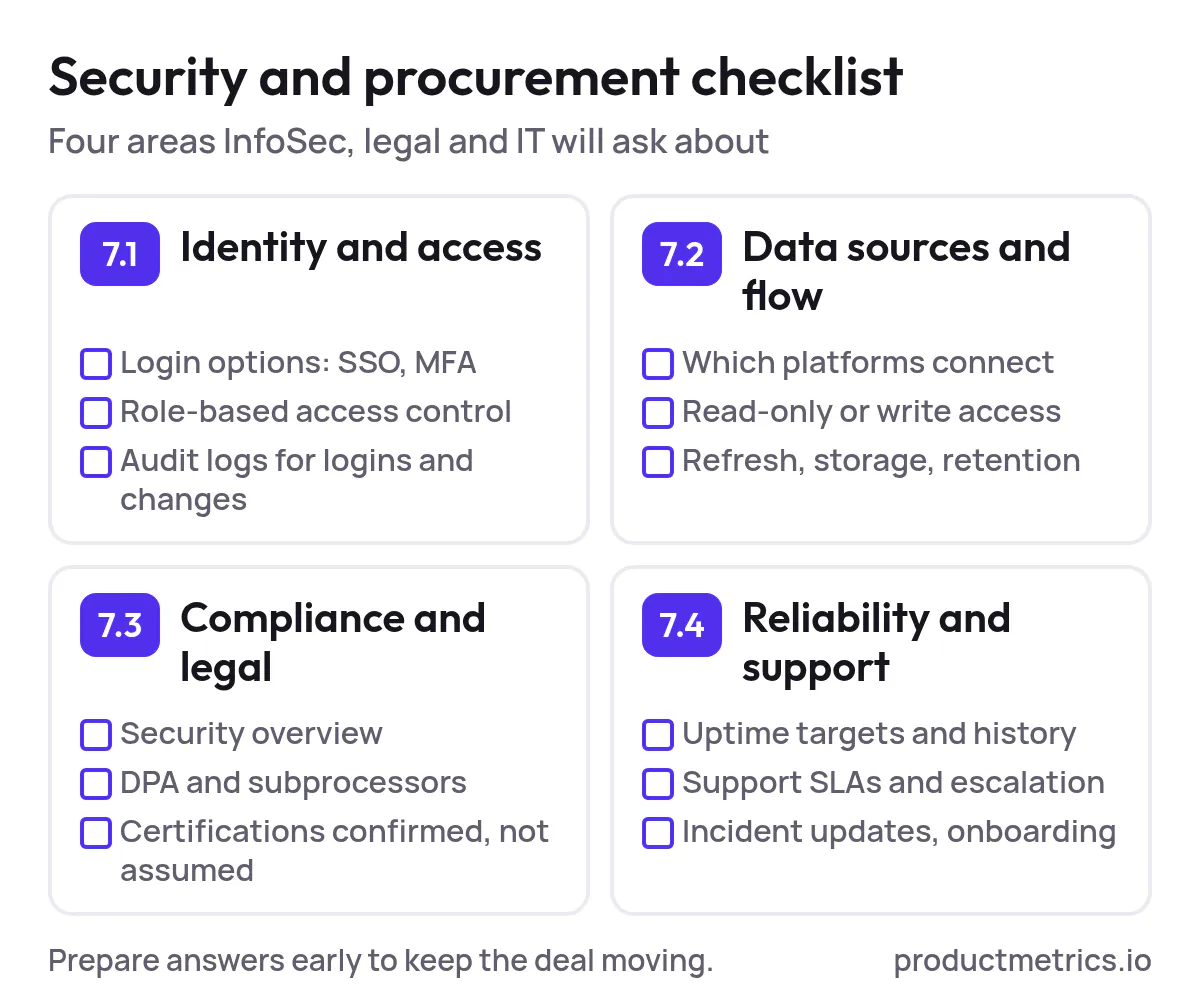
_Four areas cover what InfoSec, legal and IT ask a ROAS dashboard vendor; preparing them early keeps the purchase moving._
### 7.1 Identity And Access Management
Confirm how the vendor handles:
- User authentication (email/password, SSO options like SAML or OAuth, MFA support).
- Role‑based access control (who can edit dashboards, manage connections, or view sensitive revenue data).
- Audit logs for logins, major configuration changes, and data connections.
Document which roles in your organization will get which permissions (e.g., PPC managers vs. executives vs. agencies) before you roll out widely.
### 7.2 Data Sources And Data Flow
Map out the full data path:
- Which platforms connect (Google Ads, Merchant Center, analytics tools, [ecommerce platform](https://www.productmetrics.io/platforms), data warehouse).
- Whether connections are read‑only (preferred for ROAS analytics) or can change campaigns.
- How often data is refreshed and where it is stored.
- How the platform handles deletion requests and data retention.
Make this architecture diagram available to security reviewers so they understand exactly how Shopping performance data moves through the system.
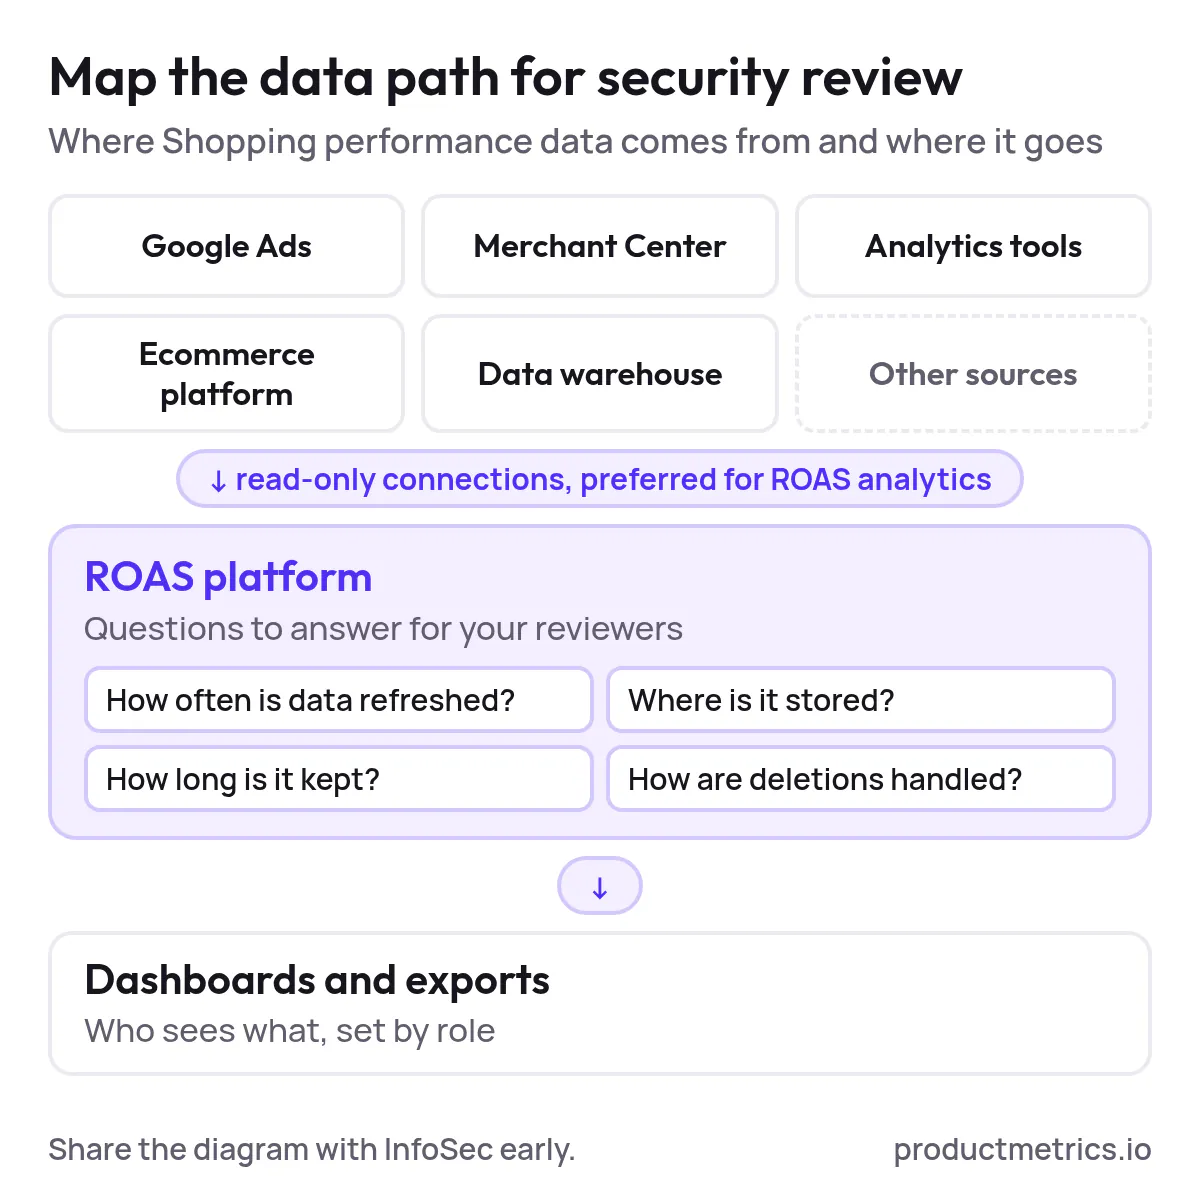
_Read-only connections are preferred for ROAS analytics; reviewers also need the refresh frequency, storage location, retention and deletion handling._
### 7.3 Security, Compliance, And Legal
Prepare (or request from the vendor):
- A security overview that covers infrastructure, network protections, and application security practices.
- A data processing agreement (DPA) or similar document that explains roles and responsibilities under relevant regulations.
- Information on any third‑party subprocessors used.
- Documentation of any formal certifications (e.g., SOC 2, ISO 27001) or, if not yet certified, evidence of equivalent controls in practice.
Avoid assuming a platform has a given certification—always confirm and document.
### 7.4 Service Reliability And Support
Before you 'order ROAS optimization software for Google Shopping with personalized dashboard options', ask for:
- Uptime targets and historical performance.
- Support SLAs (response times, escalation paths).
- Processes for incident communication.
- Onboarding and training resources for your PPC and analytics teams.
Capture all of this in a brief internal summary so legal, IT, and marketing are aligned on expectations.
## 8. Procurement FAQ For PPC And Security Teams
Use or adapt this FAQ when internal stakeholders review a platform like ProductMetrics.io.
Q1. How long does it take to get to a live Shopping ROAS dashboard?
For most teams with standard Google Ads and Merchant Center setups, you should expect to see an initial Shopping performance dashboard within days once access is granted and key connections are authorized. Time from 'connect' to 'first useful dashboard' is a critical evaluation metric.
Q2. Do we still need our existing [feed management](https://www.productmetrics.io/compare/productmetrics-vs-datafeedwatch) or bid automation tools?
A ROAS reporting and optimization platform focuses on measurement, insight, and decision support. Feed tools, bid platforms, and Google Ads itself still execute campaigns. Many teams use a specialized ROAS dashboard layer alongside existing tools rather than replacing them.
Q3. Can the platform support both Shopping and Performance Max?
Yes, your shortlist should absolutely support both. Treat [Performance Max as part of your Shopping ecosystem](https://www.productmetrics.io/blog/performance-max-for-ecommerce) and confirm that ROAS, revenue, and product‑level performance are visible for both campaign types.
Q4. How does this impact our data warehouse or BI strategy?
If you already maintain a central warehouse, confirm whether the ROAS platform can export aggregated or raw data into it. Some teams start with platform dashboards, then later add exports into their existing BI tools for advanced analysis.
Q5. What data does the vendor store and for how long?
Clarify which data fields are persisted (performance metrics, product attributes, user information) and the standard retention period. Make sure this aligns with your data retention policies and legal requirements.
Q6. How are user permissions handled across brands, regions, or agencies?
If you run multiple stores or work with agencies, check that you can isolate data access by workspace, brand, or geography and that agencies only see the accounts they manage.
Q7. What happens if we cancel the service?
Ask how you can export your dashboards or underlying data and what happens to stored data after contract termination.
Q8. How does the platform price access—by accounts, data volume, or seats?
Pricing models vary widely: some charge by number of data sources, some by ad spend, some by seats. Clarify early so finance can compare scenarios and avoid surprises as you add brands or markets.
## 9. A Practical Path To Shortlist, Pilot, And Purchase ProductMetrics.io
To move from search query to signed agreement without getting stuck, use this three‑phase approach.
**Figure: How many weeks the first two buying phases take.** Preparation takes 1–2 weeks and the hands-on pilot 3–6 weeks, so the purchase decision can follow within about two months.
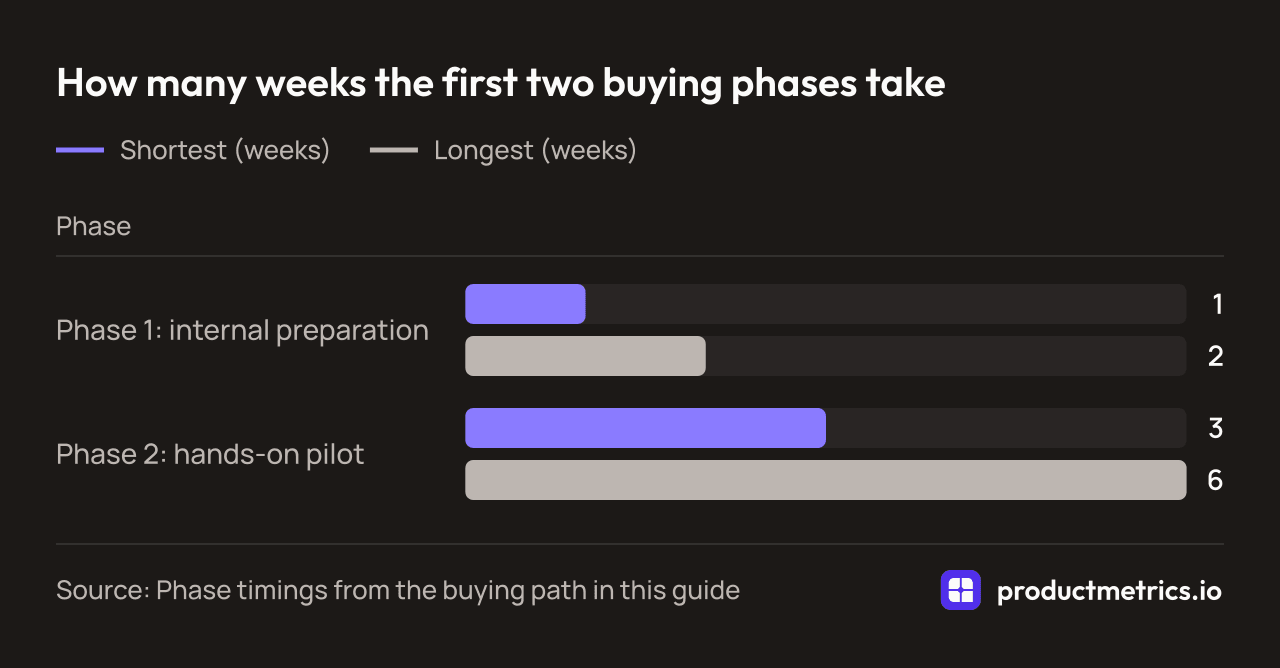
| Phase | Shortest (weeks) | Longest (weeks) |
| --- | --- | --- |
| Phase 1: internal preparation | 1 | 2 |
| Phase 2: hands-on pilot | 3 | 6 |
_Source: Phase timings from the buying path in this guide_
### Phase 1: Internal Preparation, 1–2 Weeks
1. **Define your Shopping ROAS dashboard must‑haves.**
List the exact questions you want answered in one click (e.g., 'Which products are driving most revenue but under‑invested?', 'Which [low‑margin SKUs are over‑spending](https://www.productmetrics.io/break-even-roas-calculator)?').
2. **Inventory your current stack.**
Document existing tools (feed management, bidding, analytics, BI) and how they connect to Google Ads and Merchant Center.
3. **Align stakeholders.**
Identify who will actually use the platform: PPC specialists, channel leads, finance, merchandising, leadership. Decide who must see dashboards weekly vs. monthly.
4. **Set success metrics for a pilot.**
For example: time saved on reporting, speed of answering ad‑hoc questions, reduction in wasted Shopping spend identified via dashboards.
### Phase 2: Hands‑On Pilot, 3–6 Weeks
1. **Book a focused ProductMetrics.io demo.**
Bring your demo scripts (from Section 5) and make the session interactive. Ask the team to build at least one new Shopping ROAS view live.
2. **Connect one or two priority accounts.**
Start with the Google Ads accounts where Shopping or PMax spend is material and data quality is acceptable.
3. **Rebuild your core reports inside ProductMetrics.io.**
Replace your most painful manual Shopping ROAS reports with dashboards. Measure how much faster it becomes to get answers.
4. **Run weekly pilot reviews.**
Use the platform as your source of truth in your weekly Shopping stand‑up. Capture examples where it changed a bid, budget, or product decision.
### Phase 3: Roll Out And Purchase Decision
1. **Summarize pilot impact.**
Capture quantitative wins (time saved, issues caught, optimization opportunities discovered) and qualitative feedback from users.
2. **Complete security and legal review.**
Use the checklist in Section 7 to finalize InfoSec, privacy, and legal approvals.
3. **Finalize scope and pricing.**
Decide how many brands, markets, and users you will onboard in phase one, and negotiate pricing around that footprint.
4. **Standardize your Shopping ROAS operating rhythm.**
Lock in a cadence for dashboard reviews (e.g., weekly PPC stand‑ups, monthly leadership reviews, quarterly strategic deep dives) using ProductMetrics.io as the reporting backbone.
Once these steps are complete, you are no longer just trying to 'find google shopping ROAS optimization platforms with flexible reporting dashboards'—you have a concrete, tested system for how your team will manage Shopping profitably at scale.
## 10. Next Steps
If you are ready to move beyond spreadsheets and ad‑hoc Google Ads exports, your next step is simple:
1. Document your top three Shopping ROAS questions.
2. Turn the demo scenarios in this guide into a short checklist.
3. Schedule a live walkthrough with the ProductMetrics.io team and ask them to build your core dashboards in real time with your own data.
That puts you in the strongest possible position to evaluate, shortlist, and confidently purchase the right Google Shopping ROAS optimization platform with customizable dashboards for your business.
## Keep reading.
- [The Google Shopping Segmentation Playbook For 2026 Frameworks Labels And Structures](https://www.productmetrics.io/blog/google-shopping-segmentation-playbook)
- [Measuring Profit Segmentation In Google Shopping: Metrics, Tests And The Tools That Make It Work](https://www.productmetrics.io/blog/measure-profit-segmentation-google-shopping)
- [Where to Buy and How to Choose Google Shopping Segmentation Software With Advanced Granularity: A Practical Buyer’s Guide](https://www.productmetrics.io/blog/google-shopping-segmentation-software)
---
Written by Berend Vrakking, founder of Product Metrics. Last updated 2026-11-09.
1M+ products analysed · Nominated at the Dutch Search Awards for Best Measurement Campaign (2023) and Best Use of Data (2024)
HTML version: https://www.productmetrics.io/blog/google-shopping-roas-dashboard-platforms