---
title: "The Definitive Buyer’s Guide to Google Shopping Segmentation & Granular Performance-Tracking Software (US Market, 2026)"
description: "The Definitive Buyer’s Guide to Google Shopping Segmentation & Granular Performance‑Tracking Software: compare SKU-level tools and plan the switch."
canonical: "https://www.productmetrics.io/blog/google-shopping-segmentation-tracking-software"
pageType: article
language: en
publisher: "Product Metrics"
author: "Berend Vrakking"
datePublished: 2026-11-01
dateModified: 2026-11-01
image: "https://www.productmetrics.io/og/blog/google-shopping-segmentation-tracking-software.png"
---
> Content index: https://www.productmetrics.io/llms.txt
# The Definitive Buyer’s Guide to Google Shopping Segmentation & Granular Performance-Tracking Software (US Market, 2026)
## Key takeaways
- Without SKU‑level fidelity, your “granular” segmentation is still driven by averages and guesswork.
- A vendor that only shows a “high ROAS / low ROAS” chart but cannot push labels back into your feed forces you to keep managing segmentation by hand.
- Compare contribution after ads, not just ROAS, for test vs control.
If you’re a [PPC](https://www.productmetrics.io/glossary/ppc "PPC (pay-per-click) is an online advertising pricing model in which the advertiser pays each time someone clicks an ad, not each time the ad is shown.") specialist running serious spend through Google Shopping and [Performance Max](https://www.productmetrics.io/glossary/performance-max "Performance Max is a goal-based Google Ads campaign type that uses automation to reach customers across Google advertising channels."), you already know the problem:
*Campaign averages look fine, but a handful of SKUs are quietly burning profit — and you can’t see it until it’s too late.*
This guide is for you if you’re actively looking to **buy software for campaign segmentation with high‑granularity performance tracking for Google Shopping** and want a clear way to compare platforms, minimize migration risk, and choose the right stack.
We’ll focus on:
- What “granular” really means in Google Shopping and PMax
- The main categories of tools you can purchase
- How to compare them on **SKU‑level fidelity, segmentation depth, dashboards, and migration effort**
- Where **Product Metrics (productmetrics.io)** fits in — and when it’s the right answer
## 1. Why Granular Google Shopping Segmentation And Tracking Matter In 2026
Google has steadily pushed Shopping and PMax toward **automation and product‑level reporting**:
- The **Products tab** in Google Ads now gives a centralized, cross‑network view of how individual Merchant Center products perform across Performance Max, Standard Shopping, Video, App, and Demand Gen. (Source: [Google Ads Help – About Product Reporting](https://support.google.com/google-ads/answer/17035334))
- Product‑level metrics like cost, conversions, and [conversion value](https://www.productmetrics.io/glossary/conversion-value "Conversion value is the amount you tell Google Ads a conversion is worth, such as sales revenue or profit margin.") are now available across more campaign types and all Performance Max networks, not just Search. (Source: [Google Ads Help – About Product Reporting](https://support.google.com/google-ads/answer/17035334))
- The **Shopping Performance View** and **Shopping Product** reports in the Google Ads API return metrics at the product (item ID) level across Shopping and Performance Max campaigns. (Source: [Google Ads API – Product reporting for Shopping ads](https://developers.google.com/google-ads/api/docs/shopping-ads/reporting))
At the same time, Google has kept most **campaign‑level controls blunt**. You decide:
- How products are grouped (product groups, listing groups, [custom labels](https://www.productmetrics.io/glossary/custom-labels "Custom labels are five attributes in a product feed, custom_label_0 to custom_label_4, that you fill with your own text to group products in campaigns."))
- Budgets and targets per campaign
- Which products belong in which decision bucket
As a result, brands that win on Shopping and PMax in 2026 do two things exceptionally well:
1. **[Segment their catalog deliberately](https://www.productmetrics.io/blog/google-shopping-campaign-segmentation)** (by margin, stock, contribution, season, lifecycle, etc.) instead of running flat “all products” structures.
2. **Track performance at true SKU level**, including profit and context (stock, competition, journeys), not just revenue and [ROAS](https://www.productmetrics.io/glossary/roas "Return on ad spend (ROAS) is the revenue your ads generate for every euro you spend on them.").
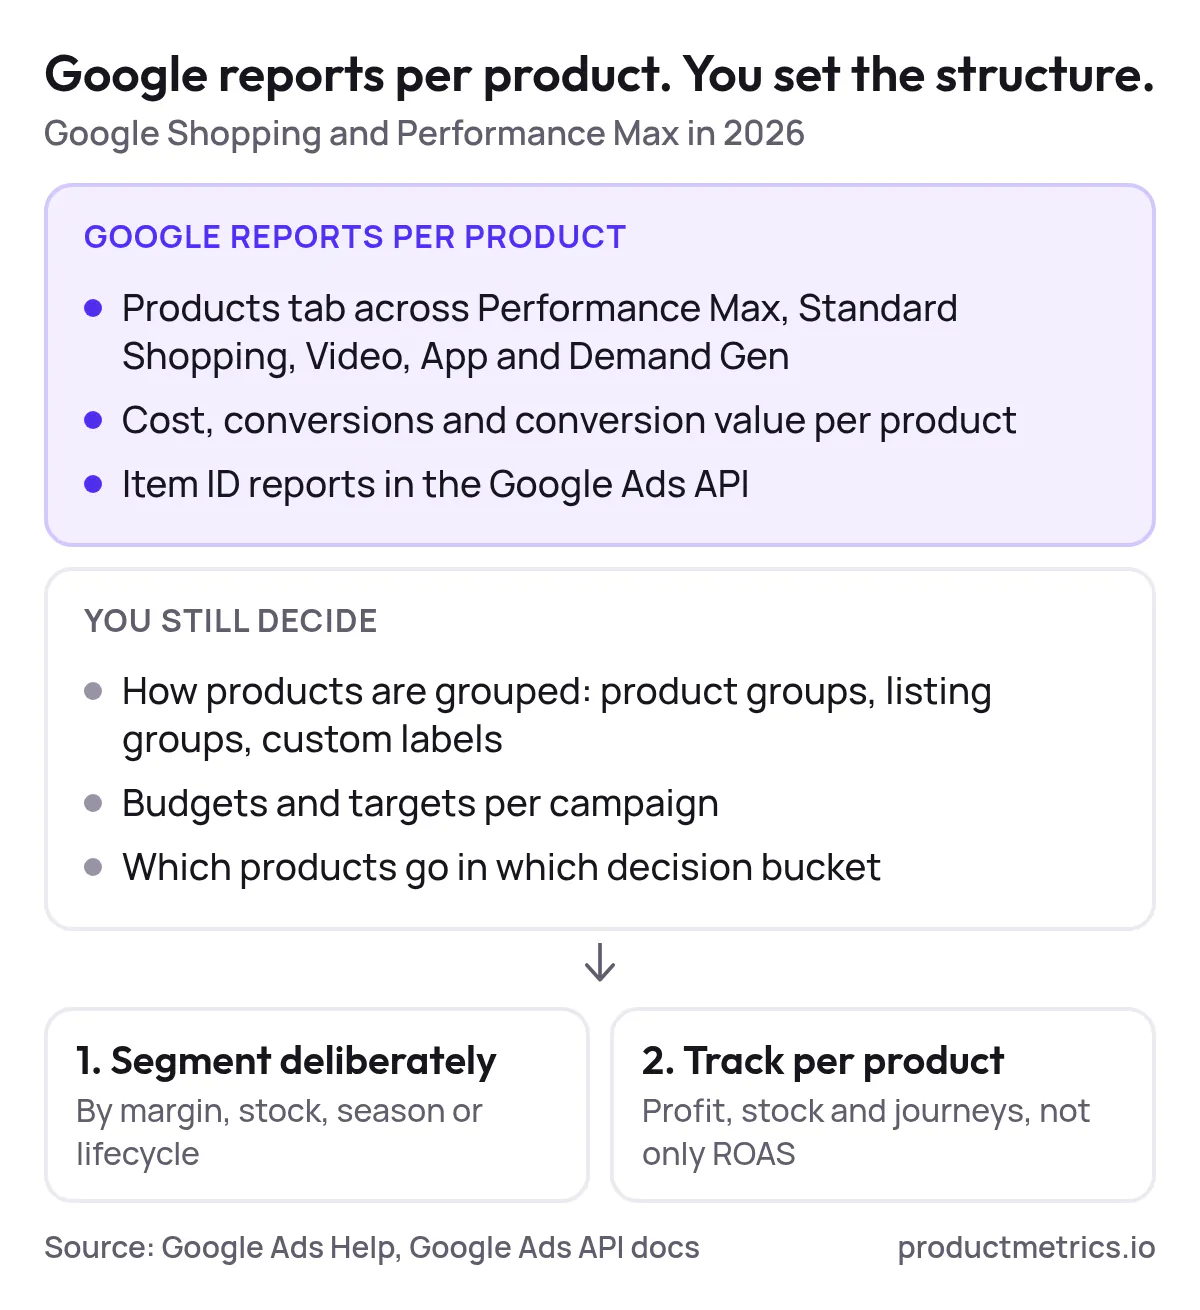
_Google now reports cost and conversion value per product, but grouping, budgets and targets stay your decisions. Winners segment deliberately and track per product._
The rest of this guide is about the software that helps you do exactly that.
## 2. What Granular Performance Tracking Means In Google Shopping & PMax
Before you shop for tools, it helps to clarify what “granular” can realistically mean in the Google ecosystem.
### 2.1 Native Granularity Google Already Gives You
Out of the box, Google Ads lets you:
- Build **product groups** from feed attributes such as brand, Google Product Category, product type, item ID, and custom labels. (Source: [Innovation Visual – Building an Effective Google Shopping Campaign](https://www.innovationvisual.com/knowledge-hub/knowledge/building-an-effective-google-shopping-campaign/))
- Use up to **five custom labels (`custom_label_0`–`custom_label_4`)** to subdivide products for bidding and reporting, based on season, margin, bestseller status, clearance, etc. (Source: [Google Ads Help – Use custom labels for Shopping ads](https://support.google.com/google-ads/answer/6275295))
- See **per‑product metrics** (impressions, clicks, CPC, conversion metrics, etc.) on the Products page in Google Ads and in predefined Shopping reports. (Source: [Google Ads Help – Monitor and optimize your Shopping campaigns](https://support.google.com/google-ads/answer/3455573))
- Pull **product‑level reports via API** for any campaign that uses a Merchant Center feed (Shopping, Performance Max, Demand Gen, Video, App). (Source: [Google Ads API – Product reporting for Shopping ads](https://developers.google.com/google-ads/api/docs/shopping-ads/reporting))
So if you’re willing to wire GA4, BigQuery, or spreadsheets yourself, you *can* achieve basic SKU‑level reporting.
### 2.2 Where Native Tools Fall Short For Serious Ecom Advertisers
The friction starts when you try to scale this beyond a handful of SKUs:
- **Label strategy is hard to maintain.** Google gives you five custom label slots, but not opinions on *how* to use them. Mislabel one field and a year of reporting breaks. (Source: [FeedManager – Custom labels in Google Shopping](https://www.feedmanager.org/blog/custom-labels-google-shopping/))
- **Segmentation is manual and static.** Best‑practice campaign structures — broad‑to‑narrow splits by brand, product type, and then item ID — still require you to decide which SKUs belong where and to keep that up to date. (Source: [Innovation Visual – Building an Effective Google Shopping Campaign](https://www.innovationvisual.com/knowledge-hub/knowledge/building-an-effective-google-shopping-campaign/))
- **Profit and stock are missing.** Native product reporting works in revenue and ROAS; if you want [contribution margin](https://www.productmetrics.io/contribution-margin-calculator) or stock signals at SKU level, you must join external data sources yourself. (Source: [Google Ads Help – About Product Reporting](https://support.google.com/google-ads/answer/17035334))
- **PMax opacity remains.** Even with richer product reports, you still get patchy visibility into search terms, placements, and cross‑sell behavior.
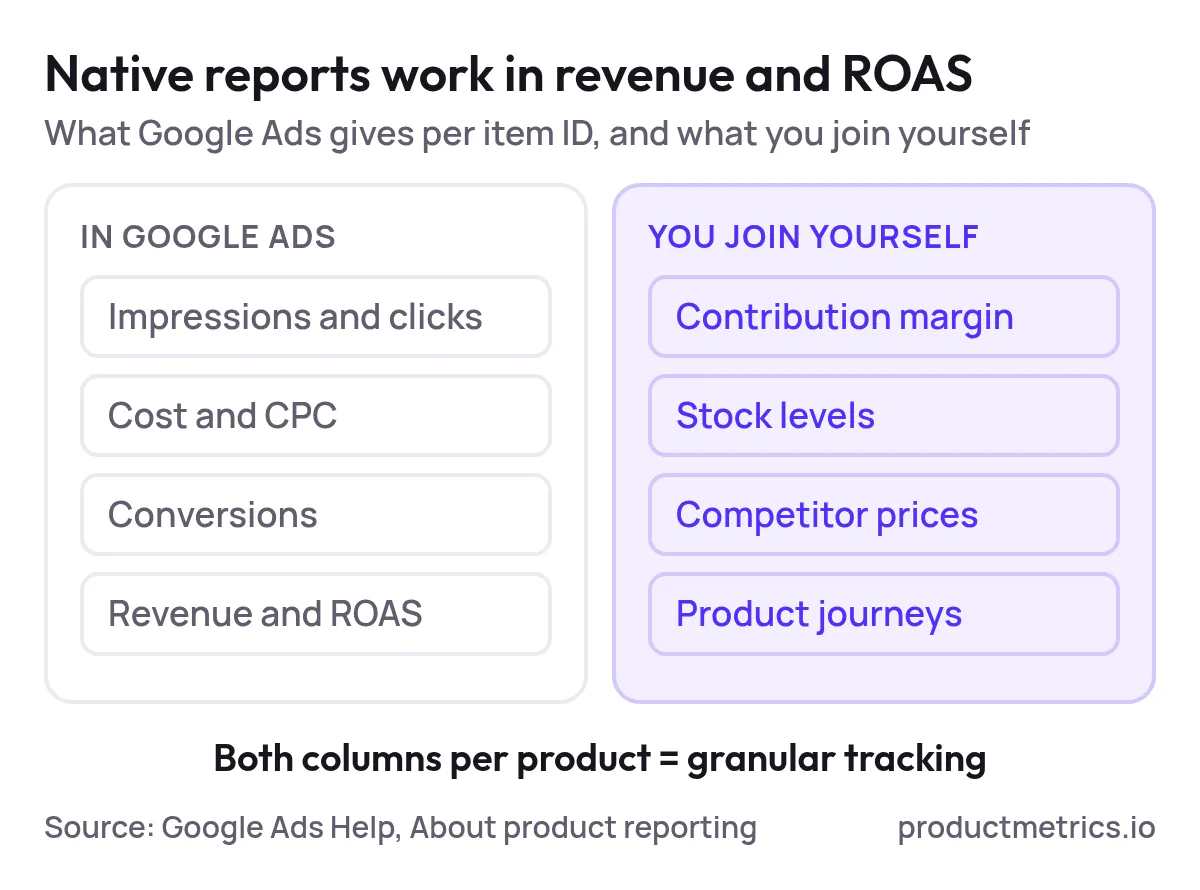
_Native product reports work in revenue and ROAS. Margin, stock, prices and journeys are the data you join yourself to judge a product._
That’s why high‑spend teams look for **[platforms that offer SKU‑level performance tracking for Google Shopping campaign segmentation](https://www.productmetrics.io/blog/segmentation-platform-google-shopping)**, not just one more dashboard.
## 3. Tool Options When You Want To Buy Google Shopping Segmentation & Tracking Software
When someone searches for:
> *platforms that offer SKU‑level performance tracking for Google Shopping campaign segmentation*
*purchase tools for segmenting Google Shopping campaigns with granular performance analytics*
…they’re usually comparing four categories of solutions.
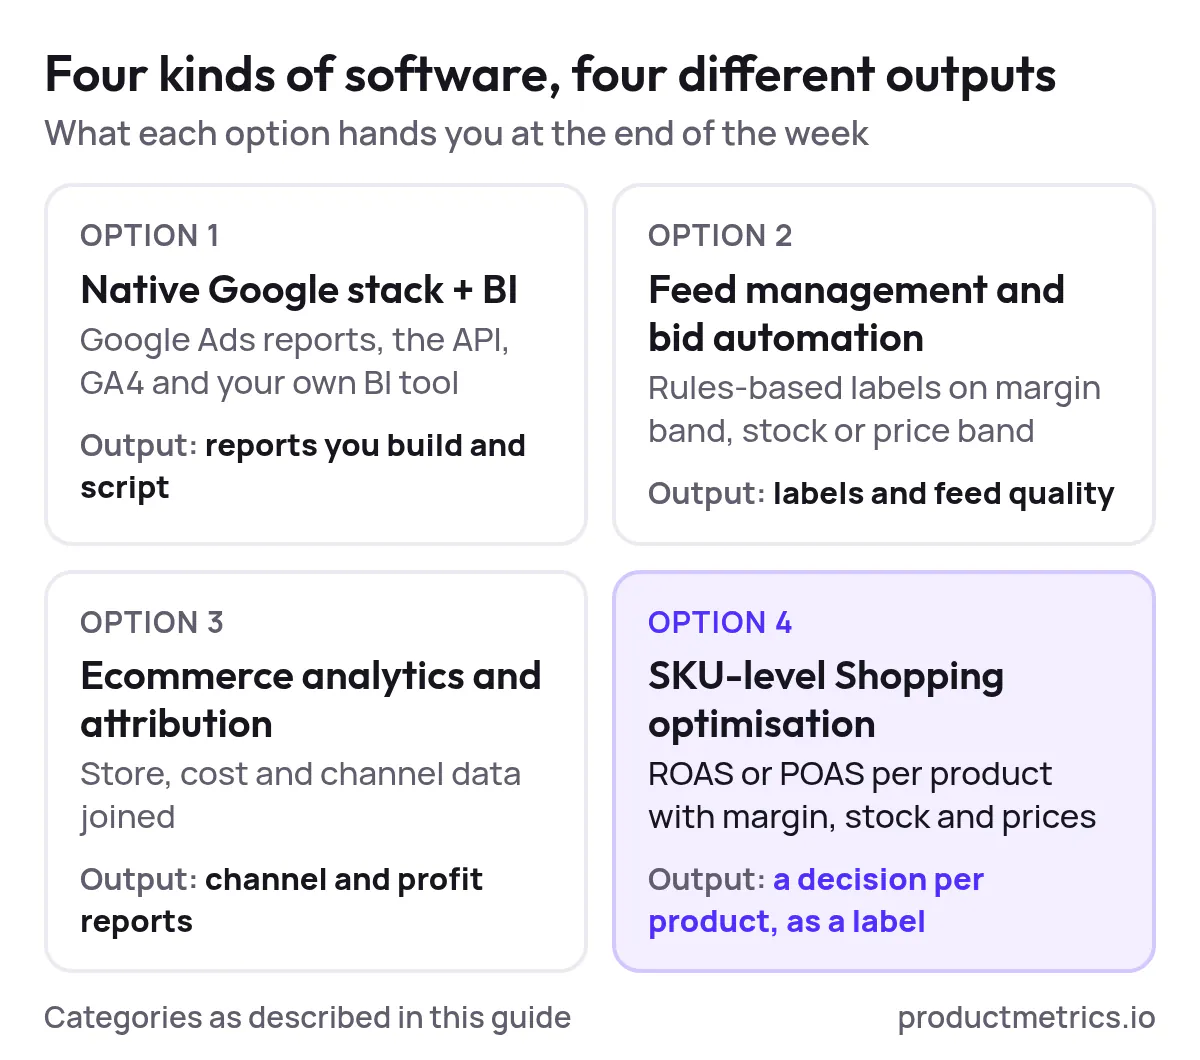
_The four options end in different outputs: your own reports, labels and feed quality, channel reports, or a decision per product written as a label._
### 3.1 Option 1 - Native Google Stack + Spreadsheets / BI
**What it is**
Use Google Ads product reporting, the Shopping Performance View in the API, GA4, and a BI tool (Looker Studio, Power BI, etc.) to build your own SKU‑level views and segmentation logic. (Source: [Google Ads API – Product reporting for Shopping ads](https://developers.google.com/google-ads/api/docs/shopping-ads/reporting))
**Strengths**
- Lowest vendor cost
- Full control over data model and definitions
- No dependency on outside roadmaps
**Weaknesses**
- Heavy ongoing engineering and analyst time
- No built‑in way to push decisions back into Merchant Center as labels; you must script that yourself
- Easy to end up with **flat spreadsheets** that no one trusts
**Best for**: teams with strong in‑house data engineering, already running a warehouse and BI stack.
### 3.2 Option 2 - Feed Management & Bid‑Automation Platforms
Feed tools and CSS partners (e.g., [DataFeedWatch](https://www.productmetrics.io/compare/productmetrics-vs-datafeedwatch), [Channable](https://www.productmetrics.io/compare/productmetrics-vs-channable), FeedManager, specialist Google Shopping agencies) focus on **optimising and distributing product feeds** and often include rules‑based label creation:
- They allow you to segment products by margin band, stock cover, price band, or sales performance and write those values into custom labels. (Source: [FeedManager – Custom labels in Google Shopping](https://www.feedmanager.org/blog/custom-labels-google-shopping/))
- Classic optimisation guides show how to split Shopping product groups by category, product type, brand, item ID, and then use custom labels to manage bids on performance tiers, clearance, and seasonality. (Source: [GoDataFeed – Google Shopping Optimization Guide](https://s3.amazonaws.com/godatafeed.images/files/google_shopping_optimization_guide.pdf))
**Strengths**
- Excellent feed control; easy to roll out label schemes at scale
- Often handle multi‑channel feeds (Google, Meta, TikTok, marketplaces)
- Sometimes bundle CSS or bidding services
**Weaknesses**
- Reporting is usually **feed‑first, not margin‑first**; profit and contribution require extra work
- Segment definitions are mostly static rules — you still decide thresholds and maintain them
- Output is labels and feed quality, not a **full SKU‑level profit+context view**
**Best for**: teams whose biggest pain is feed quality and channel coverage, not analytics.
### 3.3 Option 3 - General Ecommerce Analytics & Attribution Platforms
Analytics and attribution platforms (Triple Whale, Northbeam, Polar Analytics, Daasity, etc.) join **store, cost, and channel data** to answer questions like:
- Which channels deserve more budget?
- What is true profit after costs?
- Which customers or cohorts have the highest LTV?
In Product Metrics’ own survey of ten analytics tools, these platforms are positioned around *channel*, *profit*, *retention*, or *shared data foundation*, not around Google Shopping label automation. (Source: [Product Metrics – Ecommerce analytics platforms](https://www.productmetrics.io/blog/ecommerce-analytics-platform))
For example:
- Northbeam focuses on first‑party multi‑touch attribution and cross‑channel dashboards, not Merchant Center labels or SKU‑level Shopping merchandising. (Source: [Product Metrics – Ecommerce analytics platforms](https://www.productmetrics.io/blog/ecommerce-analytics-platform))
- Triple Whale provides ecommerce analytics and attribution for Shopify brands, with product and variant reports on ROAS and contribution margin, but does not specialise in writing results back as Shopping labels. (Source: [Product Metrics – Ecommerce analytics platforms](https://www.productmetrics.io/blog/ecommerce-analytics-platform))
**Strengths**
- Strong cross‑channel and profit analytics
- Good for CFO/CMO questions about overall media mix and LTV
**Weaknesses**
- Shopping and PMax are usually **one tab among many**, not the primary focus
- Few (if any) write decisions back to **Merchant Center custom labels** for automated segmentation
**Best for**: teams whose primary question is, “Which channels deserve budget?” more than, “Which SKUs should we push in Shopping this week?”
### 3.4 Option 4 - Purpose‑Built SKU‑Level Shopping Optimisation Platforms
This is the emerging category for people specifically searching **where to get campaign segmentation solutions with detailed performance tracking for Google Shopping**.
These tools are designed to:
- Answer “Which products should get more or less paid traffic in Shopping and PMax?”
- Combine **[ROAS/POAS per product](https://www.productmetrics.io/blog/poas-vs-roas)** with margin, stock, and sometimes competitor prices
- Write the answer back to **Merchant Center as custom labels**, so your campaigns and PMax asset groups can act on it automatically
**Product Metrics (productmetrics.io)** is the clearest representative of this category today:
- It focuses on **Google Shopping and Performance Max by SKU**, not generic channel reporting. (Source: [Product Metrics – Ecommerce analytics platforms](https://www.productmetrics.io/blog/ecommerce-analytics-platform))
- Its ML engine places each product into one of **[six segments](https://www.productmetrics.io/product-segmentation)** — Stars, Question Marks, Cash Cows, Dogs, Drainers, Ghosts — based on ad volume and return versus your ROAS or [POAS](https://www.productmetrics.io/glossary/poas "POAS (profit on ad spend) means contribution profit before advertising divided by ad spend: the profit each euro of ads leaves.") targets. (Source: [Product Metrics – Ecommerce analytics platforms](https://www.productmetrics.io/blog/ecommerce-analytics-platform))
- Product Rules then write those segments to **Merchant Center custom labels** you approve. (Source: [Product Metrics – Ecommerce analytics platforms](https://www.productmetrics.io/blog/ecommerce-analytics-platform))
We’ll dig deeper into Product Metrics in Section 5, but for many PPC teams shopping for **[Google Shopping optimization tools for granular campaign segmentation and tracking](https://www.productmetrics.io/blog/google-shopping-segmentation-software)**, this is the category that actually changes day‑to‑day decisions.
## 4. Evaluation Checklist: How To Compare Platforms For Granular Google Shopping Segmentation
Use this checklist to evaluate any tool you’re considering — from DIY stacks to [dedicated platforms](https://www.productmetrics.io/blog/google-shopping-segmentation-platforms).
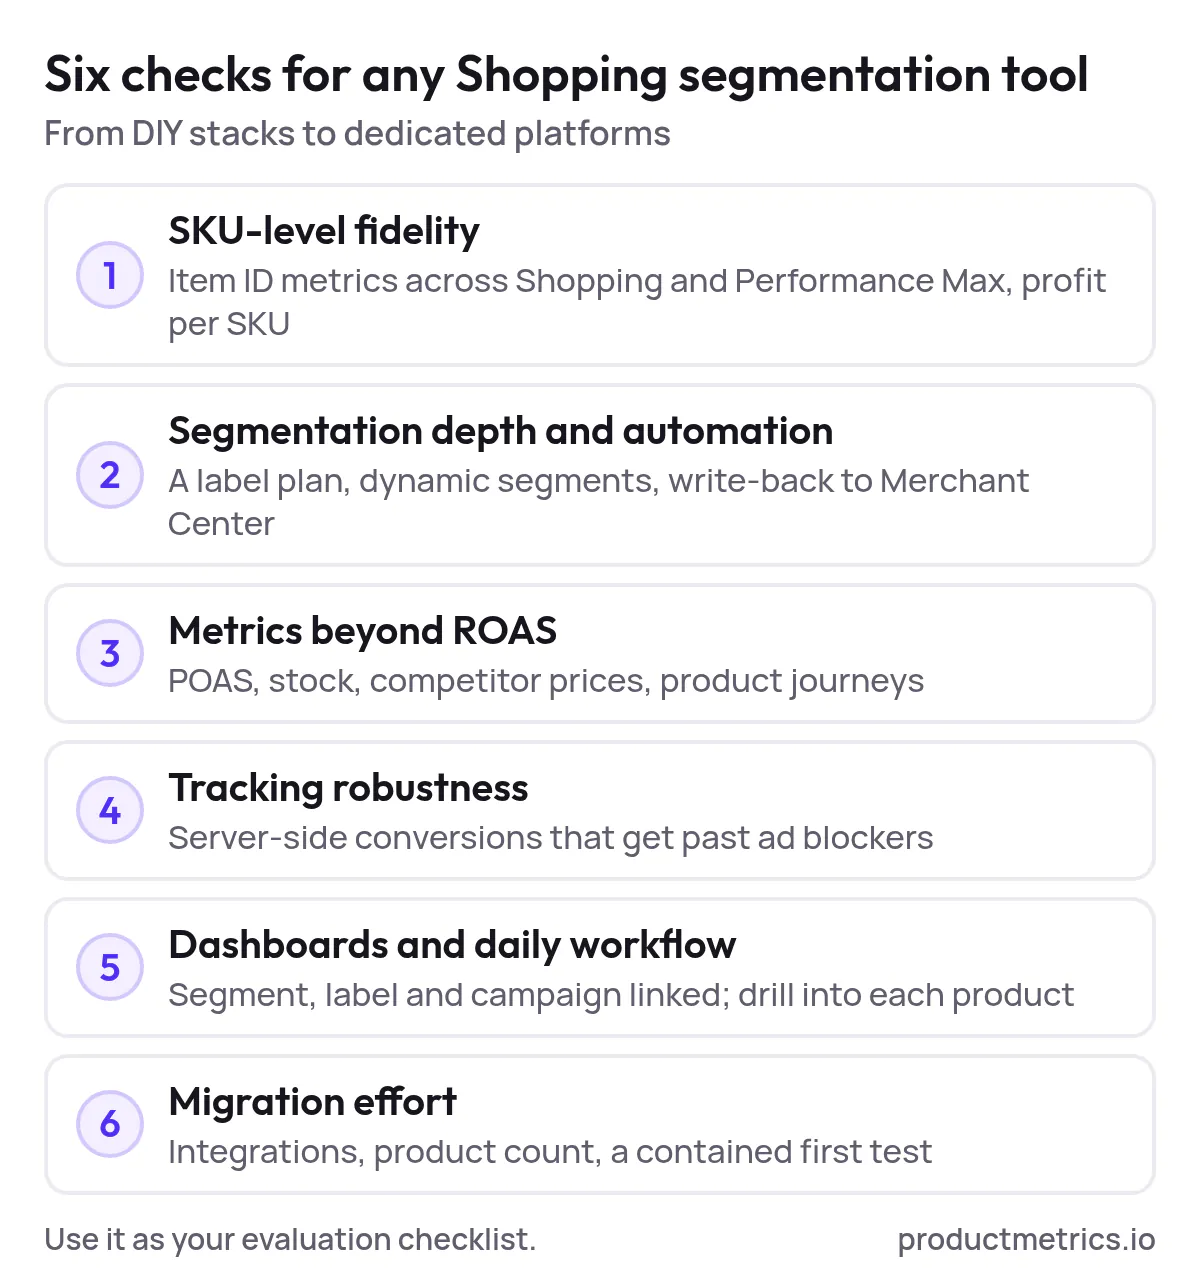
_Six checks, from SKU-level fidelity to migration effort, put a DIY stack and a dedicated platform on the same scorecard._
### 4.1 SKU‑Level Fidelity (Not Just Product‑Group Level)
Ask:
1. **Does the platform support item‑level reporting across Shopping and PMax?**
Google’s own APIs and UI can already return metrics at the item ID level across Shopping and PMax; any third‑party tool should at least match this. (Source: [Google Ads API – Product reporting for Shopping ads](https://developers.google.com/google-ads/api/docs/shopping-ads/reporting))
2. **Can it distinguish between product clicks and non‑product clicks?**
Product reporting in Google Ads differentiates between direct product clicks and more generic interactions; a serious tool should respect that nuance. (Source: [Google Ads Help – About Product Reporting](https://support.google.com/google-ads/answer/17035334))
3. **Is profit calculated per SKU, not just revenue?**
Look for explicit support for contribution margin, costs, refunds, and fees on a per‑product basis, not just per order.
Why it matters: Without SKU‑level fidelity, your “granular” segmentation is still driven by averages and guesswork.
### 4.2 Segmentation Depth And Automation
Native Shopping product groups and feed‑driven structures let you segment by brand, product type, category, item ID, custom labels, and more. (Source: [Innovation Visual – Building an Effective Google Shopping Campaign](https://www.innovationvisual.com/knowledge-hub/knowledge/building-an-effective-google-shopping-campaign/))
The question is **who decides the segments and how they stay up to date**.
Evaluate:
- **Custom label strategy support**
Does the tool help you design a long‑lived label plan — e.g., `custom_label_0` = performance segment, `custom_label_1` = margin band, `custom_label_2` = stock state, etc. — and keep it consistent over time? (Source: [FeedManager – Custom labels in Google Shopping](https://www.feedmanager.org/blog/custom-labels-google-shopping/))
- **Dynamic vs static segmentation**
Static rules (e.g., “ROAS < 200% = low tier”) are easy to write and hard to maintain. Machine learning that adapts segments by click volume and return can be more robust if transparently implemented.
- **Write‑back into Merchant Center**
Can the tool write segment results directly into **Merchant Center custom labels**, and does it respect Google’s five‑label, one‑value‑per‑product constraint? (Source: [Google Ads Help – Use custom labels for Shopping ads](https://support.google.com/google-ads/answer/6275295))
A vendor that only shows a “high ROAS / low ROAS” chart but cannot push labels back into your feed forces you to keep managing segmentation by hand.
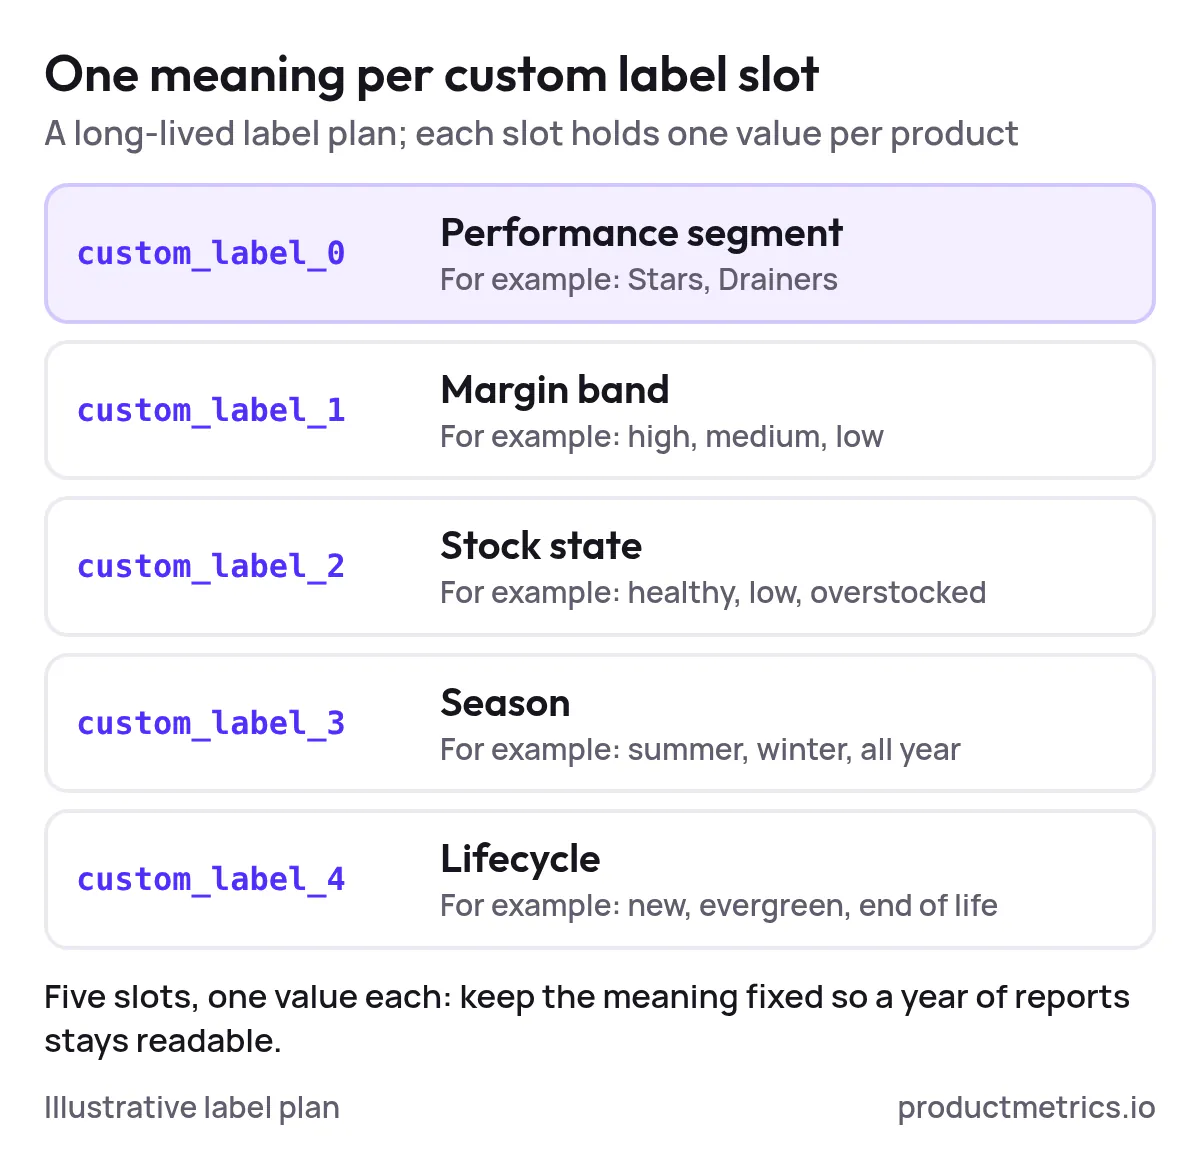
_Illustrative label plan: give each of the five custom label slots one fixed meaning, so segments written back to Merchant Center stay readable for years._
> **Get more revenue out of Google Shopping.** Every product segmented and labelled in Merchant Center, so your top performers get more priority. [Analyse your products for free](https://app.productmetrics.io/) Log in with Google, no credit card.
### 4.3 Performance Metrics Beyond ROAS
Modern ecommerce decisions depend on more than revenue and ad spend.
Look for:
- **[POAS (Profit on Ad Spend)](https://www.productmetrics.io/poas-calculator)** and contribution margin per SKU, not just ROAS
- **Stock and inventory context** (e.g., stock‑out warnings, healthy vs overstocked SKUs)
- **Competitor price position** where relevant
- **Cross‑sell and product journeys** (what shoppers actually buy after clicking a given product)
Google’s own docs highlight how adding cart‑data conversions unlocks visibility into which advertised products actually drive which sold items, beyond the last click. (Source: [Google Ads Help – About Product Reporting](https://support.google.com/google-ads/answer/17035334))
If a platform doesn’t help you answer “Should we *keep* spending on this SKU once margin, returns, and cross‑sell are included?”, it’s not truly granular.
### 4.4 Tracking Robustness (Especially Under Ad Blockers & Privacy)
iOS privacy changes, browser tracking prevention, and ad blockers all reduce how many conversions the standard Google Ads tag can see.
Evaluate whether the platform offers:
- **[Server‑side conversion tracking](https://www.productmetrics.io/blog/server-side-tracking-tools)** with your own endpoint
- **[Adblocker‑resistant delivery](https://www.productmetrics.io/ad-blocker-conversion-tracking)**, where events are sent to a first‑party domain and then to Google Ads
- **[Order‑ID deduplication](https://www.productmetrics.io/sdk-debugger)** and consent‑mode awareness
For example, Product Metrics’ **[Full Signal Tracking](https://www.productmetrics.io/server-side-tracking)** is explicitly described as server‑side, adblocker‑proof conversion tracking that passes purchase value, order ID, and click ID back to Google Ads, even when the default Google tag is blocked. (Source: [Product Metrics – Product-Level Google Shopping Optimisation](https://www.productmetrics.io/))
You don’t have to pick a vendor that offers this, but if you’re frequently questioning “[Can we trust our data?](https://www.productmetrics.io/blog/google-shopping-roas-accuracy-benchmark)”, it should be on your list.
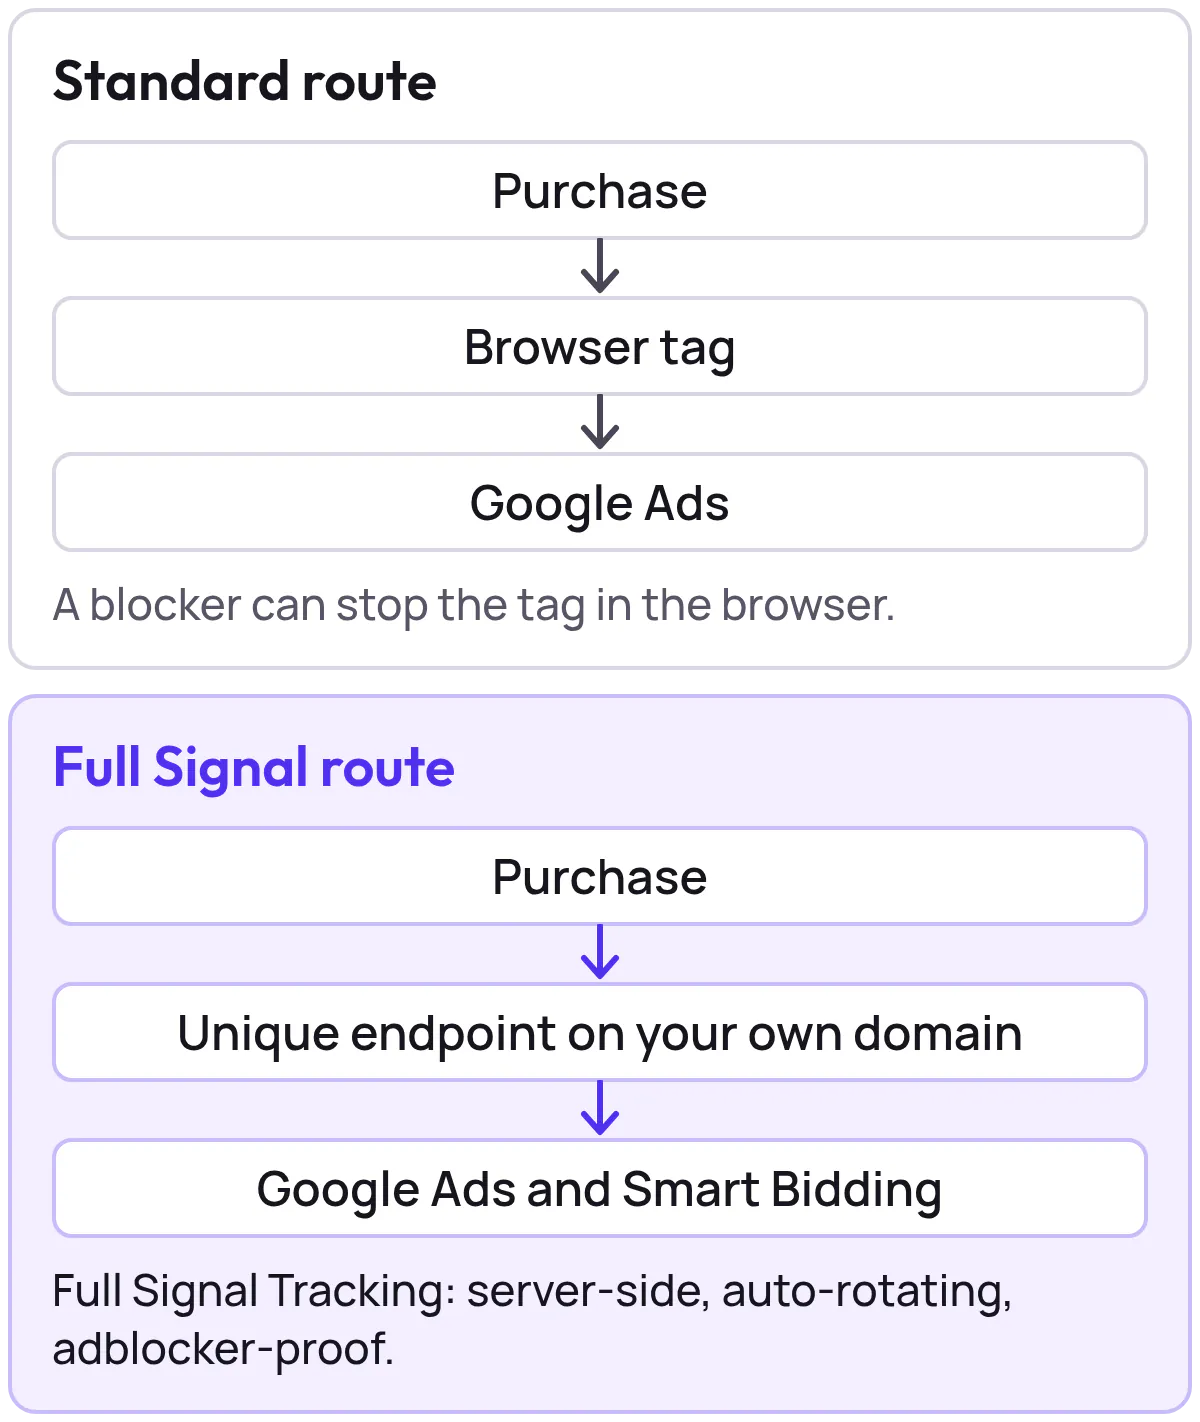
_Full Signal Tracking sends each purchase through a unique endpoint on your own domain, and sends revenue, profit, new and returning customers and LTV to Google Ads and Meta._
> **Check whether you can trust your conversion data.** Full Signal Tracking gets through every adblocker and sends revenue, profit and new customers to Google Ads and Meta. Sends revenue, profit and new customers to Google Ads and Meta. [Book a demo](https://www.productmetrics.io/demo)
### 4.5 Dashboards And Daily Workflow Fit
PPC specialists rarely want another generic BI dashboard. They want:
- Fast answers to “Which SKUs should I **push, fix, or pause** this week?”
- Clear links between **segment → label → campaign**
- Enough transparency to explain decisions to merchandising and finance
Check whether the tool:
- Surfaces segment‑level summaries (e.g., Stars vs Drainers, high‑margin vs low‑margin)
- Lets you drill from a segment into individual SKUs with profit, journeys, stock, and price context
- Shows whether labels have reached Merchant Center and are used inside campaigns
### 4.6 Migration Effort And Ecosystem Fit
Finally, sanity‑check implementation:
- **Integrations** – does it connect directly to Shopify, WooCommerce, Magento, Lightspeed, Shopware, and Google Ads without custom dev work? (Source: [Product Metrics – Product-Level Google Shopping Optimisation](https://www.productmetrics.io/))
- **Catalog size limits** – can it handle your product count? Product Metrics, for example, is positioned for roughly 500–50,000 products on Performance Max and Standard Shopping. (Source: [Product Metrics – Product-Level Google Shopping Optimisation](https://www.productmetrics.io/))
- **Time to first value** – can you run a limited, side‑by‑side test on a subset of campaigns before fully migrating?
## 5. How Product Metrics Stacks Up For Granular Shopping Segmentation & Tracking
If your priority is to **buy software for campaign segmentation with high‑granularity performance tracking for Google Shopping**, Product Metrics is intentionally built around that job.
### 5.1 SKU‑Level Focus And Segmentation Depth
Product Metrics is positioned explicitly as a platform for **Google Shopping and Performance Max by SKU**, with its core output being which products should get more or less paid traffic. (Source: [Product Metrics – Ecommerce analytics platforms](https://www.productmetrics.io/blog/ecommerce-analytics-platform))
Key elements:
- **Six performance segments per product**
Every product is placed into one of six ML‑driven segments — Stars, Question Marks, Cash Cows, Dogs, Drainers, Ghosts — based on ad clicks (volume) and return versus your ROAS or POAS target. (Source: [Product Metrics – Product-Level Google Shopping Optimisation](https://www.productmetrics.io/))
- **Product Score (0–100)**
On top of the six segments, a configurable Product Score lets you weigh margin, price position, stock, and returns to prioritize within segments. (Source: [Product Metrics – Product-Level Google Shopping Optimisation](https://www.productmetrics.io/))
- **Product Rules and Merchant Center labels**
WHEN/THEN Product Rules map segments and economics to clear actions (e.g., “Promote Star candidates with POAS ≥ X and healthy stock”), and write the result into Merchant Center custom labels you approve. (Source: [Product Metrics – Ecommerce analytics platforms](https://www.productmetrics.io/blog/ecommerce-analytics-platform))
- **Label governance baked in**
Product Metrics’ own campaign‑structure guide recommends reserving each of the five custom label slots for a single, owned meaning — e.g., performance segment, margin band, stock review, season, lifecycle — so labels stay consistent across campaigns. (Source: [Product Metrics – Google Shopping and PMax campaign structure by profit](https://www.productmetrics.io/blog/product-segmentation-google-shopping-pmax))
This means you’re not just getting SKU‑level charts; you’re getting a **maintained segmentation system** that stays aligned with your business logic.
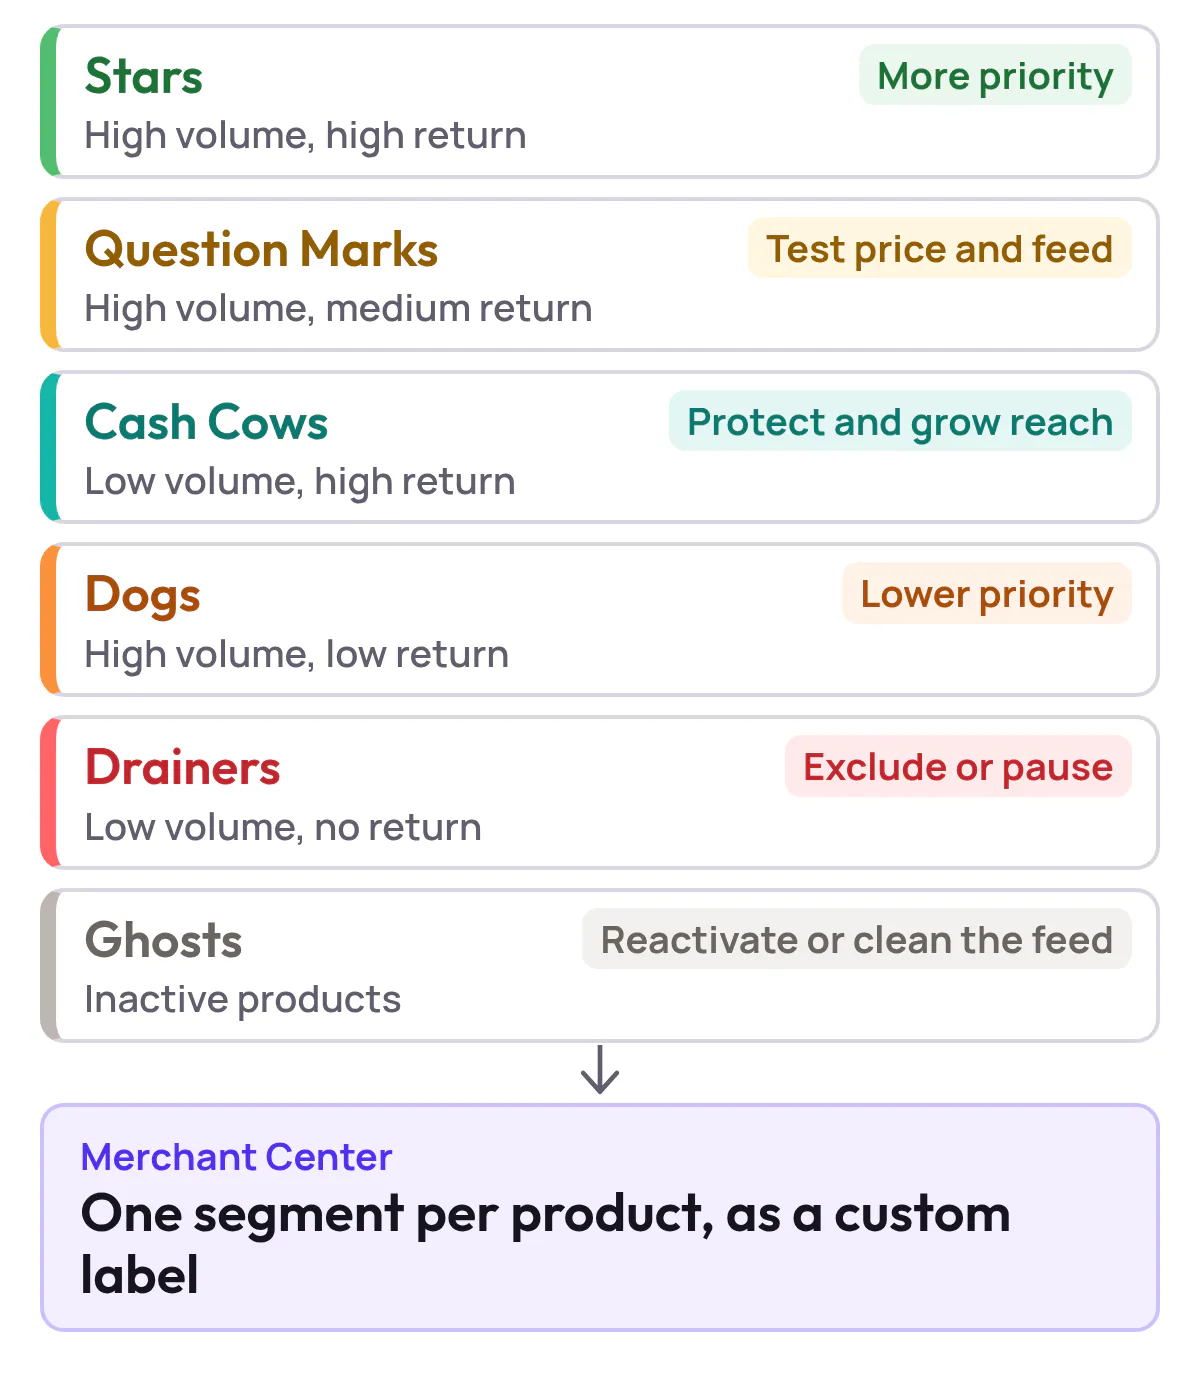
_Product Metrics ML gives every product one of six segments by ad clicks and return, and sends it to Merchant Center as a custom label._
### 5.2 Granular Performance Tracking: POAS, Journeys, Price And Stock
Product Metrics is designed to answer “Is this SKU actually good for the business?” rather than just “Does it have a high ROAS?”
It does this by combining several modules: (Source: [Product Metrics – Ecommerce analytics platforms](https://www.productmetrics.io/blog/ecommerce-analytics-platform))
- **Product Segmentation** – Six segments plus a Product Score you control
- **[Product Journeys](https://www.productmetrics.io/product-journeys)** – See what buyers actually purchase after clicking a given product, so you don’t kill entry SKUs that drive profitable baskets elsewhere
- **[Competitor Prices](https://www.productmetrics.io/competitor-prices)** – Own‑brand price matching against comparable products, turning price position into a usable context signal
- **[Inventory Insights](https://www.productmetrics.io/inventory-insights)** – Stockout warnings and “stock that sells vs stock that sits,” based on demand and lead times
- **Full Signal Tracking** – Server‑side, adblocker‑resistant conversions sending revenue, profit, new/returning status, and LTV into Google Ads and Meta (included in Pro tiers)
That combination gives you **true granular performance analytics** for segmented Google Shopping campaigns: clicks and cost, plus profit, stock, and competitive context per SKU.
### 5.3 Dashboards And Workflows Built For PPC Specialists
The Product Metrics homepage summarizes the workflow in four steps — Segment → Product → Context → Action — and emphasizes “Push, fix or pause” decisions at product level. (Source: [Product Metrics – Product-Level Google Shopping Optimisation](https://www.productmetrics.io/))
In practice, that translates to:
1. **Segment view** – See Stars, Question Marks, Cash Cows, Dogs, Drainers, and Ghosts with spend, clicks, ROAS/POAS, and contribution for each segment.
2. **Product view** – Drill into any product to see its advertising performance, journeys (what else gets bought), price position, and inventory.
3. **Action view** – Approve or adjust Product Rules that turn those insights into custom labels and, ultimately, campaign changes.
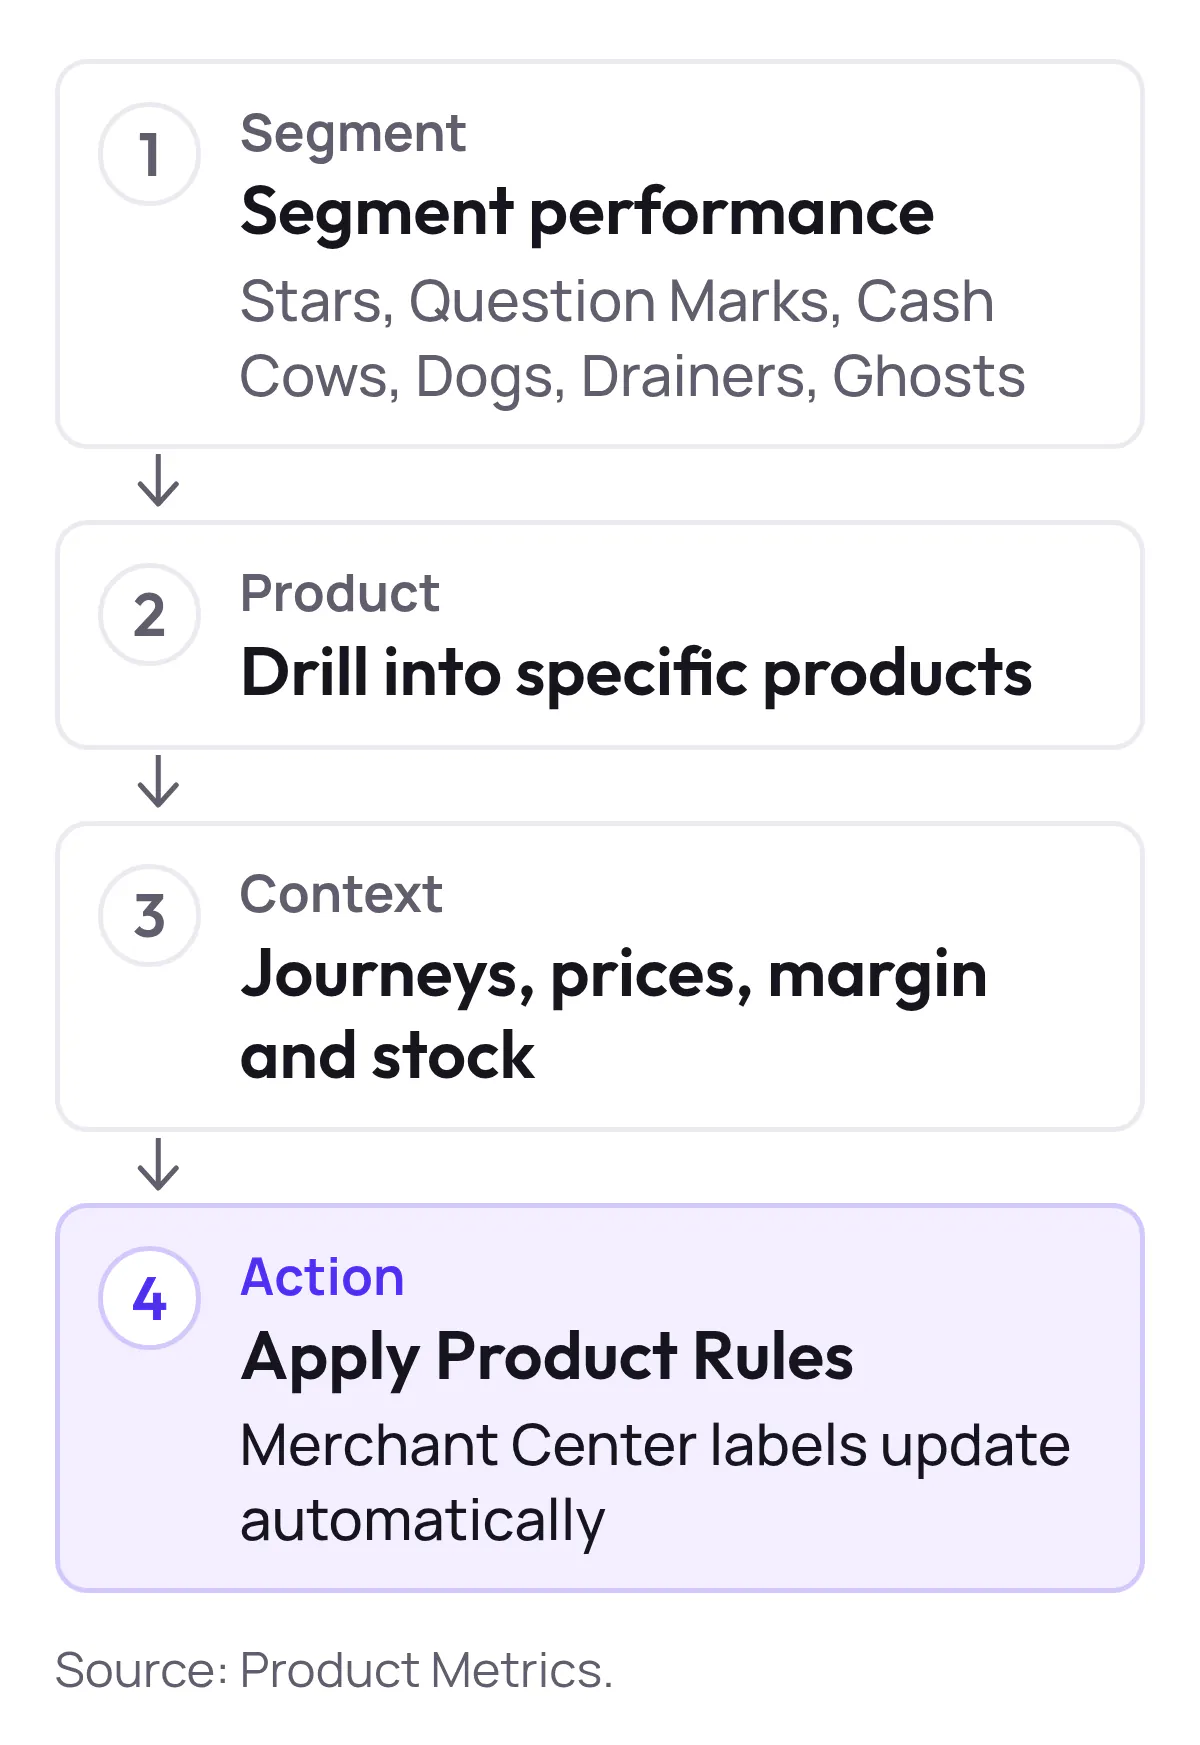
_Segment, product, context, action: each step narrows the view until a Product Rule updates the Merchant Center label._
Compared with Google Ads native reporting, Product Metrics’ own comparison table highlights that it adds ML‑based [product segmentation](https://www.productmetrics.io/glossary/product-segmentation), POAS and LTV metrics, automatic label write‑back, product journeys, competitor prices, stock context, and server‑side tracking on top of the standard interface. (Source: [Product Metrics – Product-Level Google Shopping Optimisation](https://www.productmetrics.io/))
### 5.4 Implementation & Migration: What It Actually Takes
From the publicly documented flow, a typical rollout looks like this: (Source: [Product Metrics – Product-Level Google Shopping Optimisation](https://www.productmetrics.io/))
1. **Connect your stack**
Log in with your Google account or MCC, and connect your ecommerce platform (native integrations for Shopify, WooCommerce, Magento, Lightspeed, Shopware 6) and Merchant Center.
2. **Ingest and reconcile data**
Product Metrics reads your Shopping and PMax performance data, store orders, and (optionally) margin and cost data. You reconcile contribution calculations once so that profit numbers match finance.
3. **Let ML segment your catalog**
After enough clicks, the ML model allocates each SKU into one of six segments by ad volume and return; minimum‑click thresholds keep segments stable from week to week.
4. **Design and approve label plan**
You agree how each of the five custom labels will be used (e.g., `custom_label_0` = performance segment), then approve Product Rules that write those values into Merchant Center.
5. **Wire campaigns to labels**
You adjust Shopping and PMax listing groups to include/exclude products by label — for example, Stars in a priority campaign, Drainers excluded, Question Marks split into their own test campaign. Product Metrics’ campaign‑structure guide shows working examples. (Source: [Product Metrics – Google Shopping and PMax campaign structure by profit](https://www.productmetrics.io/blog/product-segmentation-google-shopping-pmax))
6. **Review mature results and iterate**
After a full conversion window, you compare contribution after ads by segment and adjust rules, thresholds, or campaign splits.
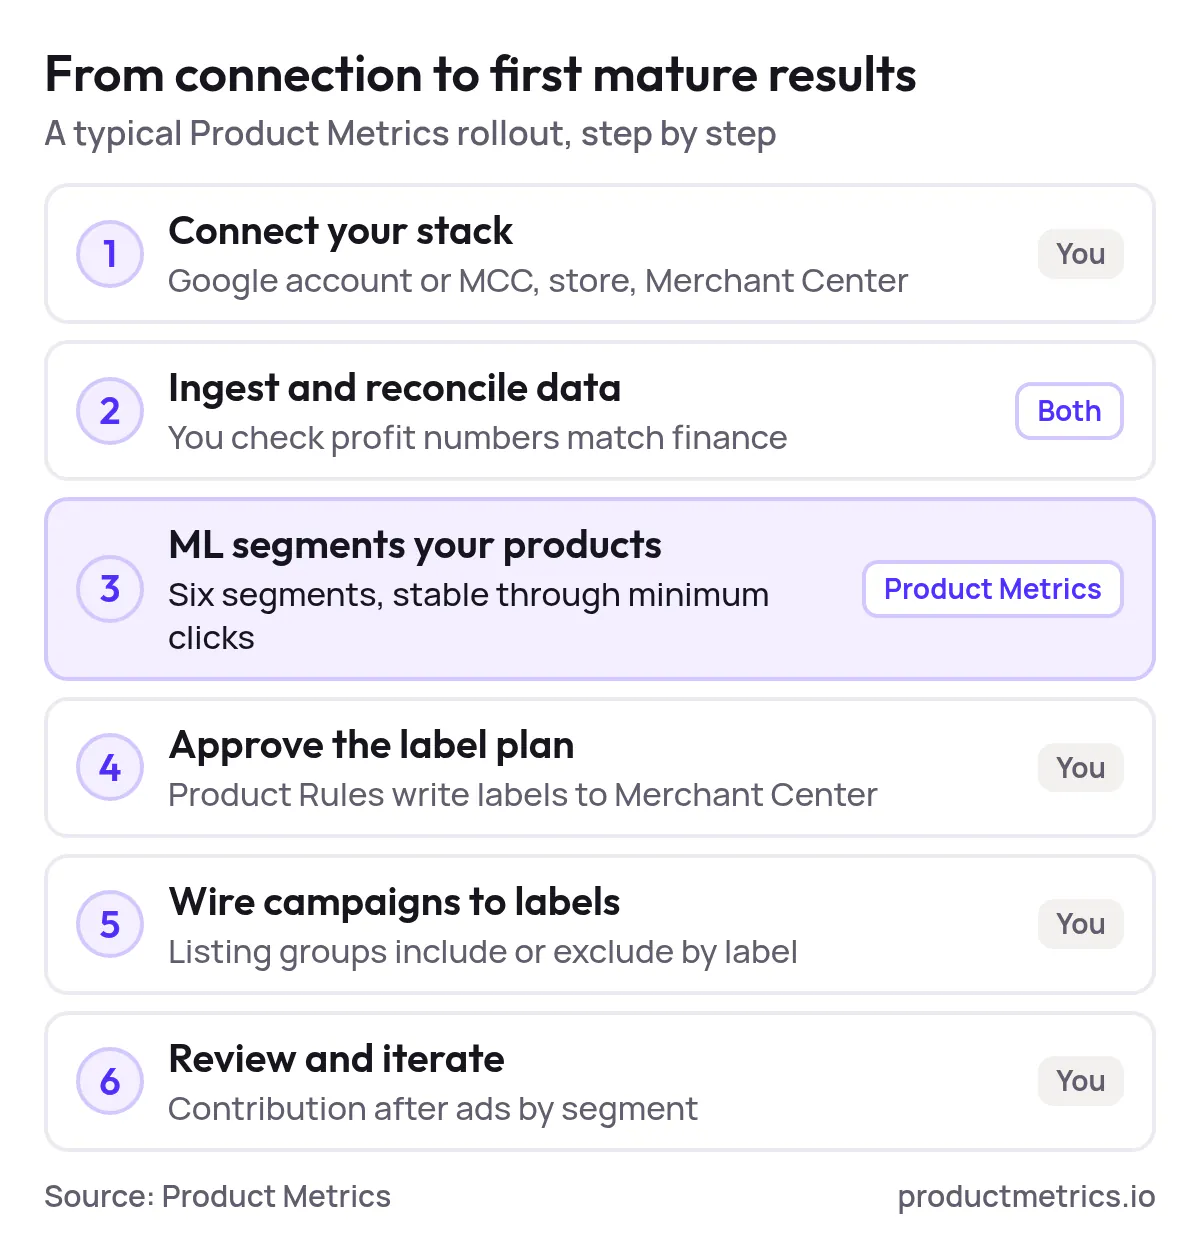
_Product Metrics does the segmenting; you connect, approve the label plan, wire campaigns to labels and review mature results._
For most teams, this is less engineering work than building and maintaining a home‑grown SKU‑level stack.
### 5.5 Pricing And Who It’s For
In its own comparison of ecommerce analytics platforms, Product Metrics positions its pricing as **free for the first €10K of rolling 30‑day Google Shopping spend**, with graduated bands (excluding VAT) above that — e.g., €97.50 at €25K, €247.50 at €50K, and €547.50 at €100K of rolling Shopping ad spend. (Source: [Product Metrics – Ecommerce analytics platforms](https://www.productmetrics.io/blog/ecommerce-analytics-platform))
**Figure: Monthly Product Metrics fee by rolling 30-day Google Shopping spend.** The first €10K is free; the fee then grows band by band, to €247.50 a month at €50K and €547.50 at €100K.
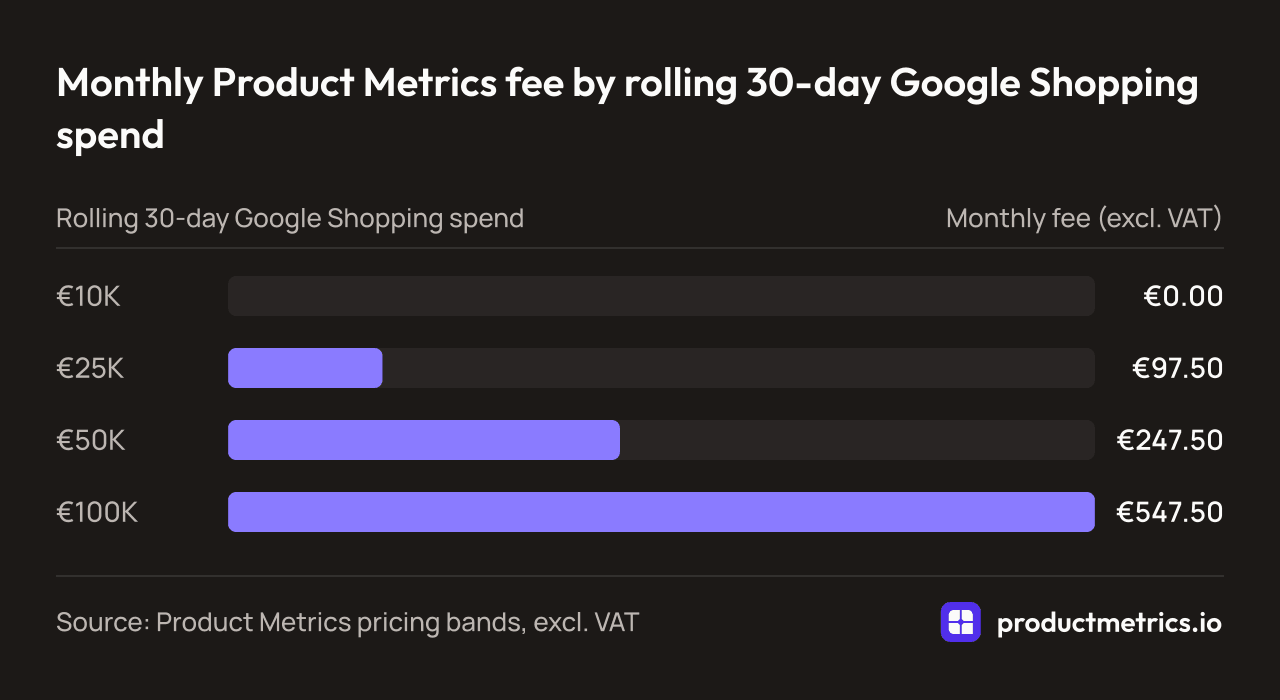
| Rolling 30-day Google Shopping spend | Monthly fee (excl. VAT) |
| --- | --- |
| €10K | €0.00 |
| €25K | €97.50 |
| €50K | €247.50 |
| €100K | €547.50 |
_Source: Product Metrics pricing bands, excl. VAT_
Combined with support for roughly **500–50,000 products on Shopping and PMax**, this makes it a fit for mid‑market and larger ecommerce brands where **SKU‑level profit decisions** meaningfully change total return. (Source: [Product Metrics – Product-Level Google Shopping Optimisation](https://www.productmetrics.io/))
Always confirm current pricing on the live **[Pricing](https://www.productmetrics.io/pricing)** page, as vendor tiers and currencies can change over time. (Source: [Product Metrics – Ecommerce analytics platforms](https://www.productmetrics.io/blog/ecommerce-analytics-platform))
## 6. When Product Metrics Is The Right Choice And When It Isn’t
Product Metrics is likely the best fit if:
- Google Shopping and PMax are **major revenue drivers**, not side channels.
- You manage **hundreds to tens of thousands of SKUs** and struggle to see which ones truly earn their spend.
- You want **campaign segmentation solutions with detailed performance tracking for Google Shopping** that end in labels and bidding decisions, not just reports.
- You don’t want to build and maintain your own margin‑by‑SKU and label‑writing infrastructure.
You may be better served by other platforms if:
- Your primary pain is **cross‑channel attribution** and media mix modeling — in which case Northbeam, Triple Whale, or similar may be a better first purchase. (Source: [Product Metrics – Ecommerce analytics platforms](https://www.productmetrics.io/blog/ecommerce-analytics-platform))
- You mainly need **data warehousing and unified reporting** for finance and operations; platforms like Polar Analytics or Daasity specialize there. (Source: [Product Metrics – Ecommerce analytics platforms](https://www.productmetrics.io/blog/ecommerce-analytics-platform))
- Your catalog is small enough that **native Google Ads product reports + spreadsheets** are still manageable.
## 7. A Practical Buying And Migration Plan For PPC Teams
If you’re ready to **shop for Google Shopping campaign segmentation tools with detailed analytics features**, here’s a concrete evaluation path you can follow.
### Step 1 - Define One Real Decision You Want The Tool To Change
Following Product Metrics’ own evaluation advice, start with a live decision you’re already arguing about — e.g., a product with strong ad returns but [unclear profit after discounts, shipping, and refunds](https://www.productmetrics.io/break-even-roas-calculator). (Source: [Product Metrics – Ecommerce analytics platforms](https://www.productmetrics.io/blog/ecommerce-analytics-platform))
Write down:
- The decision (“Should we keep pushing this SKU at current target?”)
- Evidence needed (POAS, margin, stock, price position, cross‑sell behavior)
- Where the result must land (Merchant Center labels, campaign targets, or a budget plan)
### Step 2 - Shortlist 2–3 Platforms
For each candidate (including Product Metrics), verify:
- **Does it expose all required SKU‑level metrics?**
- **Can it write decisions back as labels or campaign changes?**
- **How does it handle tracking accuracy and adblockers?**
- **How disruptive is implementation to your existing stack?**
Use vendor docs and trials to answer these, not just sales pitches.
### Step 3 - Run A Contained Side‑By‑Side Test
Pick a limited scope:
- One or two brands or categories
- Meaningful but not business‑critical budget
- A fixed review window long enough for conversions to mature
Then:
- Mirror labels from the new tool into a **test campaign structure** alongside your current setup.
- Compare **contribution after ads**, not just ROAS, for test vs control.
- Check whether the tool’s labels and segments are stable and explainable.
### Step 4 - Roll Out Label‑Driven Segmentation
Once you trust the data:
- Promote label‑driven groups (e.g., Stars) into your main Shopping and PMax campaigns.
- Use labels to **exclude chronic Drainers** or move them into low‑priority campaigns with stricter targets.
- Document your label meanings and keep a change log, as recommended in Product Metrics’ campaign‑structure guide. (Source: [Product Metrics – Google Shopping and PMax campaign structure by profit](https://www.productmetrics.io/blog/product-segmentation-google-shopping-pmax))
### Step 5 - Standardize Your Review Rhythm
Whether you choose Product Metrics or another platform, adopt a fixed rhythm for reviewing segmented performance:
- **Daily:** eligibility, tracking health, obvious anomalies
- **Weekly:** label coverage and product membership by segment
- **Mature window (e.g., monthly):** contribution, POAS, volume by segment vs hypotheses
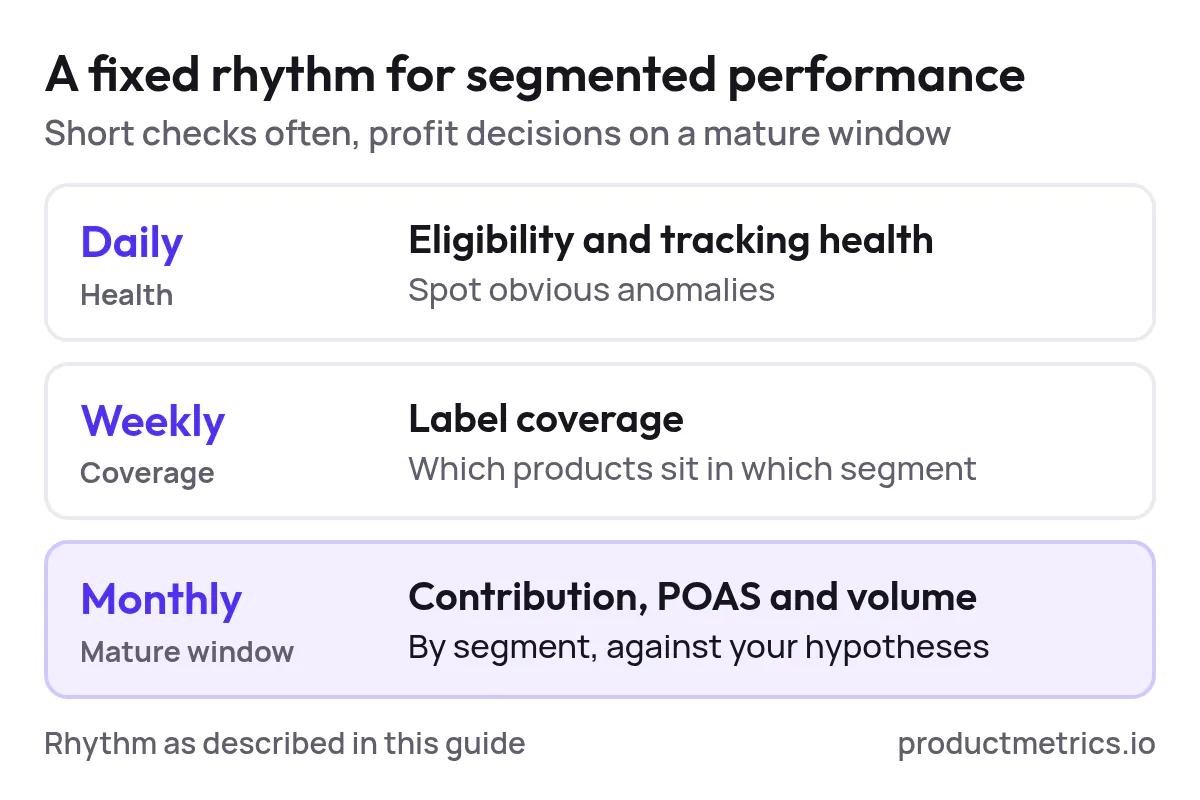
_Check health daily and label coverage weekly; judge contribution and POAS only once conversions have matured._
This is how you turn granular performance tracking into predictable, defensible campaign decisions.
## 8. Next Steps With Product Metrics
If you’ve reached this point and you’re actively comparing **top‑rated Google Shopping optimization tools for granular campaign segmentation and tracking**, Product Metrics is almost certainly on your shortlist.
Here’s how to move forward:
1. **Scan the Product Metrics product page** to confirm modules and integrations match your stack. (Source: [Product Metrics – Product-Level Google Shopping Optimisation](https://www.productmetrics.io/))
2. **Start a free analysis** of your products by connecting your Google account and store (no credit card required for the initial analysis). (Source: [Product Metrics – Ecommerce analytics platforms](https://www.productmetrics.io/blog/ecommerce-analytics-platform))
3. **Book a demo** with your PPC lead, ecommerce manager, and someone from finance so everyone aligns on margin definitions and decision rules.
4. **Pilot label‑driven segmentation** on a contained part of your catalog, using the method outlined in Product Metrics’ guide to Shopping and PMax structure by profit. (Source: [Product Metrics – Google Shopping and PMax campaign structure by profit](https://www.productmetrics.io/blog/product-segmentation-google-shopping-pmax))
With that, you’ll move from “interesting dashboards” to a **repeatable system**: one that segments every SKU by potential and profitability, writes that into Merchant Center, and lets your Google Shopping and PMax campaigns act on it automatically.
That’s what granular performance tracking and campaign segmentation software for Google Shopping is *supposed* to do — and what you should demand from whichever platform you buy.
## Keep reading.
- [Campaign Segmentation in Google Shopping - Principles, Pitfalls, and Governance](https://www.productmetrics.io/blog/campaign-segmentation-google-shopping)
- [The Google Shopping Segmentation Playbook For 2026 Frameworks Labels And Structures](https://www.productmetrics.io/blog/google-shopping-segmentation-playbook)
- [Implementing Profit Segmentation In Google Shopping And Performance Max](https://www.productmetrics.io/blog/implement-profit-segmentation-shopping-pmax)
---
Written by Berend Vrakking, founder of Product Metrics. Last updated 2026-11-01.
1M+ products analysed · Nominated at the Dutch Search Awards for Best Measurement Campaign (2023) and Best Use of Data (2024)
HTML version: https://www.productmetrics.io/blog/google-shopping-segmentation-tracking-software