Product Metrics - AI Product Segmentation for Google Ads

AI Product Segmentation for Google Ads

Free Break‑Even ROAS Calculator for Ecommerce & Google Ads

Enter your revenue, VAT rate, ad spend, product margin, return rate, shipping costs, and payment processing fees below.

The calculator instantly shows your ROAS, break-even ROAS, net profit, total variable costs, and contribution margin,, so you know the minimum ROAS needed to run profitable ads.

Recommendation

If you advertise with Shopping or Performance Max, connect margin, returns, stock levels, and price competitiveness labels to your product data or feed, and define ROAS floors per product segment.

Product Metrics automatically segments products using AI-driven algorithms, calculates break-even ROAS thresholds, and synchronizes labels to your feed.

This prevents blended campaign ROAS from hiding underperforming products.

Use your break-even ROAS as a benchmark to continuously fine-tune bids, budgets, and campaign strategy.

Recommendation

If you advertise with Shopping or Performance Max, connect margin, returns, stock levels, and price competitiveness labels to your product data or feed, and define ROAS floors per product segment.


Product Metrics automatically segments products using AI-driven algorithms, calculates break-even ROAS thresholds, and synchronizes labels to your feed.


This prevents blended campaign ROAS from hiding underperforming products.

Use your break-even ROAS as a benchmark to continuously fine-tune bids, budgets, and campaign strategy.

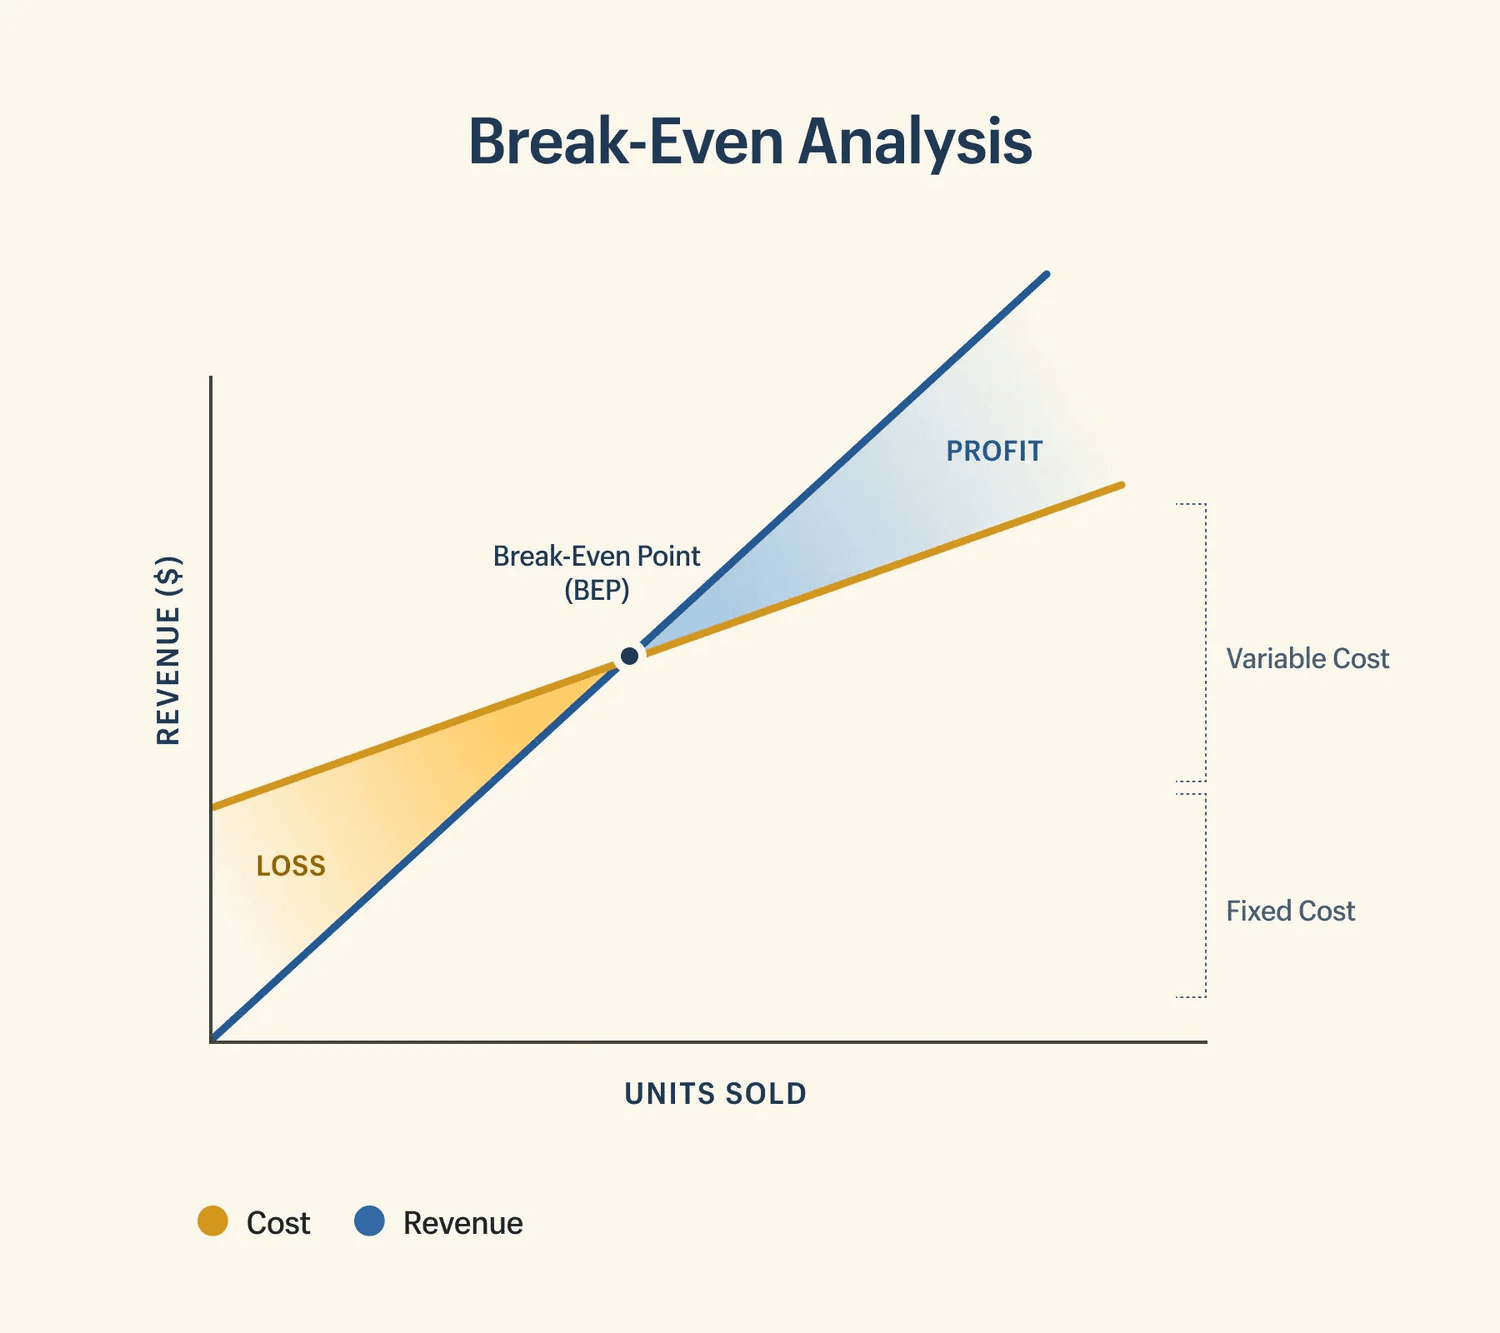
What is break‑even ROAS?
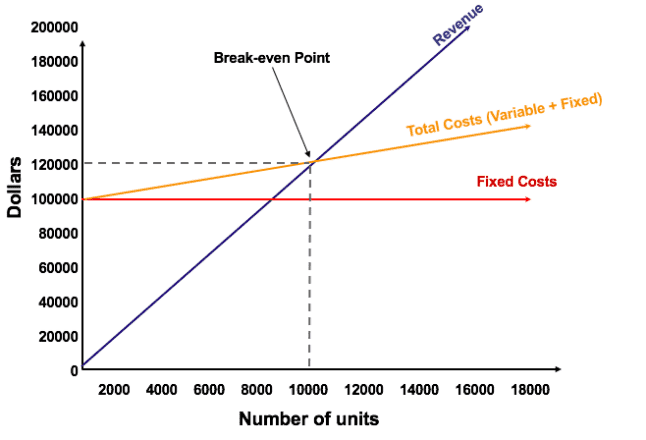
Break-even Return on Ad Spend (ROAS) is the minimum ROAS needed for the contribution margin from ad-driven sales to cover the ad spend (i.e., profit = 0 before fixed overhead).

Above this threshold, ads generate profit; below it, you lose money.

Use break-even ROAS as a floor, not a target. Set working targets above the floor to cover noise, attribution lag, and cost volatility.

The simplest way to think about break-even ROAS:

  • Break-even ROAS = 1 ÷ Gross Margin %

  • Where Gross Margin % = (Revenue (VAT-exclusive) − Cost of Goods Sold and variable fulfillment costs) ÷ Revenue (VAT-exclusive)

This formula assumes “Total costs” include all variable costs tied to the order (COGS, shipping, payment fees, packaging, pick/pack, and per-order variable overhead).

Break-even Return on Ad Spend (ROAS) is the minimum ROAS needed for the contribution margin from ad-driven sales to cover the ad spend (i.e., profit = 0 before fixed overhead).


Above this threshold, ads generate profit; below it, you lose money.


Use break-even ROAS as a floor, not a target. Set working targets above the floor to cover noise, attribution lag, and cost volatility.


The simplest way to think about break-even ROAS:

  • Break-even ROAS = 1 ÷ Gross Margin %

  • Where Gross Margin % = (Revenue (VAT-exclusive) − Cost of Goods Sold and variable fulfillment costs) ÷ Revenue (VAT-exclusive)


This formula assumes “Total costs” include all variable costs tied to the order (COGS, shipping, payment fees, packaging, pick/pack, and per-order variable overhead).


Exclude fixed costs like rent or salaries when calculating the break-even point for ROAS targets.

Exclude fixed costs like rent or salaries when calculating the break-even point for ROAS targets.

Break-even Return on Ad Spend (ROAS) is the minimum ROAS needed for the contribution margin from ad-driven sales to cover the ad spend (i.e., profit = 0 before fixed overhead).


Above this threshold, ads generate profit; below it, you lose money.


Use break-even ROAS as a floor, not a target. Set working targets above the floor to cover noise, attribution lag, and cost volatility.


The simplest way to think about break-even ROAS:

  • Break-even ROAS = 1 ÷ Gross Margin %

  • Where Gross Margin % = (Revenue (VAT-exclusive) − Cost of Goods Sold and variable fulfillment costs) ÷ Revenue (VAT-exclusive)


This formula assumes “Total costs” include all variable costs tied to the order (COGS, shipping, payment fees, packaging, pick/pack, and per-order variable overhead).


Exclude fixed costs like rent or salaries when calculating the break-even point for ROAS targets.

Side note

Contribution margin covers variable costs only. Net margin subtracts fixed overhead too. Break‑even ROAS uses contribution margin to set ad guardrails.

How to calculate ROAS break‑even point (with example)

Example you can copy:

  • AOV (VAT‑exclusive): $100

  • COGS: $45

  • Shipping subsidy: $5

  • Payment fees: 3% of revenue = $3

  • Pick/pack/packaging: $2

Calculation:

  • Gross margin dollars = $100 − ($45 + $5 + $3 + $2) = $45

  • Gross margin % = $45 ÷ $100 = 45%

  • Break‑even ROAS = 1 ÷ 0.45 ≈ 2.22

Example you can copy:

  • AOV (VAT‑exclusive): $100

  • COGS: $45

  • Shipping subsidy: $5

  • Payment fees: 3% of revenue = $3

  • Pick/pack/packaging: $2


Calculation:

  • Gross margin dollars = $100 − ($45 + $5 + $3 + $2) = $45

  • Gross margin % = $45 ÷ $100 = 45%

  • Break‑even ROAS = 1 ÷ 0.45 ≈ 2.22

Meaning:

at ROAS 2.22 (Break-even Point), your ad‑attributed revenue just covers your ad spend and variable costs. Above 2.22, you contribute profit before fixed overhead.

Why break‑even ROAS matters

Break-even ROAS gives you:

  • ROAS guardrail

    • a "do-not-cross" threshold that protects contribution margin

  • Bidding logic

    • set tROAS/tCPA or manual bids with clear margin justification

  • Scaling confidence

    • if observed ROAS ≥ break-even ROAS, you can profitably scale (subject to LTV)

  • Budget allocation

    • quickly spot underperforming campaigns and shift spend to products, keywords, or audiences that meet your margin threshold

  • Strategic clarity

    • decide when to scale, test new channels, or adjust pricing backed by ROAS targets tied to actual margins

Factors that shift your true break‑even

Returns and refunds

  • Adjust revenue for expected returns or add reverse‑logistics costs to variable costs.

  • Model return rates by category/SKU, not account‑wide averages.

Taxes/VAT/GST

  • Exclude VAT/GST from revenue and apply costs on the same VAT‑exclusive basis.

    • Align accounting data so revenue and costs use the same tax basis.

Payment mix

  • Fees differ by method (e.g., BNPL, AmEx).

    • Weight fees by payment‑method share to get an accurate blended rate.

Marketplaces and platforms

  • Referral/FBA fees and higher return rates change unit economics.

    • Include marketplace fees and expected returns in "variable costs."

Use break‑even ROAS in Google Ads (Shopping / PMAX)

Turn a single break‑even number into account structure and bid targets.

Enrich Products with Business Intelligence

Add margin, returns, stock, price position, and cost signals to your product data.

Enrich each product with key business attributes such as profit margin, average return rate, payment and shipping cost profiles, stock availability, and price competitiveness.

Product Score configuration screen in Product Metrics showing adjustable metric weights for price competitiveness, profit margin, delivery speed, return rate, and inventory level, with live score preview panel.

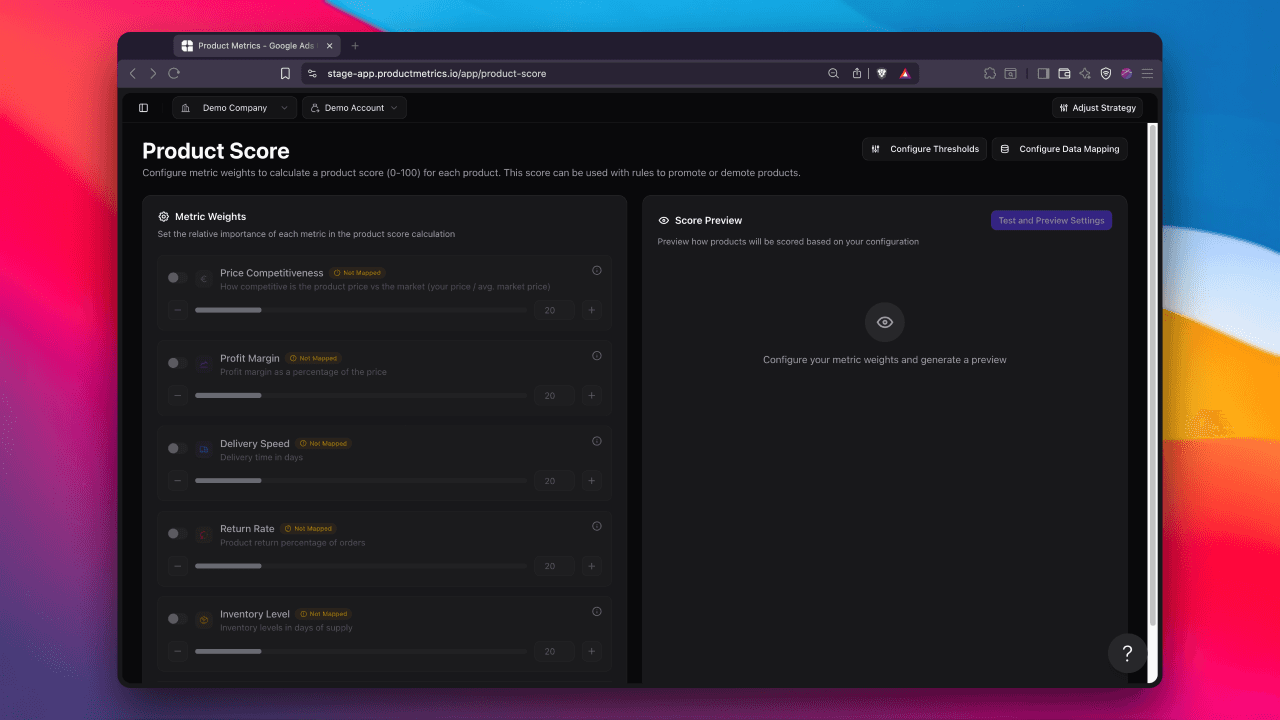
Including these signals directly in your product feed or data sources enables more informed segmentation, bidding, and optimization decisions through the use of an product score.

Segment products by performance

Group products by efficiency, volume, and profitability for instant visibility into what’s performing well.

From there, shift budget toward top performers and pull back on underperformers, maximizing return per ad dollar.

Product Metrics uses AI to handle product segmentation automatically, sorting your products into five product segments:
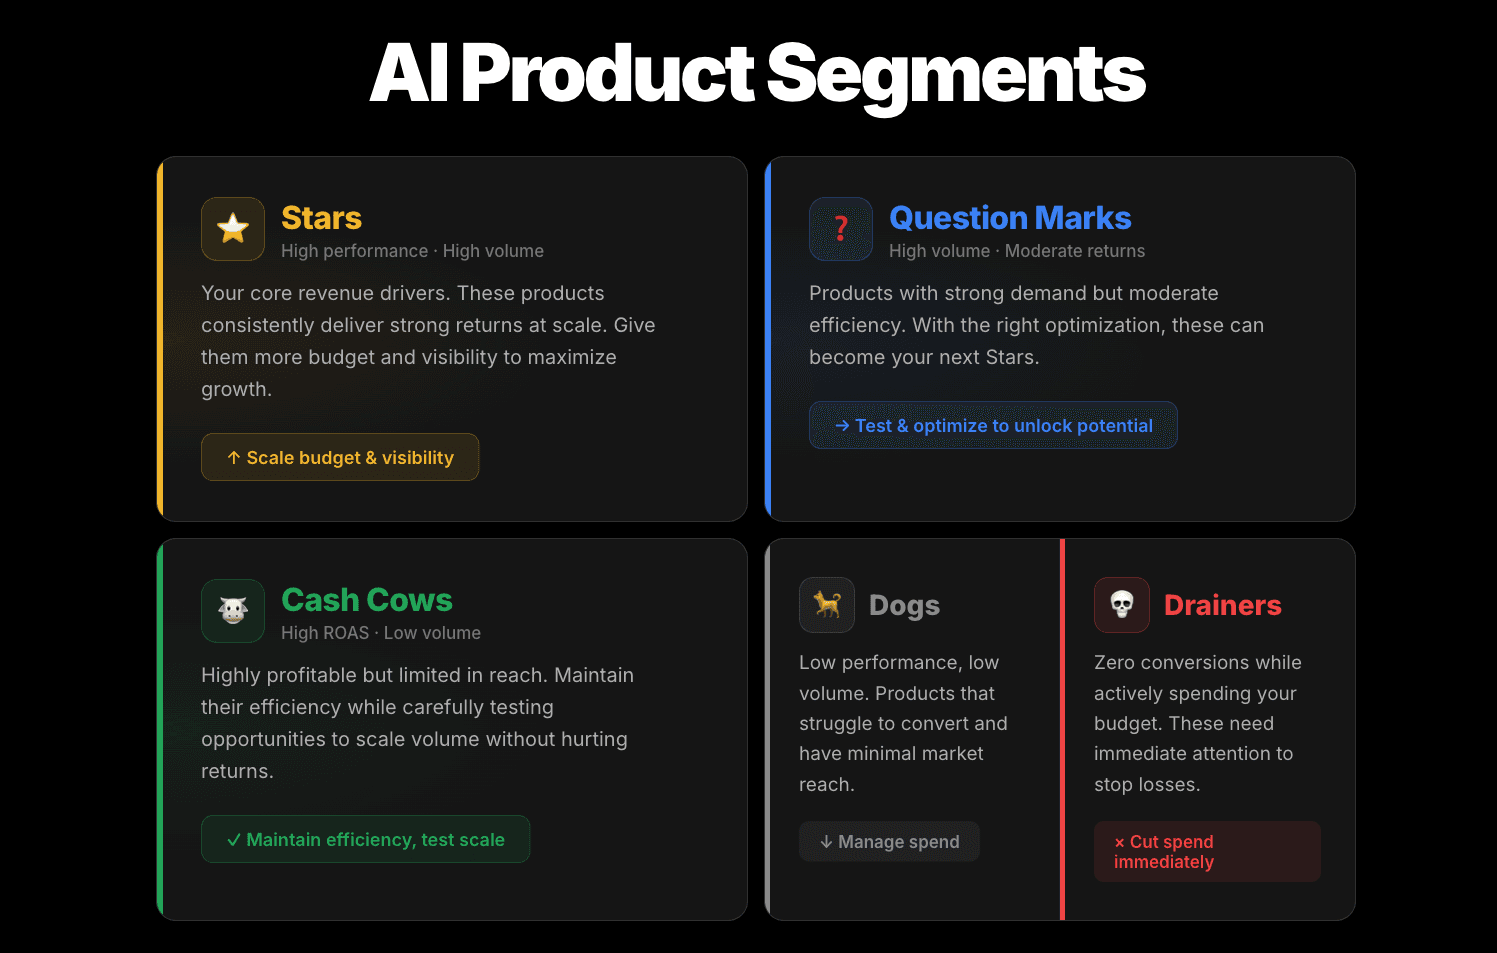
AI product segments overview showing Stars, Question Marks, Cash Cows, Dogs and Drainers within a Google Ads PMax labelizer product segmentation strategy interface

Breakdown:

  1. Stars

    1. High Volume, High ROAS

  2. Cash Cows

    1. Low Volume, High ROAS

  3. Question Marks

    1. High Volume, Medium ROAS

  4. Dogs

    1. Medium Volume, Low ROAS

  5. Drainers

    1. Low Volume, Low ROAS

Design the Campaign Structure

Align campaign architecture with product segments and business priorities.

Build campaigns or asset groups per segment. Use inventory/listing group filters to isolate segments so budgets and targets don't blend.

Set Targets by Strategy

Apply bidding and ROAS targets based on each segment's role in the overall strategy.

Set tROAS at break‑even +10–20%:

  • High‑margin example: floor 2.2 → tROAS 2.5–2.7

  • Mid‑margin example: floor 3.3 → tROAS 3.6–4.0

  • Low‑margin example: floor 5.0 → tROAS 5.5–6.0

Monitor and iterate:

Watch 7‑day lag‑adjusted contribution by segment weekly.

Improve Google Shopping ROAS with 25%

Improve Google Shopping ROAS with 25%

Improve Google Shopping ROAS with 25%

Use Product Metrics Labelizer to automatically categorize your products and create custom labels that enhance your campaign targeting and performance.

No Creditcard required