 Log in with Google
Dead stock inventory: how to find it and clear it
Dead stock is inventory that has stopped selling. See when stock counts as dead, what it costs to hold and what to do per product, with a worked example.
Dead stock (also called dead inventory, and often obsolete inventory) is stock that has stopped selling and is unlikely to sell at full price again. Below: how to find it, price it and clear it, with four example products you can check by hand.
It is not about “deadstock” in fashion, where the word means unused fabric, unsold garments or never-worn vintage and sneakers. It is not about shares either.
1. What counts as dead stock?
Dead stock is stock that no longer sells at the normal price. The neighbouring terms differ mainly in whether it still sells at all.
- Slow-moving (still sells, slowly): cover is far above your other products. See slow-moving inventory.
- Excess (still sells): a salvageable surplus, which Ryder calls an opportunity rather than a liability.
- Dead stock (no longer sells): no sale for a period you set.
- Obsolete (no longer sells): end of its life, with no buyer. Salsify uses it as a synonym for dead stock; Flowspace says obsolete stock can become dead stock, but not all dead stock is obsolete.
Lightspeed draws the practical line: slow-moving stock “still has a chance to sell”, while obsolete inventory “is unsellable”. From here on, dead stock means stock that has stopped selling at your normal price.
2. When does stock count as dead?
Nobody agrees on the line. Six public guides draw it between three and twelve months without a sale, so you have to set your own.
After how many months without a sale public guides call stock dead
- Shortest cut-off (months without a sale)
- Longest cut-off (months without a sale)
Show the dataHide the data
| Published guide | Shortest cut-off (months without a sale) | Longest cut-off (months without a sale) |
|---|---|---|
| Lightspeed | 3 | 3 |
| Cleverence, retail | 3 | 6 |
| Cleverence, industrial and seasonal | 6 | 12 |
| Alexander Jarvis | 6 | 6 |
| DOSS | 6 | 12 |
| Fidelitone | 6 | 12 |
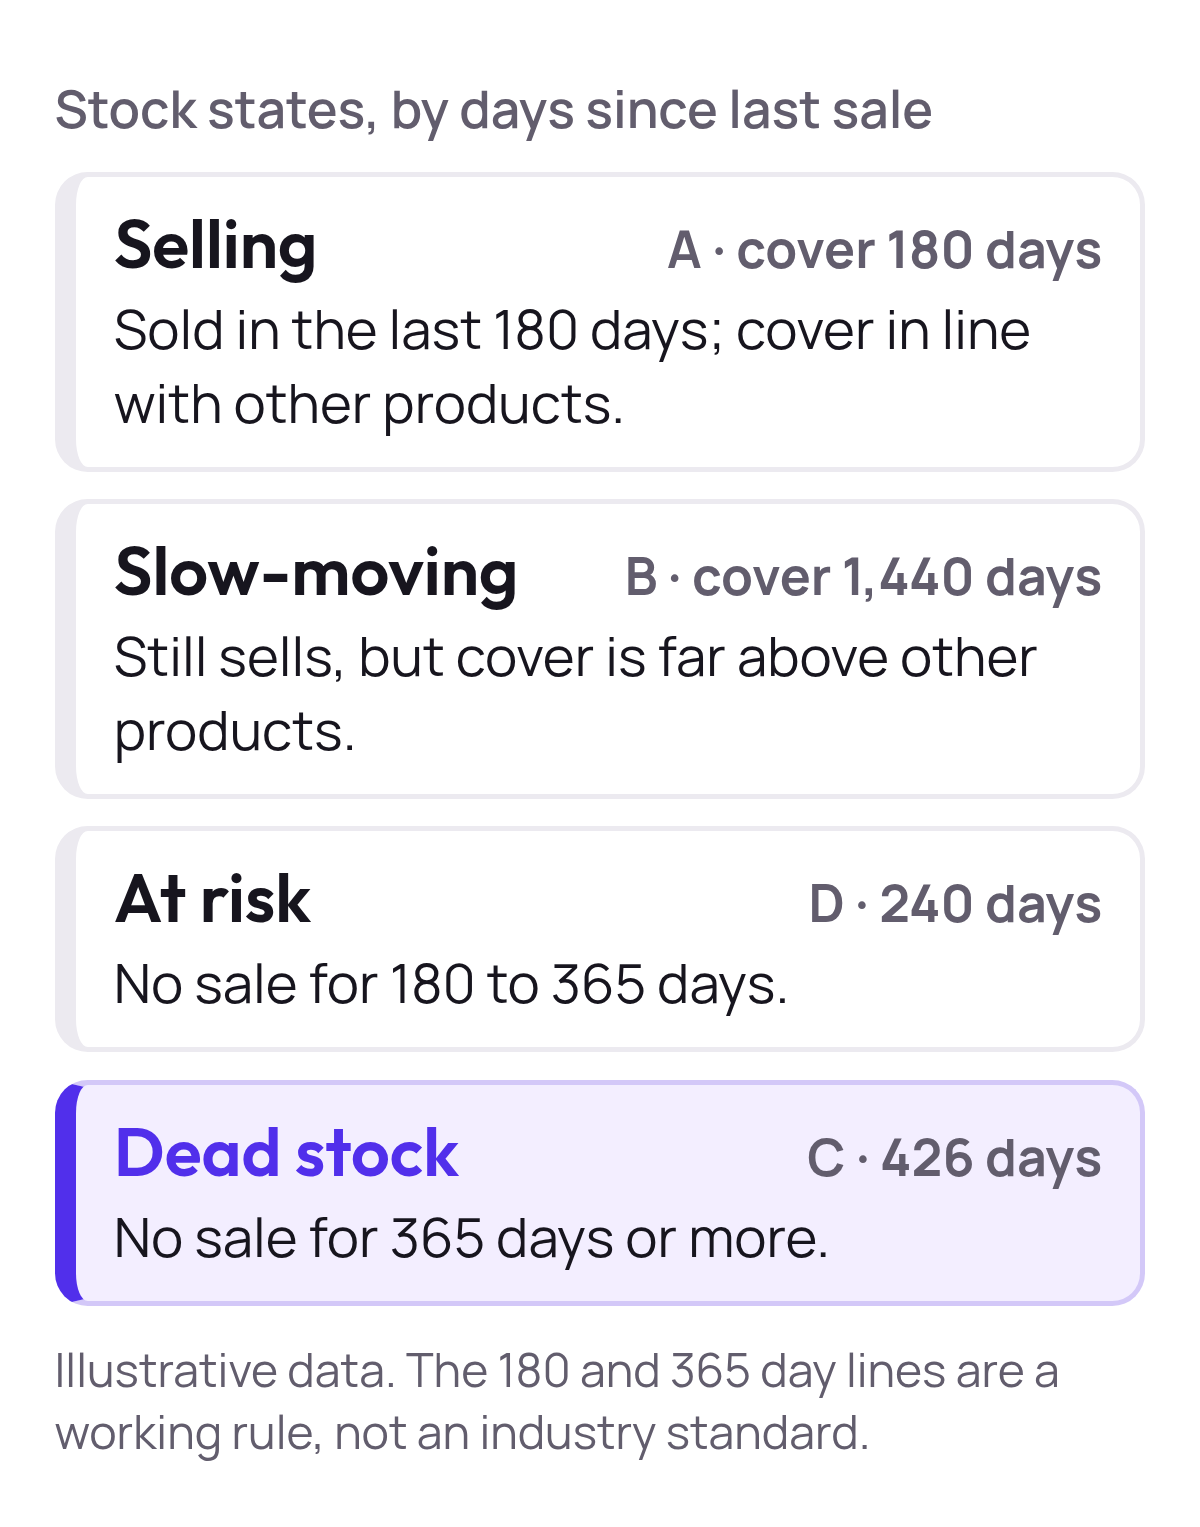
This guide uses two lines: at risk after 180 days without a sale, and dead after 365. Both sit inside the guides’ ranges. DOSS says most industries treat six to twelve months unsold as dead stock, and Fidelitone says no movement in six months signals risk while roughly a year marks non-seasonal stock as dead.
Count from the later of the last sale and the day the stock arrived, so a new product is never dead. Move the lines per category: Fidelitone notes seasonal stock can be dead within weeks of missing its selling window, so judge it against its season, not the calendar.
3. Find it by valuing every product at cost
For each product, take units on hand × unit cost and the days since its last sale. Cover, units on hand ÷ units sold per day, separates slow-moving from selling: see days of inventory.
| Product | Units × unit cost | Value at cost | Sold in 90 days | Last sale | Status |
|---|---|---|---|---|---|
| A | 120 × €22.50 | €2,700.00 | 60 | 2 days ago | Selling |
| B | 80 × €15.00 | €1,200.00 | 5 | 12 days ago | Slow-moving |
| C | 45 × €30.00 | €1,350.00 | 0 | 426 days ago | Dead |
| D | 75 × €10.00 | €750.00 | 0 | 240 days ago | At risk |
Illustrative data.
Total stock is €6,000.00. Cover is units on hand ÷ units sold per day: A has 120 ÷ (60 ÷ 90) = 180 days and B has 80 ÷ (5 ÷ 90) = 1,440 days. B holds €1,200.00, yet it is not dead because it still sells.
Days since each of four example products last sold
- Days since last sale
- Dead stock cut-off (days) (365)
Show the dataHide the data
| Product | Days since last sale |
|---|---|
| A, selling | 2 |
| B, slow-moving | 12 |
| C | 426 |
| D | 240 |
Of the €6,000.00, €3,900.00 (65%) sold in the last 90 days. Products C and D hold €2,100.00, which is 35%. Cleverence lists the percentage of inventory value older than 180 days as a figure to track. I’d track it monthly, next to total stock value.
Stock value at cost (€), grouped by days since last sale
Show the dataHide the data
| Days since last sale | Stock value at cost |
|---|---|
| 0 to 90 days | €3,900.00 |
| 91 to 180 days | €0.00 |
| 181 to 365 days | €750.00 |
| Over 365 days | €1,350.00 |
Guides value dead stock in two ways. Flowspace counts what you spent on it, including purchase price, shipping, handling and storage, while Sage multiplies the units by the price they would have sold for (100 × $7 = $700). This guide values stock at cost, and the write-down below uses what it can still fetch.
4. How much dead stock is normal?
None of the guides checked gives an ecommerce benchmark, so use your own share as the benchmark and watch it fall. The only survey with a spread of answers is from Phocas: 46% of 100+ wholesale distributors reported 2 to 10% dead stock.
How much dead stock wholesale distributors report (% of distributors)
Show the dataHide the data
| Dead stock as a share of inventory | Share of distributors |
|---|---|
| None | 1% |
| Under 2% | 19% |
| 2 to 5% | 20% |
| 6 to 10% | 26% |
| 11 to 15% | 9% |
| Over 20% | 3% |
| Don't know | 22% |
Sage says to aim for an annual average of 5 to 10% without citing a source for that range, and other guides quote shares up to 30% with none. The definitions differ, so compare nothing until you count the same way every month: stock value with no sale for 180 days or more, divided by total stock value. In the example, C alone is 22.5% and C with D is 35%.
5. The cost of holding it
Holding cost per year = stock value at cost × carrying cost rate. The rate covers warehouse space and handling, insurance, and the capital that could have gone to faster-selling products, according to Cleverence.
Cleverence says many teams use a rule of thumb of 20 to 30 percent a year, though your own rate may vary. This guide assumes 25% as an input, not a benchmark. Build your own from what you pay: interest on the money tied up, storage per unit and insurance.
At 25%, product C costs 25% × €1,350.00 = €337.50 a year to keep and product D costs €187.50. Together that is €525.00 a year, or €131.25 a quarter.
Cumulative cost (€) of holding the dead and at-risk products C and D
Show the dataHide the data
| Time held | Cumulative holding cost |
|---|---|
| 3 months | €131.25 |
| 6 months | €262.50 |
| 9 months | €393.75 |
| 12 months | €525.00 |
Every quarter spent deciding adds another €131.25 in the example. If demand will not return, a sale at any price above zero net beats holding the unit another year.
6. Dead stock can still eat your ad budget
A product can keep winning paid clicks while it sells nothing, and every click is paid for.
For the last 90 days, assume every sale came from the ads. Contribution profit per unit is the price excl. VAT minus unit cost minus €6.00 of order costs (shipping, packing, payment fees), so A earns €45.00 − €22.50 − €6.00 = €16.50 a unit. POAS is contribution profit ÷ ad spend, and 1.0 is break-even: see POAS vs ROAS.
| Product | Clicks × CPC = ad spend | Units sold | Contribution profit | POAS |
|---|---|---|---|---|
| A | 1,500 × €0.40 = €600.00 | 60 | 60 × €16.50 = €990.00 | 1.65 |
| B | 500 × €0.50 = €250.00 | 5 | 5 × €9.00 = €45.00 | 0.18 |
| C | 900 × €0.45 = €405.00 | 0 | €0.00 | 0.00 |
| D | 400 × €0.30 = €120.00 | 0 | €0.00 | 0.00 |
Prices excl. VAT are €45.00 (A), €30.00 (B), €50.00 (C) and €20.00 (D).
POAS of each product over the last 90 days
- POAS (contribution profit ÷ ad spend)
- Break-even POAS (1.00)
- Profit
- Loss
Show the dataHide the data
| Product | POAS (contribution profit ÷ ad spend) |
|---|---|
| A | 1.65 |
| B | 0.18 |
| C | 0.00 |
| D | 0.00 |
Products C and D took €525.00 of the €1,375.00 spend, 38.2%, and returned nothing. At its current rate, C’s clicks cost 4 × €405.00 = €1,620.00 a year, 4.8 times its €337.50 holding cost. The break-even ROAS calculator gives the floor for any product.
Google’s help pages say custom labels let you “subdivide products in your campaign based on criteria you define”, and Merchant Center names clearance as an example. Put dead stock behind a label such as clearance and give that group lower priority. Labels can take up to 24 to 48 hours to appear in Google Ads. More on the feed side in optimise Google Shopping ads.
7. Find out why it stopped selling
Before you lower spend, find the cause, because the exits differ. A product nobody sees needs exposure, while one many click but few buy needs less spend. Product C is the second kind.
| Cause | Signal | Usual exit |
|---|---|---|
| The season ended | Sales and impressions cluster in one quarter | Hold with a review date |
| A newer model replaced it | Sales fell after the successor launched | Discount, bundle or sell in bulk |
| You bought too much | Cover at purchase was far above demand | Stop reordering, then discount |
| Nobody sees it | Few or no impressions, or not approved in the feed | Fix visibility first |
| Seen but not bought | Many clicks, no sales, a price above comparable products | Lower its priority, then compare its price with competitors |
8. What should you do with dead stock?
Pick the exit that nets the most per unit by your deadline. Net per unit = selling price − order costs − ad cost per sale. Compare it with holding: cost × carrying rate for every year you wait. To see the margin a clearance price leaves, enter the cost and the new price in the margin calculator.
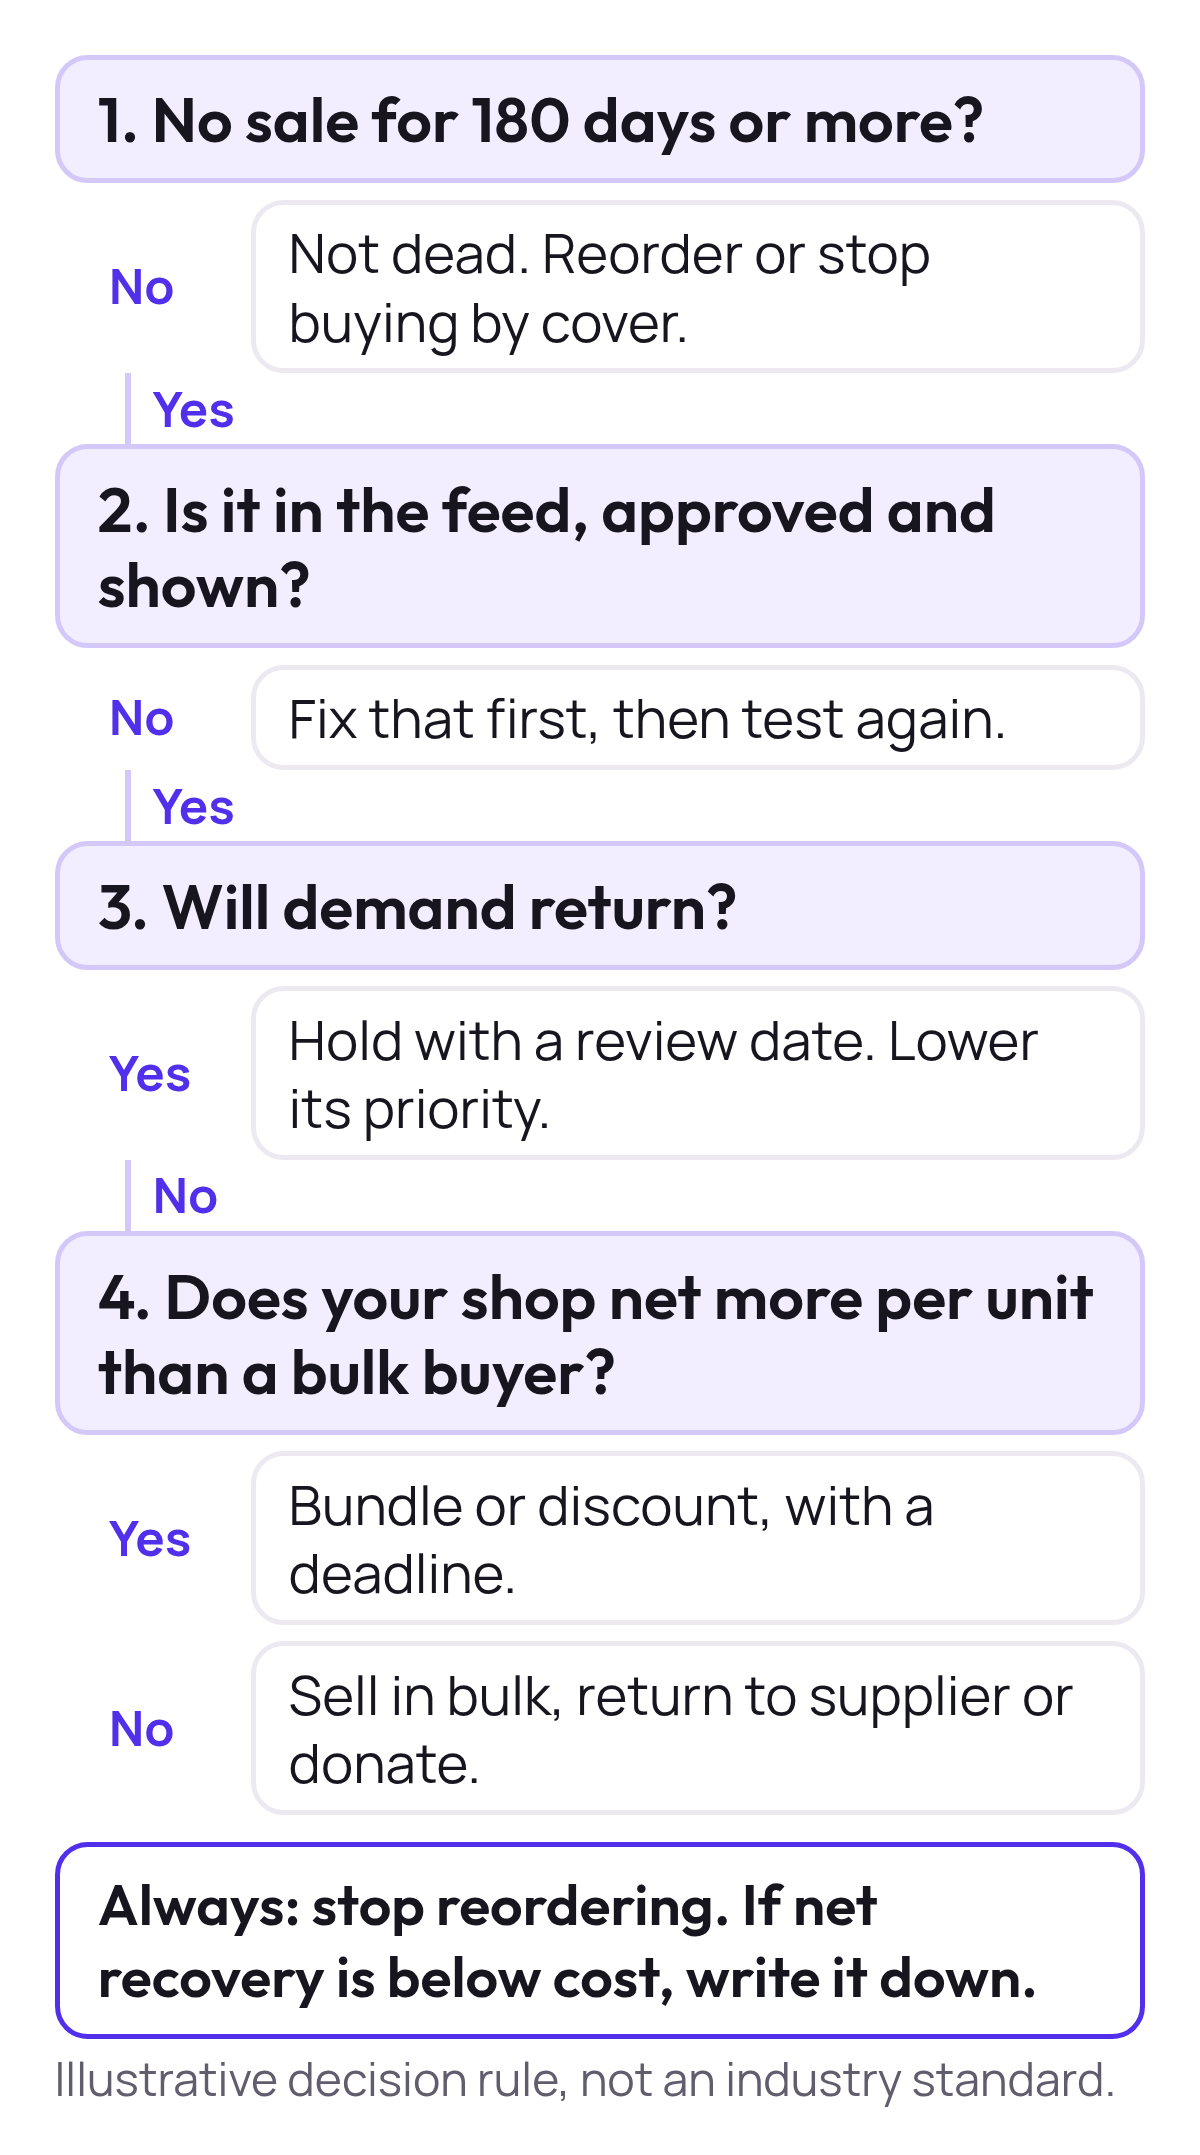
Take product C: 45 units, €30.00 cost, €50.00 regular price. Clearing at €30.00 nets €30.00 − €6.00 = €24.00 a unit, €1,080.00 in total, if all 45 sell. At €22.00 it nets €16.00 (€720.00). A bulk buyer paying an assumed €8.00 with no order costs nets €8.00 (€360.00).
Cash each exit recovers per unit of product C (€), against its €30.00 cost
- Net cash per unit
- What each unit cost (€30.00)
Show the dataHide the data
| Exit route and price | Net cash per unit |
|---|---|
| Clear at €30.00 | €24.00 |
| Clear at €22.00 | €16.00 |
| Bulk sale at €8.00 | €8.00 |
The ad cost per clearance sale has a ceiling. At €22.00 the shop nets €16.00 before ads and the bulk buyer €8.00, so you can pay at most €16.00 − €8.00 = €8.00 in ads per sale before bulk is the better exit.
Holding C costs 25% × €30.00 = €7.50 a unit a year and recovers nothing, so hold only if you expect demand to return.
- A (selling): reorder from cover and lead time: see reorder point and lead time.
- B (slow-moving): stop buying. Its POAS of 0.18 says to lower its priority; try a bundle with A.
- C (dead): clear at €22.00 with a deadline, then sell what is left in bulk. Lower its priority outside the clearance group.
- D (at risk): check it is visible and when its season is. Review at 365 days, and lower its priority meanwhile.
9. Can you write dead stock down or off?
Write down stock whose net recovery is below its cost. IAS 2 says inventories are measured “at the lower of cost and net realisable value”, which is the estimated selling price less the estimated costs necessary to make the sale.
For product C: €22.00 − €6.00 = €16.00 net realisable value against €30.00 cost. The write-down is €14.00 × 45 = €630.00, and the carrying amount falls from €1,350.00 to €720.00.
Tax is a separate question. In the US, IRS Publication 538 (January 2022) says goods that cannot be sold should be valued “at their bona fide selling price minus direct cost of disposition”, the same logic as net realisable value.
10. The five-step check
- Export stock and salesPer product: units on hand, unit cost, date of the last sale, date the stock arrived and units sold in the last 90 days.
- Set your linesAt risk after 180 days without a sale and dead after 365, or your own lines per category. Count from the later of last sale and goods received.
- Value what is past the linesUnits on hand × unit cost for each product, then the total as a share of all stock value.
- Check visibility and ad spendIs each product in the feed, approved and getting impressions? What did it spend in the last 90 days, and what is its POAS?
- Choose an exit and a deadlinePer product: hold with a review date, bundle or discount, sell in bulk, or write down to net realisable value. Then stop reordering.
Do it per category if your lines differ. A spreadsheet is enough for a few hundred products.
11. Where Product Metrics fits
Inventory Insights shows each slow product with the reason it is slow, from exposure, product age, seasonality, stock quantity and value, and expected demand. A product nobody sees needs exposure; one everyone clicks but few buy needs less spend. Product C is the second kind.
Stock cover also feeds Product Score and lands in Merchant Center as a custom label: see Product Segmentation. On the Inventory Insights page, a fleece crew with 1,520 units, 38 weeks of cover, 2,960 clicks and a POAS of 0.80 against 2.00 goes from medium to low priority, to free the capital instead of buying more clicks. You decide; Product Metrics never acts for you.
Sources
- DOSS, Dead Stock: How to Identify, Prevent, and Liquidate, 1 April 2026.
- Lightspeed, What Is Obsolete Inventory?, 17 December 2025.
- Cleverence, What is dead inventory? and Dead inventory: causes, costs and how to fix it.
- Alexander Jarvis, Inventory aging in ecommerce.
- Fidelitone, What is dead stock?, updated 6 March 2026.
- Phocas, What is dead stock and how to eliminate it: survey of 100+ wholesale distributors.
- Sage, What is dead stock inventory and how do you avoid it?, updated 9 July 2026.
- Flowspace, Dead stock, updated 7 May 2026.
- ChannelEngine, Strategies to reduce dead stock.
- IRS, Publication 538, January 2022.
- Ryder, Dead stock: what it means and how to prevent it.
- Salsify, Obsolete inventory.
- Glossy, Why deadstock isn’t the redheaded stepchild of fashion anymore, 3 April 2017: fashion deadstock is “unused fabric that accumulates in the corners of factories and unsold products”.
- IFRS Foundation, IAS 2 Inventories.
- Google Ads Help, Use custom labels for Shopping ads, and Google Merchant Center Help, Custom label 0–4 and Sale price.
Start with one export
Export your products with their last sale dates and total the value older than 180 days. That one share tells you whether dead stock is worth a week of work.
Keep reading.
Demand Gen vs Performance Max for ecommerce
Demand Gen vs Performance Max by product: which products each campaign type should carry, and how to read each against its own break-even ROAS.
Google Shopping management: the four jobs and who does them
Google Shopping management is four jobs: product data, campaigns, products and measurement. See who does each job and how to check every product.
How to improve ROAS: fix products, not the ratio
Improving ROAS only counts when performance and profitability improve. Work per product against break-even, then measure profit directly with POAS.
Frequently asked questions.
What is dead stock in ecommerce?
What is the difference between dead stock, slow-moving and obsolete inventory?
How long until stock is dead?
What should you do with dead stock?
How much dead stock is normal?
Can obsolete inventory be written off?
Can you deduct dead stock on your tax return?
Can I still advertise dead stock?
See which of your products to push, fix or pause. Start with your own products, or a 30-second estimate.
Check one product first: work out its break-even ROAS in the calculator. Then see where all your products stand.
Not ready to connect? Book a demo: a video call with Berend, then a demo account.