 Log in with Google
How to optimise Google Shopping ads
Optimise Google Shopping ads in two layers: fix the feed with Google's own attribute rules, then review each product against its break-even. Worked example.
How do you optimise Google Shopping ads, campaigns and the feed?
To optimise Google Shopping ads, fix the feed first (titles, images, price and availability, identifiers), then segment your products by ad clicks and return and act on each one against its own break-even ROAS. A clean feed only gets your products shown; the product-level decisions decide which of them earn their ad spend.
There are six steps, and they apply to Standard Shopping and Performance Max alike. The feed comes first, using Google’s own attribute rules. The product-level decisions follow, with a review table you can copy into a spreadsheet and a break-even ROAS calculator for the arithmetic. For how this fits into running the whole account, see Google Shopping ads, managed product by product.
Last reviewed 7 October 2026.
1. How do you optimise a Google Shopping feed?
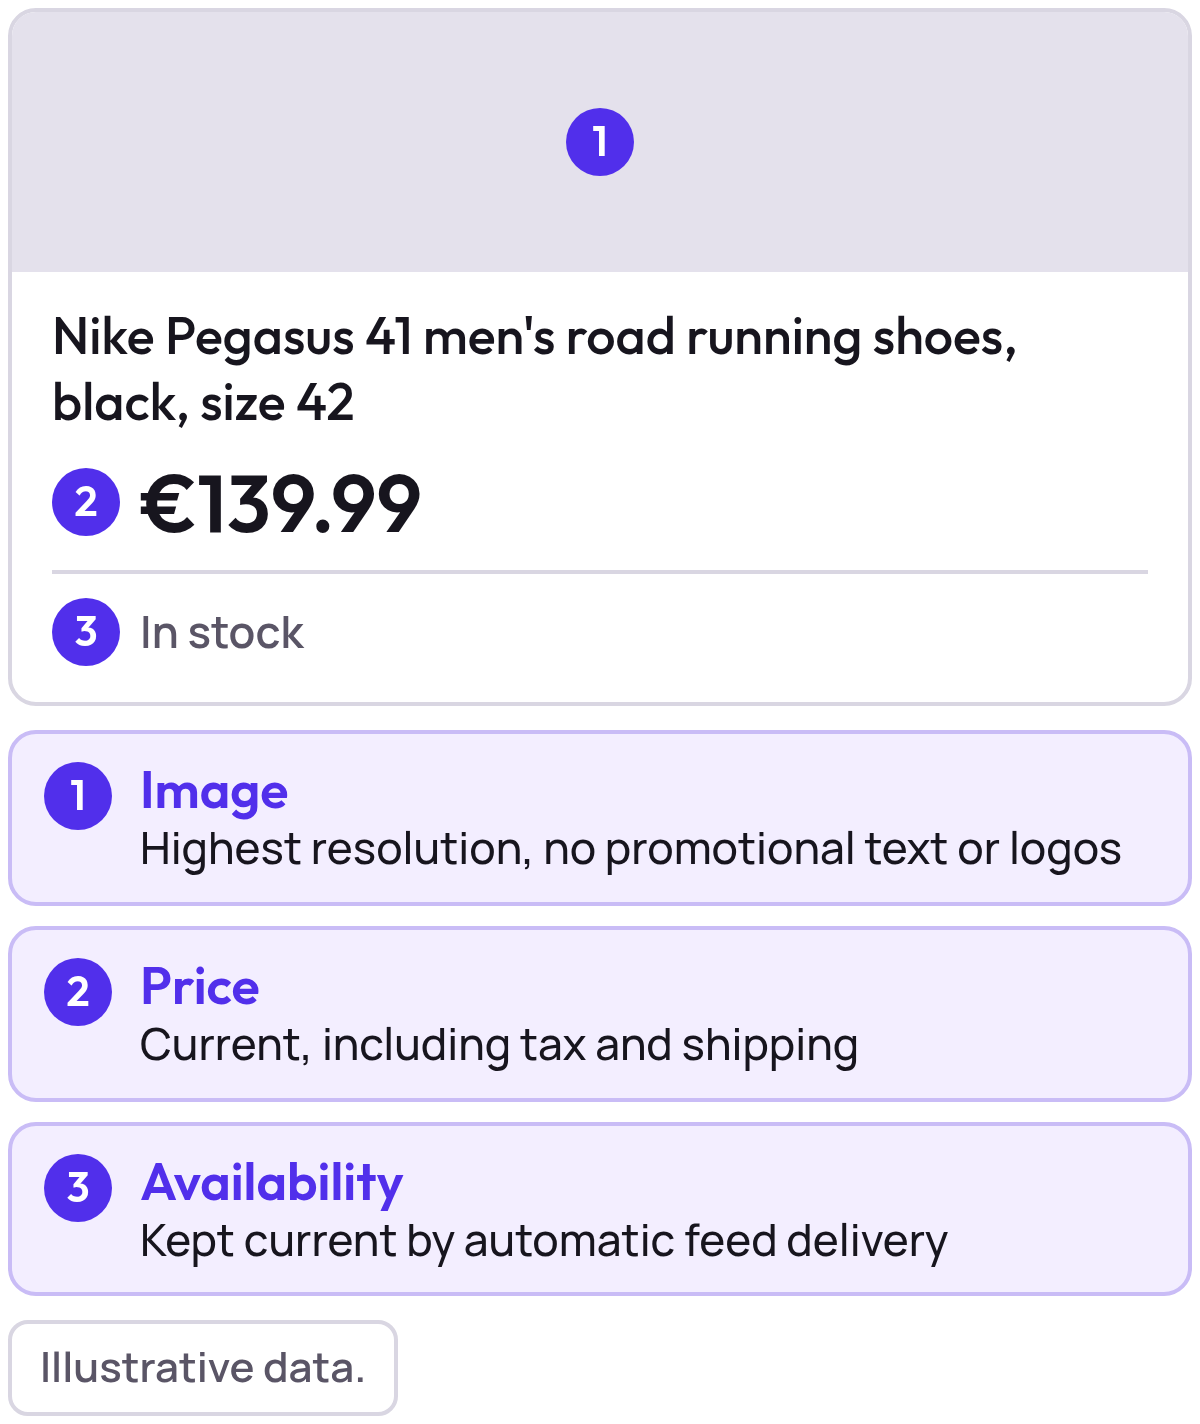
Start with the attributes Google reads: title, image, price and availability, GTIN, category and custom labels. The table gives Google’s current ask for each, the limit it states and the help page it comes from.
| Attribute | Google’s requirement | Limit or rule | Source |
|---|---|---|---|
Title (title) |
Key details first, unique per product | 1 to 150 characters | Title |
Image (image_link) |
Highest resolution, no promo text or logos | 500 x 500 pixels minimum | Image |
Price (price) |
Matches landing page and checkout | EU and UK: includes VAT | Price |
Availability (availability) |
Matches landing page and checkout | in_stock, out_of_stock, preorder, backorder | Availability |
GTIN (gtin) |
Provide whenever available | EAN 13 digits, UPC 12 digits | GTIN |
Category (google_product_category) |
Most specific, 2 to 3 levels deep | Optional; ID or full path | Category |
Product type (product_type) |
Your own category hierarchy | Optional; 750 characters | Product type |
Custom labels (custom_label_0 to _4) |
Filters for reporting and bidding | 1 to 100 characters, 1,000 values each | Custom labels |
Google’s pages add a few rules the table can’t hold:
- Titles can’t carry promotional text, capitals for emphasis or extra white spaces.
- The 500 x 500 pixel minimum applies to all products from 31 January 2027. Google recommends around 1500 x 1500, and no file over 16 MB.
- Mismatched price or availability can lead to disapproval.
- Only the first of up to five product type values organises bidding and reporting in Google Ads Shopping campaigns.
For GTINs, Google says on its product data tips page that retailers who added correct GTINs saw a 20% increase in clicks on average. The page gives no study period or method. Read it as an average Google reports, not a promise for your products. The tips page also asks you to use the same title, description and colour names in the feed as on the landing page.
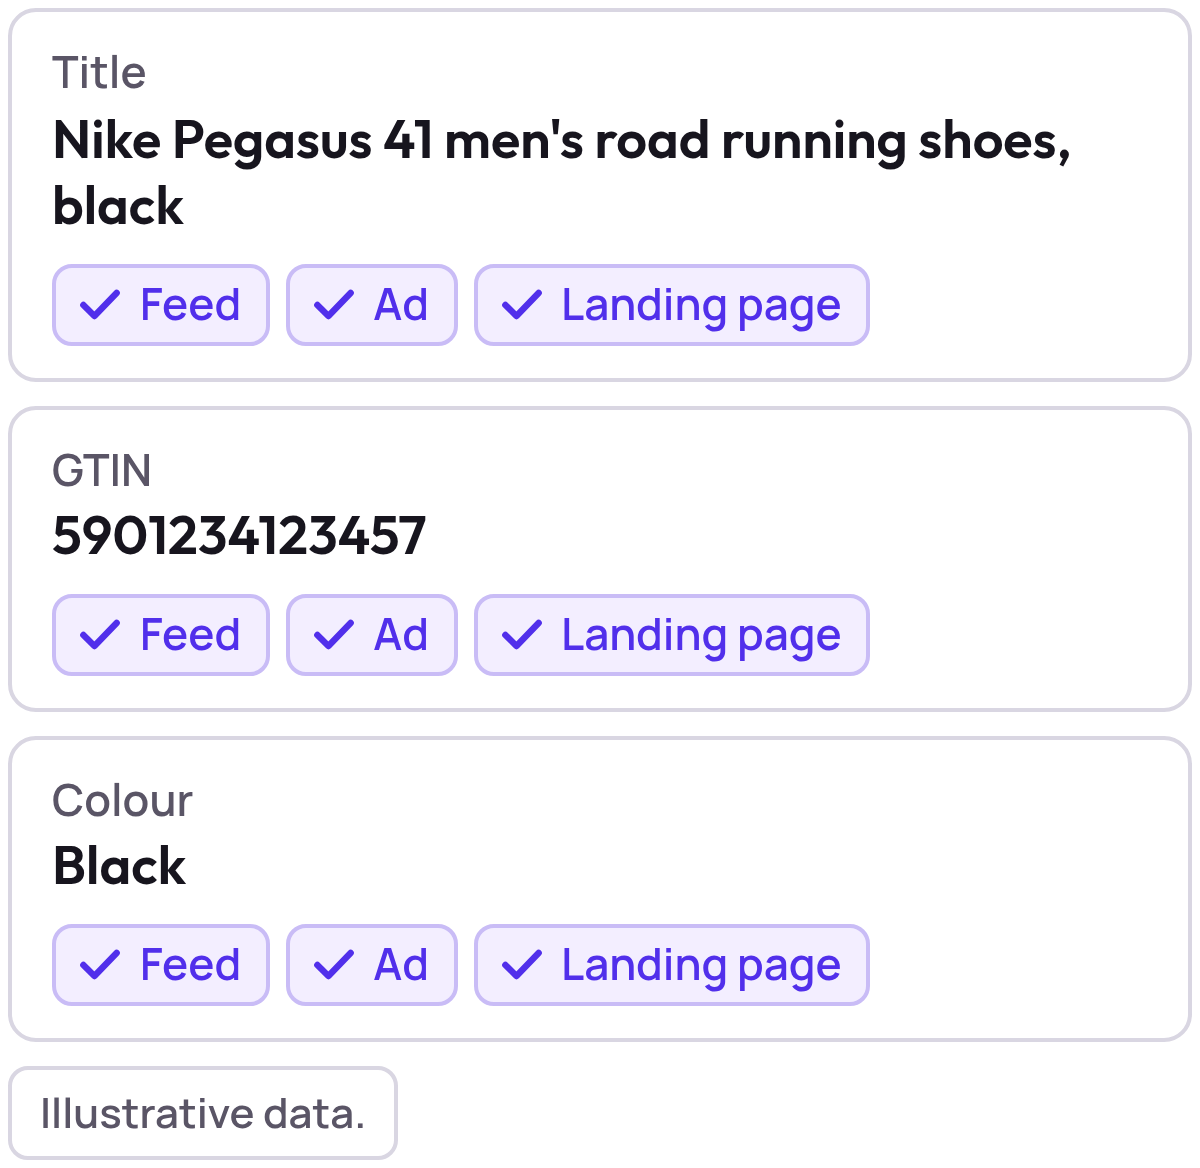
Write titles from what shoppers search
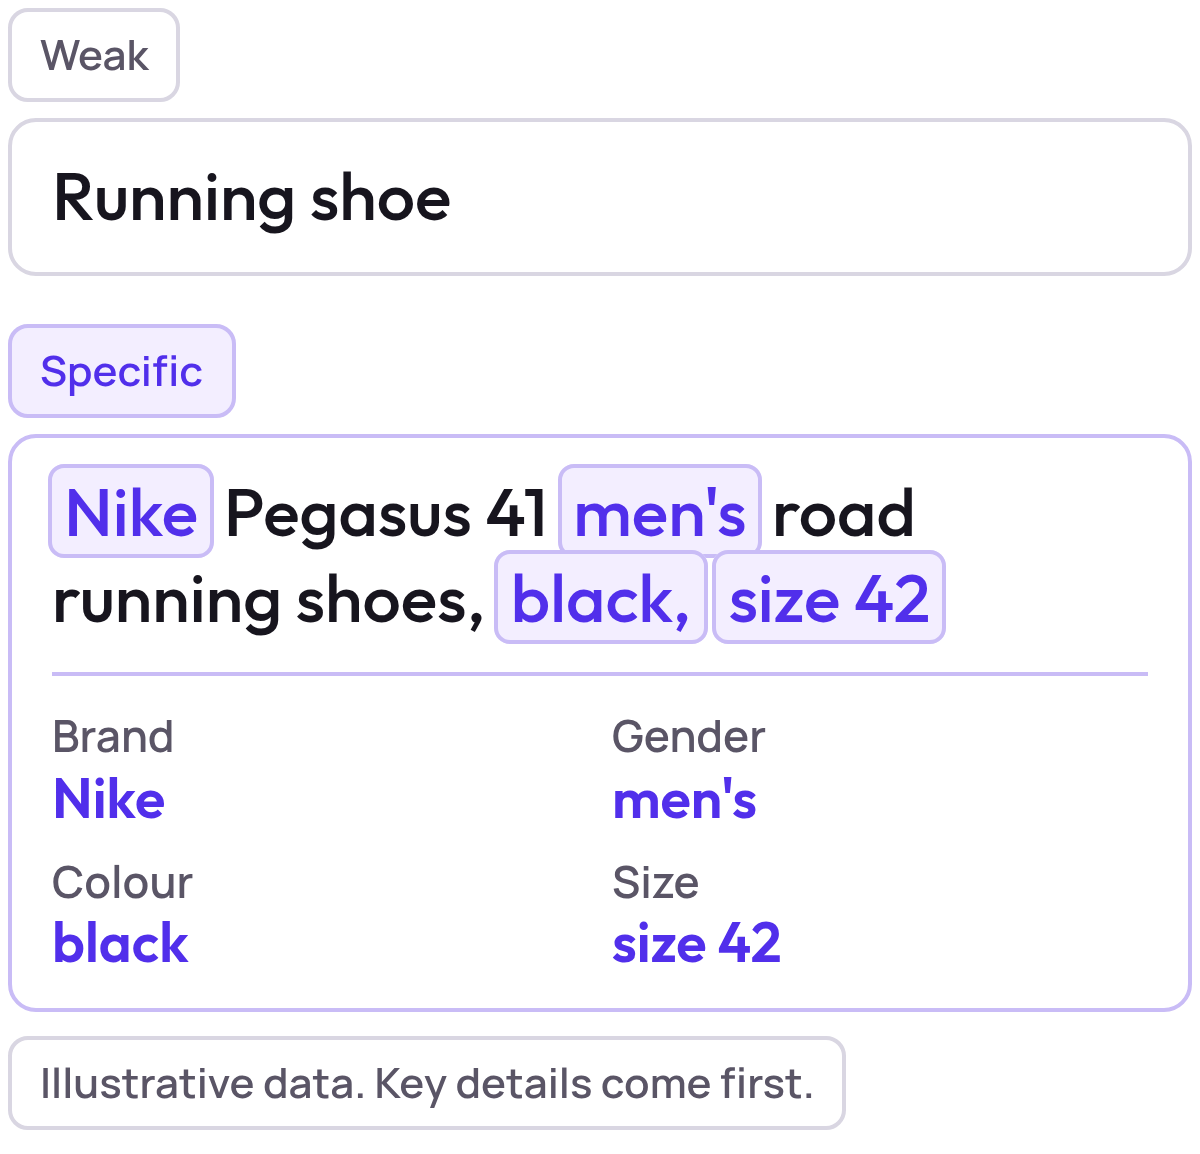
Shoppers type specific words: brand, model, gender, use, colour, size, material. Google matches the search against your product data, and the title is one of the most important parts of it. A title that repeats the shopper’s words is more likely to show for that search than a bare “Running shoe”.
A request in ChatGPT is longer and conversational, and this one names no brand. Answer engines pick products by matching the details in a request to the details they can read about a product. So name those details in the title, the description and the attributes.
The same title covers 7 of the 9 words in that request. The other two, “lightweight” and the budget, belong elsewhere. The table maps each part of both searches to where it goes.
| Search words | Detail | Where it goes |
|---|---|---|
| “nike” | Brand | Start of the title, and brand |
| “pegasus 41” | Model | Title |
| “men’s” | Gender | Title, and gender |
| “road running shoes” | Product type | Title, and product_type |
| “black” | Colour | Title, and color |
| “size 42” | Size | Title of that variant, and size |
| “lightweight” | Feature | Description or product_highlight |
| “under €150” | Budget | Nothing to write: it comes from price |
Title pattern: brand + model + gender + product type + colour + size. Google’s title page asks for the key details first.
To find the words your own shoppers use, open the search terms report for your Shopping campaigns in Google Ads, and put the words that lead to sales into the titles of the products they found. Start with the products that get the most clicks, since a better title there changes more than a perfect one on a product nobody sees. Change a handful at a time, wait for conversions to arrive (see step 5), then compare them with the products you left alone.
2. Find the products worth the ad spend
Compare each product’s ROAS with its own break-even ROAS, which is 1 ÷ contribution margin. Contribution margin is the price (excl. VAT) minus cost of goods and variable order costs, divided by the price.
Three products all return 3.5. The 50% margin product breaks even at 2, so it makes money. The 20% margin one breaks even at 5, so it loses money on every sale. A single account target can’t tell them apart. In POAS (ROAS × margin) products A, B and C read 0.7, 1.23 and 1.75, and only A falls below 1.0 (see POAS vs ROAS).
Three products all get a ROAS of 3.5: how much does each one need?
- ROAS needed to break even
- ROAS the product gets
Show the dataHide the data
| Product (contribution margin) | ROAS needed to break even | ROAS the product gets |
|---|---|---|
| A (20% margin) | 5 | 3.5 |
| B (35% margin) | 2.9 | 3.5 |
| C (50% margin) | 2 | 3.5 |
How to work out break-even ROAS per product has the four steps. If you have no margin data yet, start with ROAS alone and compare products with each other, then add margins as you get them. Merchant Center has a cost_of_goods_sold attribute for this (Google Merchant Center Help). Google says that combining it with your conversion data lets Google Ads generate additional metrics based on gross profit.
Before you have exact numbers, read the ROAS a product must beat off its margin band:
ROAS needed to break even at each contribution margin
Show the dataHide the data
| Contribution margin | ROAS needed to break even |
|---|---|
| 10% | 10 |
| 20% | 5 |
| 25% | 4 |
| 33% | 3 |
| 50% | 2 |
| 60% | 1.7 |
Check the low-margin products first. At a 10% margin a product needs a 10 return just to break even, so if your account target is lower (check yours with the break-even ROAS calculator), those products are running at a loss. The higher the break-even, the easier it is for one weak week to push a product under it.
3. Segment products by clicks and return, by hand
Group products by how many ad clicks they get and whether their return clears break-even. That gives the six groups Product Segmentation uses: Stars (many clicks, high return), Question Marks (many clicks, medium return), Cash Cows (few clicks, high return), Dogs (many clicks, low return), Drainers (few clicks, no return; the manual version below also puts few clicks with a low return here) and Ghosts (inactive products with no impressions or clicks).
Product Segmentation uses Product Metrics ML to place each product, so its results can differ from a spreadsheet. The rules below are a simple manual version you can reproduce by hand. The cut-offs are examples: change them to suit your account, and write them down so each review uses the same ones.
| Question | Manual rule of thumb |
|---|---|
| Which window? | The last 30 days, ending a few days before today so late conversions are in. |
| Many clicks? | At or above the median clicks of the products that had any clicks in the window. |
| Few clicks? | Below that median. This includes zero clicks when the product had impressions. |
| Return ratio | The product’s ROAS ÷ its break-even ROAS. This equals its POAS when margins are known. |
| High return | A ratio of 1.25 or more. |
| Medium return | A ratio from 1.00 to just under 1.25. |
| Low return | A ratio under 1.00. This includes products with no conversions, whose ratio is 0. |
| Star | Many clicks and a high return. |
| Question Mark | Many clicks and a medium return. |
| Dog | Many clicks and a low return. |
| Cash Cow | Few clicks and a ratio of 1.00 or more. |
| Drainer | Few clicks and a ratio under 1.00. |
| Ghost | No impressions and no clicks. |
Every product with clicks lands in exactly one group, and a product with clicks but no conversions is a Dog when it has many clicks and a Drainer when it has few.
The table below applies these rules to ten products, and you can download the Shopping audit sheet (XLSX, free, no sign-up) to try it on your own. It holds a feed checklist from Google’s pages, a ten-product review table with formulas that follow these rules, and a review log. Break-even ROAS is 1 ÷ margin, ROAS is revenue ÷ ad spend, and the return ratio is ROAS ÷ break-even ROAS. Revenue and margin are excl. VAT.
| Product (illustrative data) | Clicks | Ad spend | Revenue | Margin | Break-even ROAS | ROAS | Return ratio | Verdict |
|---|---|---|---|---|---|---|---|---|
| Trail running shoe | 1,240 | €620.00 | €3,100.00 | 40% | 2.50 | 5 | 2.00 | Star, increase priority |
| Rain jacket | 980 | €490.00 | €1,862.00 | 30% | 3.33 | 3.80 | 1.14 | Question Mark, test |
| Hiking backpack | 870 | €435.00 | €1,305.00 | 20% | 5 | 3 | 0.60 | Dog, lower priority |
| Water bottle | 760 | €304.00 | €1,520.00 | 50% | 2 | 5 | 2.50 | Star, increase priority |
| Camping stove | 640 | €384.00 | €1,152.00 | 25% | 4 | 3 | 0.75 | Dog, lower priority |
| Merino socks | 210 | €63.00 | €441.00 | 45% | 2.22 | 7 | 3.15 | Cash Cow, protect |
| Headlamp | 180 | €90.00 | €360.00 | 35% | 2.86 | 4 | 1.40 | Cash Cow, protect |
| Trekking poles | 150 | €75.00 | €0.00 | 30% | 3.33 | 0 | 0.00 | Drainer, collect clicks |
| Sleeping mat | 95 | €57.00 | €114.00 | 30% | 3.33 | 2 | 0.60 | Drainer, collect clicks |
| Gaiters | 0 | €0.00 | €0.00 | 35% | 2.86 | n/a | n/a | Ghost, check feed |
The median clicks of the nine products with clicks is 640, so the top five count as many. Across the account, ROAS is 3.91 (€9,854.00 ÷ €2,518.00), which looks healthy. Look closer and the two Dogs took 32.5% of ad spend and, after margin, lost €270.00 between them (revenue × margin − ad spend: −€174.00 and −€96.00). The two Drainers lost another €97.80 (−€75.00 and −€22.80).
Segmenting matters most on a small budget. Across 500 products, €20 a day averages €0.04 each, which you can compare with the cost of one click in your account. The Google Ads budget calculator shows what a given budget buys.
Daily budget in € each product gets when €20 a day is shared
Show the dataHide the data
| Products sharing €20 a day | Average daily budget per product |
|---|---|
| 20 products | €1.00 |
| 100 products | €0.20 |
| 500 products | €0.04 |
| 2,000 products | €0.01 |
A budget that size can’t test every product, so point it at the ones already returning more than their break-even. By hand this is workable for a few hundred products; beyond that you need a tool.
4. How do you optimise Google Shopping campaigns for each segment?
Each segment gets a different action, and you decide what it is. Broadly, increase priority on products that clear break-even and lower it on those that don’t. Products with little data need time before you judge them. Either way, write the segment to a custom label in your feed, such as custom_label_0, so campaigns can split on it.
| Segment | What to do |
|---|---|
| Stars | Increase priority so they get more of the budget. |
| Question Marks | Keep them running and test price and feed quality. |
| Cash Cows | Protect them and grow their reach. |
| Dogs | Lower priority or fix the landing page. Take them out of the main campaign so they stop drawing its budget. |
| Drainers | Mostly too little data. Keep them together to collect clicks and do not exclude them on low spend alone. |
| Ghosts | Check why they have no impressions: feed errors, stock or disapprovals. |
Dogs get plenty of clicks, so automated campaigns keep funding them, and their low return disappears into the account average. Moving them into their own campaign, or excluding them, stops that.
Share of ad spend against share of revenue, by segment
- Share of ad spend
- Share of revenue
Show the dataHide the data
| Product segment | Share of ad spend | Share of revenue |
|---|---|---|
| Stars | 30% | 45% |
| Question Marks | 25% | 25% |
| Cash Cows | 8% | 15% |
| Dogs | 30% | 12% |
| Drainers | 7% | 3% |
In Google Ads, split on the label. Both campaign types let you subdivide products by custom label, so each segment can get its own product group or asset group, budget and target. Demand Gen campaigns filter on the same labels: Demand Gen vs Performance Max covers which segments suit each campaign type.
One way to structure it: Stars in one campaign, Question Marks, Cash Cows and Drainers together in a catch-all, and Dogs on their own or excluded. Don’t split a small account into many campaigns: we suggest about 150 conversions a month per campaign you split, as explained in Performance Max for ecommerce.
5. Review on a schedule, after the conversions arrive
Judge products on conversions that have had time to arrive. The time between an ad click and the purchase it leads to is the Conversion Delay. Google Ads credits a conversion to the date of the click, not the date of the purchase (Google Ads Help). So the most recent days keep gaining conversions and conversion value after you have looked at them, while their ad spend is already complete.
That makes a product reviewed too early look worse than it is, and you may lower priority on one that was fine. Google says conversions can be reported up to 90 days after the click, depending on your conversion window (Google Ads Help). Smart Bidding’s bid strategy reports show the delay and how many conversions Google expects are still to come. A product review in a spreadsheet allows for neither.
An illustrative example: on Monday a product shows 6 conversions for last week’s clicks. Three weeks later the same week shows 9, because three buyers purchased days after clicking. At the same order value, its ROAS on Monday reads a third lower than it ends up.
Conversion Delay: ROAS of one week's clicks as late conversions come in
Show the dataHide the data
| Days after the week's clicks | ROAS reported so far |
|---|---|
| Day 1 | 1.2 |
| Day 3 | 2 |
| Day 7 | 2.8 |
| Day 14 | 3.3 |
| Day 21 | 3.5 |
| Day 30 | 3.6 |
To find your own Conversion Delay, open Campaigns or Ad groups in Google Ads and set a date range that ends at least 30 days ago, so the data is complete. Then click the segment icon and choose Conversions > Days to conversion (Google Ads Help). That splits your conversions by the days between click and conversion. In your reviews, leave out the recent days that are still filling in: if most conversions arrive within a week, end the window a week before today.
Google’s automated strategies, such as Target ROAS and Maximise conversion value, work from the conversion values you send. Neither knows your margins, so a target that suits one product loses money on another. Each product’s break-even tells you what target to set.
Set a schedule you can sustain, for example a weekly feed check for errors and a monthly review of product groups. Segments built on enough clicks shouldn’t flip from week to week, so monthly is usually enough.
- Fix the day and the windowReview on the same day each time, using a date range that stops a few days before today so late conversions are in.
- Compare each product with its own break-evenUse ROAS, or POAS once margins are connected. Ignore the account average.
- Change only the clear casesIncrease priority on products well above break-even and lower it on products well below. Leave the borderline ones alone.
- Write down what you changed and whenCheck the effect at the next review.
If you set a Target ROAS, change it in small steps and check each result against break-even. How to set a target ROAS from your margin covers the arithmetic, and the break-even ROAS calculator gives you the floor.
6. Four settings outside the feed and the review
Each is described on a Google help page.
| Setting | What it does | Google help page |
|---|---|---|
| Negative keywords | Shopping campaigns don’t use keywords to target ads, but you can add negative keywords to stop your ads showing for searches you don’t want, at campaign or ad group level, as broad, phrase or exact match. | Negative keywords for Shopping campaigns |
| Campaign priority (Standard Shopping only) | When the same product is in several campaigns, the highest-priority campaign (Low, Medium or High) bids first, and the next one bids if its budget runs out. This campaign setting is separate from the segment actions in step 4. | Campaign priority |
| Promotions | Merchant Center promotions show a special offer link, such as 15% off or free shipping, on Shopping ads and free listings. | About promotions |
| Bid simulator and auction insights | The bid simulator estimates what your results would have been over the previous seven days with different product group bids, and auction insights compares you with other advertisers in the same auctions. | Monitor and optimise your Shopping campaigns |
Where a tool fits
A feed tool helps when you need to edit product data at scale. Knowing whether each product clears its break-even is a separate job, and that one belongs to Product Segmentation.
Product Metrics is product-level optimisation software for Google Shopping and Performance Max. It does what the ten-product review table does, for every product: it segments them by ad clicks and ROAS or POAS and writes the segment to Merchant Center labels your campaigns can use. It works on ROAS straight away and switches to POAS when you connect margins. You decide what each segment gets, and titles, budgets and targets stay with you.
Ten products, two numbers each
What is a good ROAS explains how to read each product’s result, and POAS vs ROAS shows the same comparison in profit. If you run Performance Max as well, Performance Max for ecommerce covers how to split the budget.
To begin, list the ten products with the most clicks and put each one’s break-even ROAS next to the ROAS it returns today. If the account target says one thing and those ten verdicts say another, that gap is your first product-level decision.
Sources
Berend Vrakking, founder of Product Metrics, wrote this guide. His work has been nominated at the Dutch Search Awards (Best Measurement Campaign 2023, Best Use of Data 2024).
- Tips to optimize your product data (Merchant Center Help)
- About Shopping ads and how to upload your products to Merchant Center
- Syncing your products (Google) and Shopify Help Center: Google & YouTube and syncing your products
- Title requirements, image requirements, price, availability and GTIN
- Category, product type and custom labels
- Cost of goods sold and gross profit metrics
- Understand conversions by time and how long it takes for your customers to convert (Google Ads Help)
- Negative keywords for Shopping campaigns, campaign priority, Merchant Center promotions and monitor and optimise your Shopping campaigns
Keep reading.
Dead stock inventory: how to find it and clear it
Dead stock is inventory that has stopped selling. See when stock counts as dead, what it costs to hold and what to do per product, with a worked example.
Demand Gen vs Performance Max for ecommerce
Demand Gen vs Performance Max by product: which products each campaign type should carry, and how to read each against its own break-even ROAS.
Google Shopping management: the four jobs and who does them
Google Shopping management is four jobs: product data, campaigns, products and measurement. See who does each job and how to check every product.
Frequently asked questions.
What is a Google Shopping feed?
How much does Google Shopping cost?
Is €10 a day enough for Google Shopping?
What is the best bidding strategy for Google Shopping?
How do you optimise Google Shopping feed titles?
How do I get a better ROAS from Shopping ads?
Does Shopify have a Google Shopping feed?
How often should I optimise Google Shopping ads?
See which of your products to push, fix or pause. Start with your own products, or a 30-second estimate.
Check one product first: work out its break-even ROAS in the calculator. Then see where all your products stand.
Not ready to connect? Book a demo: a video call with Berend, then a demo account.