 Log in with Google
What is Google Merchant Center? An advertiser's guide
Google Merchant Center holds your product data and Google Ads runs the ads. See what changed in 2026 and how custom labels set priority per product.
Google Merchant Center is the free tool where you upload and manage your product data, so your products can appear across Google Search, Maps, YouTube and more (Google Merchant Center Help). It holds the products, and Google Ads runs the ads.
I wrote it for shop owners new to Merchant Center and for PPC specialists who run Google Shopping ads or Performance Max. Feed basics live in optimising Google Shopping ads; this guide covers what to set up so you can steer each product. The Google Merchant Center glossary entry has the short definition, and Google Shopping management the weekly routine.
Merchant Center, Google Ads and where products show
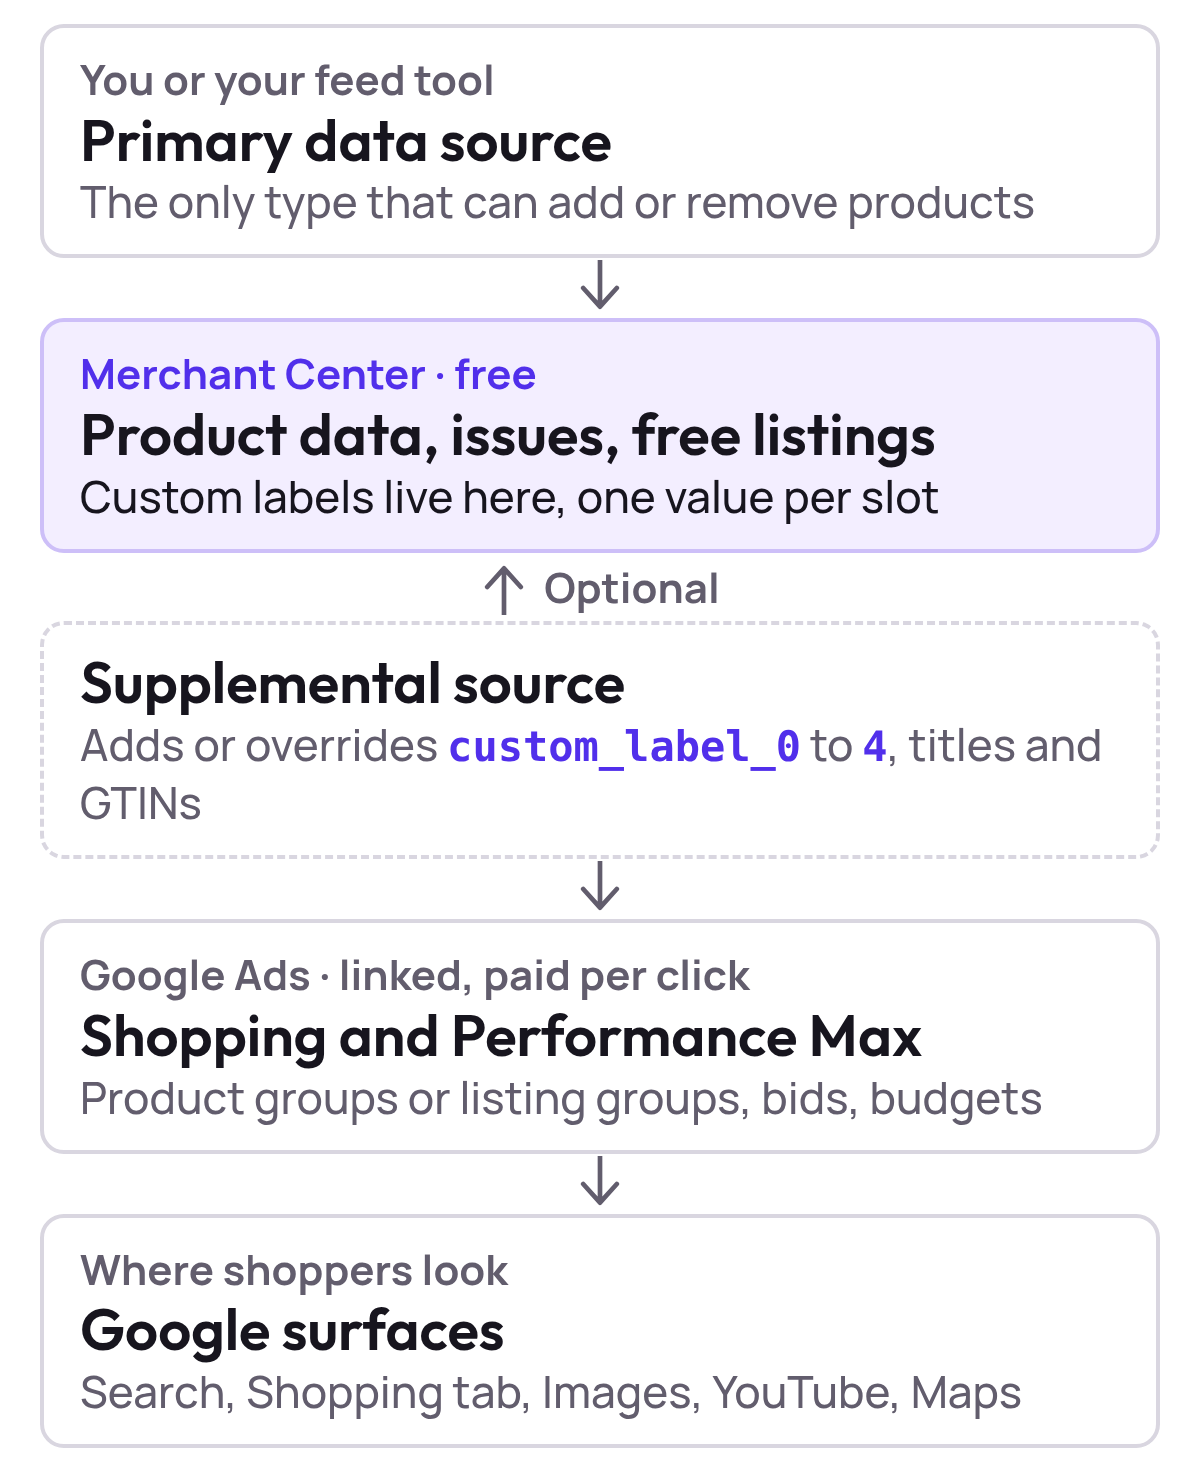
Merchant Center stores your product data, and Google Ads spends your budget. In Merchant Center you add products, fix issues and set labels. Google Ads is where campaigns, bids and budgets are set. Google’s surfaces (Search, the Shopping tab, Images, YouTube and Maps) are where shoppers see the result.
Free listings can appear at no cost on Google Search, Maps, Gemini, YouTube, the Shopping tab, Images and Lens, and in most cases they are on by default. Google’s help centre lists add-ons such as local inventory ads, promotions, vehicle ads and loyalty programs. Shopping ads are the paid layer. They “use your existing Merchant Center product data (not keywords)”, and Google charges by cost per click, only when someone clicks (Google Ads Help).
Six checks before labels
Labels only help when the basics are in place: a disapproved product or a mismatched item ID skews every product verdict that follows. Sign-up asks about your business, where you sell and how your products reach Merchant Center, and the Google Account you use needs admin access.
- Create the accountSign in with a Google Account email, which can create only one Merchant Center account. Enter your business details and where you sell. The country you choose cannot be changed later.
- Verify and claim your websiteOne URL can be claimed by only one account, unless you use a multi-client account.
- Add your products as a primary data sourceConnect your platform (Google gives Shopify as an example), host a file Google fetches every 24 hours, or use Google Sheets or the Merchant API. Only a primary source can add or remove products.
- Link Google AdsYou need the link before you can create Shopping campaigns.
- Clear the disapprovalsDisapproved products don't appear on Shopping ads or free listings, so fix them before judging any product.
- Make item IDs and costs matchSend the same item IDs in your conversion tag as the id in your feed, and add cost_of_goods_sold if you can. Google Ads uses both for product-level profit.
Products expire 30 days after their last refresh, unless you added them directly in Merchant Center. A re-submitted source, a scheduled upload or Google’s own check of your website refreshes them. Google’s steps are in verify and claim, adding products (the product feed entry defines the term) and linking Google Ads. Disapprovals are in Google’s guide.
The last check carries the profit logic. Google’s cart data reports need the item IDs in your conversion tag to exactly match the id in your feed. Combined with cost_of_goods_sold, they let Google Ads generate metrics based on gross profit (Google Ads Help).
What are custom labels in Merchant Center?
For an advertiser, custom labels are the main lever in Merchant Center. They are five attributes, custom_label_0 to custom_label_4, that let you create filters for Performance Max, Shopping or Demand Gen campaigns, for reporting and bidding on groups of products. Shoppers never see them (Google Merchant Center Help). The rules from that page:
- One value per attribute per product, 1-100 characters, not case sensitive.
- Up to 1,000 unique values per attribute, 5,000 in total. Labels beyond the limit are ignored for reporting and bidding.
- Not for Display with dynamic remarketing, which has its own attributes.
Give each slot one meaning. Google’s best practice is one type of label per attribute, for example season in custom_label_0, selling rate in custom_label_1 and price range in custom_label_2. Here is a slot plan to adapt. The meanings are a suggestion, because Google leaves them to you.
custom_label_0: return against break-even, rewritten weekly. Valuesaboveandbelow.custom_label_1: margin band, changed monthly. Valueshigh-marginandlow-margin.custom_label_2: price band, changed with prices. Values such as0-50and50-100.custom_label_3: season or clearance, changed a few times a year. Valueswinterandclearance.custom_label_4: kept free for tests.
Mixing questions in one slot multiplies the values. Keep fast-changing labels apart from slow ones, so a weekly rewrite never touches your seasons.
How many label values you maintain: one mixed slot against three clean slots
Show the dataHide the data
| How the custom labels are set up | Label values to maintain |
|---|---|
| One mixed slot | 48 |
| Three clean slots | 11 |
Three places to write a label
Pick the place by where the value comes from.
| Where | Use it for | Good to know |
|---|---|---|
| Primary feed | Values your shop or feed tool already holds, such as season | A file hosted at a URL is fetched every 24 hours |
| Attribute rules | Labels derived from data already in the feed, such as price bands | Needs the Advanced data source management add-on; rules run in order |
| Supplemental source | Values from outside the shop data, such as performance | Matches on id, cannot add products or stand alone, and needs the same add-on |
Google’s example for rules is a price-range label set from the price you already submitted. Performance is not in the product data unless you add it, which is why performance labels usually travel in a supplemental source.
A supplemental source adds or overrides custom labels, promotion IDs and titles, can exclude products, and can add missing GTINs or local inventory data. It updates only products whose IDs are in a primary source (Google Merchant Center Help). The tab appears only with the Advanced data source management add-on.
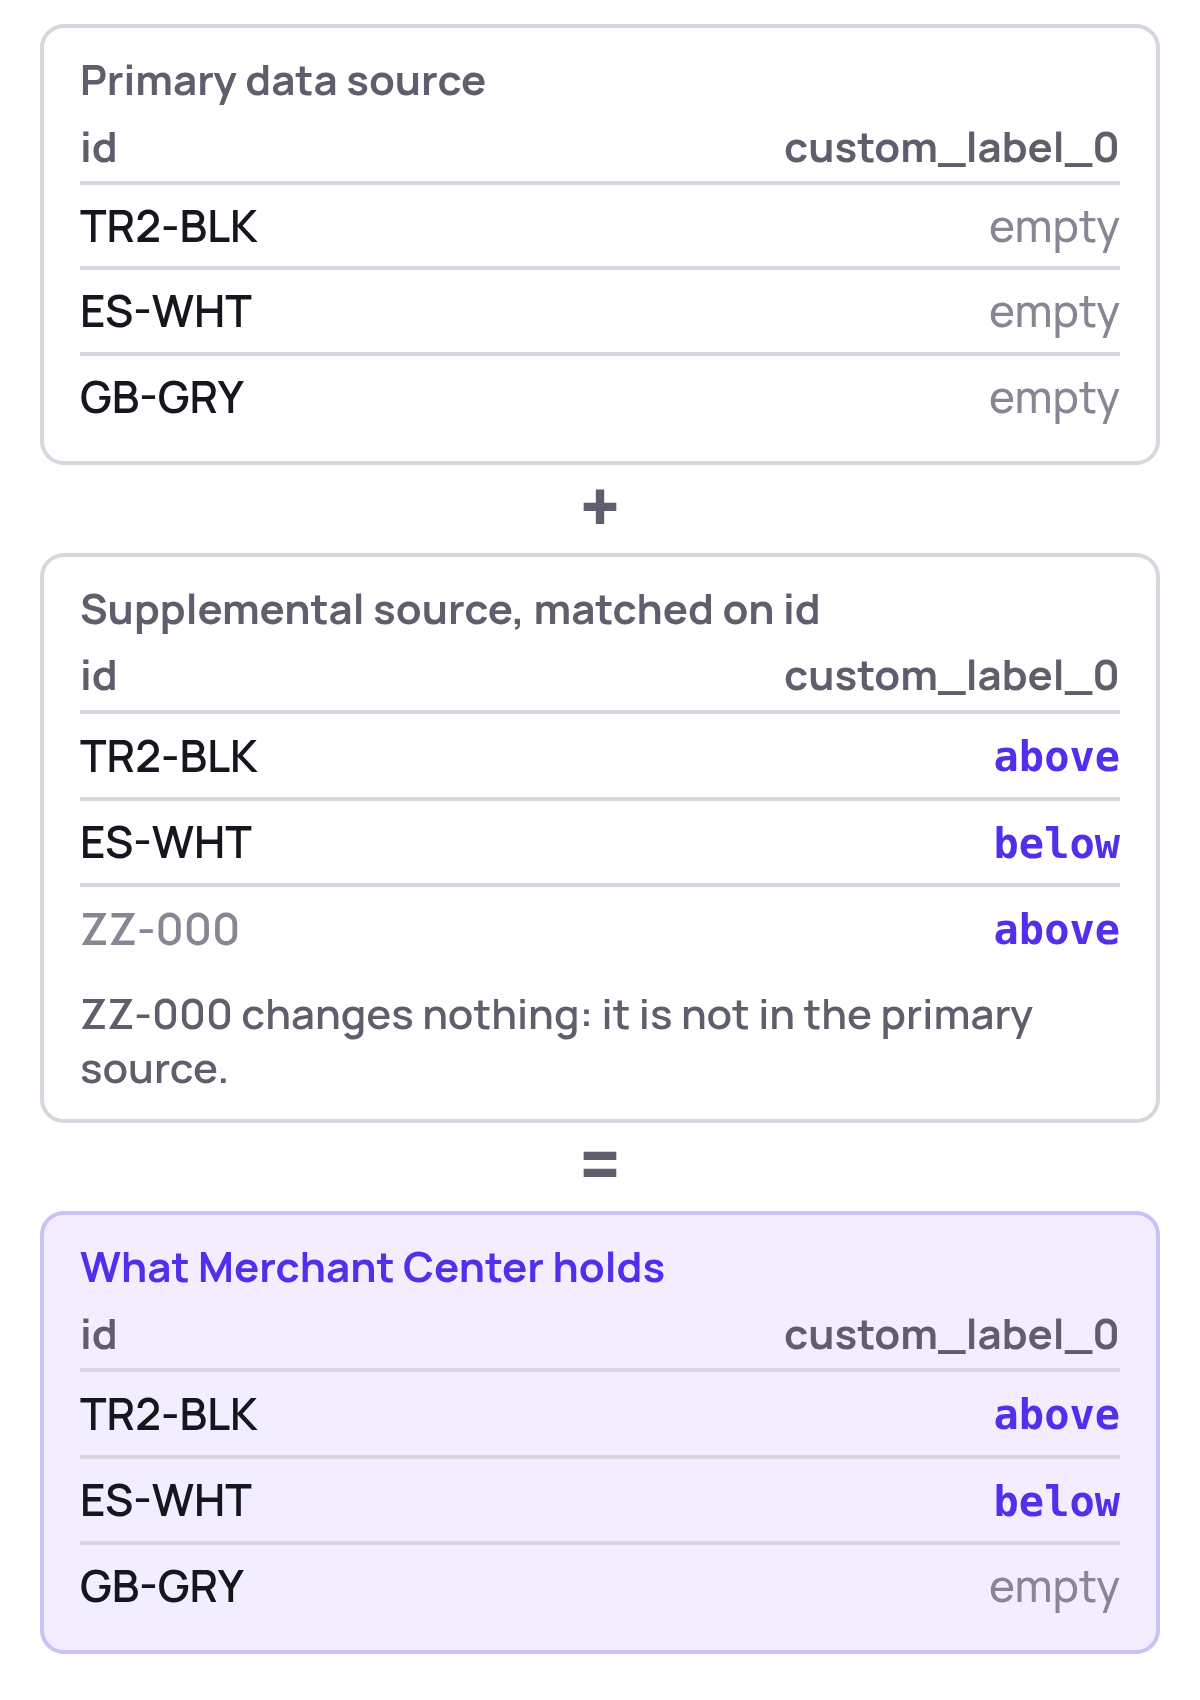
If your IDs differ between sources, custom data source matching joins them on another attribute such as brand, with a limit of 30,000 rows on the supplemental source (Google Merchant Center Help).
From label to campaign
A label does nothing until a campaign splits on it. In a Shopping campaign you subdivide product groups by custom label and set bids per group (Google Ads Help). In Performance Max you subdivide an asset group’s listing group by custom label, and you can select Exclude on a group (Google Ads Help). Performance Max for ecommerce walks through the exclusion.
Labels also keep the structure small. An asset group can have up to 1,000 listing groups, and Google says a large number is not best practice and recommends grouping with custom labels.
Listing groups needed to cover 5,000 products, against Google's limit of 1,000
- Listing groups needed
- Google's limit per asset group (1,000)
Show the dataHide the data
| How the listing groups are split | Listing groups needed |
|---|---|
| One group per product | 5,000 |
| One group per label value | 6 |
Allow 24-48 hours for new or edited labels to appear in Google Ads, and stay clear of the 1,000-value limit, because Google says a label may not sync when you are at or near it.
Worked example: a healthy account with two losing products
Six products over 30 days, revenue excl. VAT. Break-even ROAS is 1 ÷ contribution margin, which the break-even ROAS calculator works out for any margin, and break-even ROAS per product shows step by step. POAS is ROAS × contribution margin, and break-even POAS is 1.0 (POAS vs ROAS).
| Product | Margin | Break-even ROAS | Spend | Revenue | ROAS | Contribution profit | After ads |
|---|---|---|---|---|---|---|---|
| Trail Runner 2 | 30% | 3.33 | €1,000 | €4,500 | 4.50 | €1,350 | +€350 |
| Winter Boot | 40% | 2.50 | €800 | €2,400 | 3.00 | €960 | +€160 |
| Everyday Sock | 20% | 5.00 | €300 | €1,200 | 4.00 | €240 | −€60 |
| Rain Jacket | 50% | 2.00 | €600 | €1,500 | 2.50 | €750 | +€150 |
| Gym Bag | 25% | 4.00 | €500 | €1,000 | 2.00 | €250 | −€250 |
| Water Bottle | 35% | 2.86 | €100 | €500 | 5.00 | €175 | +€75 |
| Account | 33.6% blended | 2.98 | €3,300 | €11,100 | 3.36 | €3,725 | +€425 |
Illustrative data.
The account returns 3.36 against a blended break-even of 2.98, which looks healthy until you read the rows.
ROAS of six products against the ROAS each needs to break even
- ROAS the product gets
- ROAS needed to break even
- ROAS of the whole account (3.36)
Show the dataHide the data
| Product (contribution margin) | ROAS the product gets | ROAS needed to break even |
|---|---|---|
| Trail Runner 2 (30%) | 4.5 | 3.33 |
| Winter Boot (40%) | 3 | 2.5 |
| Everyday Sock (20%) | 4 | 5 |
| Rain Jacket (50%) | 2.5 | 2 |
| Gym Bag (25%) | 2 | 4 |
| Water Bottle (35%) | 5 | 2.86 |
Everyday Sock returns 4 and still loses money, because its 20% margin needs 5 (a POAS of 0.8). Rain Jacket returns only 2.50 yet clears its 2. A single account target would treat them the wrong way round.
Contribution profit against ad spend in € for each product, last 30 days
- Contribution profit before ads
- Ad spend
Show the dataHide the data
| Product | Contribution profit before ads | Ad spend |
|---|---|---|
| Trail Runner 2 | €1,350 | €1,000 |
| Winter Boot | €960 | €800 |
| Everyday Sock | €240 | €300 |
| Rain Jacket | €750 | €600 |
| Gym Bag | €250 | €500 |
| Water Bottle | €175 | €100 |
Now write above or below to custom_label_0 for each product, through a supplemental source, and wait 24-48 hours. In a Shopping campaign, the Products page in Google Ads has a Custom label column next to clicks and conversion metrics (Google Ads Help), and product groups or listing groups can split on the label.
Contribution profit against ad spend in €, for products labelled above or below break-even
- Contribution profit before ads
- Ad spend
Show the dataHide the data
| custom_label_0: ROAS above or below break-even | Contribution profit before ads | Ad spend |
|---|---|---|
| above (4 products) | €3,235 | €2,500 |
| below (2 products) | €490 | €800 |
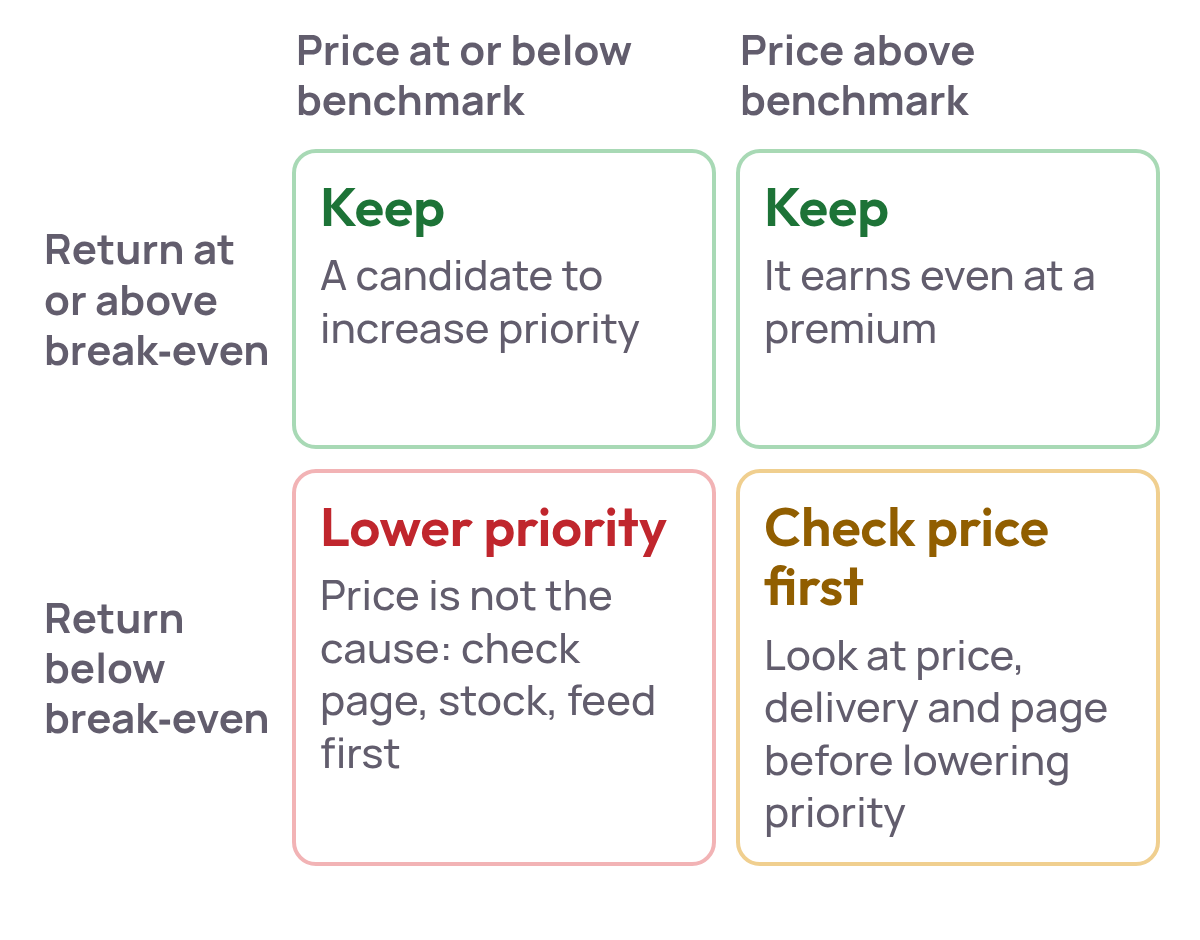
Two of six products take 24.2% of the spend and lose €310 after ads. Compare each product’s ROAS, or POAS, with its own break-even, label it above or below, and set priority per group. Check why the below group underperforms before you lower its priority. Do not judge a product on a handful of clicks, which Google Shopping management covers.
Google’s price benchmark is a rough average
Google’s Pricing tab, under Analytics in Merchant Center, compares your price with a benchmark: “the average price that typically leads to more successful ad auctions, impressions, clicks, or conversions”, taken from retailers selling a product with the same GTIN. The price gap is the percentage difference between the two. You only get it for products with a valid GTIN (Google Merchant Center Help).
Treat it as a rough signal, not a price to match. It is one aggregated number per product: you can’t see which retailers it includes, how many there are, when their prices were read or what they charge for shipping. It also knows nothing about your margin, so read it next to profit, never instead of it.
| Product | Your price | Benchmark | Your price ÷ benchmark |
|---|---|---|---|
| Trail Runner 2 | €89.99 | €92.50 | 97.3% |
| Winter Boot | €129.99 | €124.99 | 104.0% |
| Everyday Sock | €9.99 | €9.50 | 105.2% |
| Rain Jacket | €79.99 | €79.99 | 100.0% |
| Gym Bag | €49.99 | €44.99 | 111.1% |
| Water Bottle | €14.99 | €16.00 | 93.7% |
Illustrative data.
Both products below break-even are priced above the benchmark. Real accounts will not line up so neatly, and the example is built to show the rule.
See exactly who you are compared with
Competitor Prices shows what the benchmark hides. It scans competitor sites for the products that compete with yours, including own-brand products with no shared GTIN, matched by style, colour and the dimensions you define. For each product you see where your price ranks, the gap and why each match is comparable, with prices compared without shipping costs. You can monitor Google Shopping prices for the products you choose, daily, weekly or monthly. The price position sits next to POAS, margin and stock, and becomes a Merchant Center label your campaigns can use.
Where Product Metrics fits
Product Metrics does the labelling from the worked example for you, with a finer split than above and below. Product Segmentation uses ad clicks and ROAS to place each product in one of six segments, and writes the segment to a custom label, for example custom_label_0 = stars, through a supplemental feed you add once. You approve every label it writes, and the label updates daily. You split campaigns or asset groups on it; bids and budgets stay with you.
It works on ROAS straight away and switches to POAS once you connect margins, which is when Everyday Sock’s 0.8 shows up without a spreadsheet. Your feed itself stays in your shop or feed tool. Product Metrics has analysed more than 1M products, and my work was nominated at the Dutch Search Awards (Best Measurement Campaign 2023, Best Use of Data 2024).
A first label in two days
For the weekly routine around labels, read Google Shopping management; for titles, images and feed quality, how to optimise Google Shopping ads.
Clear your disapprovals first. Then decide what custom_label_0 means, pick the ten products with the most clicks, and compare each with its own break-even ROAS. Write above or below in a supplemental source, and check your product groups or listing groups after two days.
Sources
- Get started with Merchant Center and Free listings for products
- Merchant Center Next is now Merchant Center
- Create a product data source and Set up your attribute rules
- Custom label 0-4 and Use custom labels for Shopping ads
- Manage a Performance Max campaign with listing groups and About Pricing in Merchant Center Analytics
- Delete the Merchant Center account and Expiration date
Keep reading.
Dead stock inventory: how to find it and clear it
Dead stock is inventory that has stopped selling. See when stock counts as dead, what it costs to hold and what to do per product, with a worked example.
Demand Gen vs Performance Max for ecommerce
Demand Gen vs Performance Max by product: which products each campaign type should carry, and how to read each against its own break-even ROAS.
Google Shopping management: the four jobs and who does them
Google Shopping management is four jobs: product data, campaigns, products and measurement. See who does each job and how to check every product.
Frequently asked questions.
How much does Google Merchant Center cost?
Is Merchant Center the same as Google Ads or Google Shopping?
Is Merchant Center Next a different tool?
How do I turn off or delete Google Merchant Center?
See which of your products to push, fix or pause. Start with your own products, or a 30-second estimate.
Check one product first: work out its break-even ROAS in the calculator. Then see where all your products stand.
Not ready to connect? Book a demo: a video call with Berend, then a demo account.