 Log in with Google
Competitive pricing examples: 9 real companies, sourced
Competitive pricing examples from Tesco, Currys, Aldi, Costco, Amazon and Delta, plus a worked trainer example: when to price above, at or below the median.
Competitive pricing is setting your price by reference to what comparable competitors charge: below, at or above them. The competitive pricing examples below are nine real companies, each with a dated, linked source. One price dataset is read as a price position, and a worked own-brand example has numbers you can redo by hand.
The method works in a spreadsheet, and its point is profit: where your prices sit and what that does to your margin. Competitor Prices in Product Metrics does the matching for you and puts the result next to margin and POAS.
1. What is competitive pricing?
Competitive pricing is setting a price by reference to what comparable competitors charge. Shopify and Indeed define it the same way. The decision is where to sit (below, at or above the market) and whether your margin can carry the position. Cheap is only one of the three answers. Priceshape sets it against cost-plus pricing (your costs) and value-based pricing (what customers will pay): competitive pricing looks outward, at the market.
| Position | Usually chosen when | What it asks of you |
|---|---|---|
| Below competitors | You want share or volume quickly | A margin that can fund the gap |
| At competitors | Shoppers compare closely and the products look alike | Room to match without missing target |
| Above competitors | Shoppers value your quality, brand, stock or service | Nothing extra, as long as sales hold |
Everything hangs on the word comparable. A competitor price only means something next to a product shoppers would swap yours for. For branded products that is the same GTIN. For own-brand products it is not, which is why section 5 matches on dimensions instead.
2. One basket, eight prices
The cleanest example of price position is a basket compared at several shops. Which? priced 93 branded and own-label items at eight supermarkets in September 2026 (published 5 October 2026).
What the same 93 items cost at eight UK supermarkets (£)
- Basket price (£)
- Median of the eight baskets (188.33)
Show the dataHide the data
| Supermarket | Basket price (£) |
|---|---|
| Aldi | 159.48 |
| Lidl (with Plus) | 161.48 |
| Asda | 186.71 |
| Tesco (Clubcard) | 187.71 |
| Sainsbury's (Nectar) | 188.95 |
| Morrisons (More) | 192.93 |
| Ocado | 208.64 |
| Waitrose | 223.38 |
Read it as a ratio. The median of the eight is £188.33. Divide each price by it and Aldi is 0.85, Tesco with Clubcard 1.00 and Waitrose 1.19. Against Aldi, Waitrose cost 1.40 times as much for the same items, and Tesco with Clubcard 1.18 times.
Which? measures prices only and says nothing about the strategy behind them. What it does show is the spread: the same items cost 40% more at one end than the other, and each position needs a business model that funds it.
3. Competitive pricing examples: nine real companies, by strategy
Shopify groups strategies as lower, equal and higher pricing; this section follows that order, then adds dynamic pricing. All nine at a glance:
| Company | Strategy | Source date |
|---|---|---|
| Tesco | Price matching | 13 May 2022 |
| Currys | Price matching | 9 Mar 2022 |
| John Lewis | Price promise retired | 4 May 2022 |
| Aldi | Low-price leader | Sept 2026 |
| Costco | Low price, loss leader | Oct 2025, Jun 2024 |
| Waitrose | Premium position | Sept 2026 |
| Disney+ | Penetration | 11 Apr 2019 |
| Amazon | Dynamic, external price | 18 Oct 2024 |
| Delta | Dynamic, AI revenue management | 2 Aug 2025 |
Price matching: Tesco, Currys and John Lewis
In 2022 Tesco ran an Aldi Price Match: own-label products priced to match Aldi’s equivalents, checked and potentially changed twice a week. On 28 March 2022, 398 own-label lines were in it. By 13 May, 380 were. The Grocer reported that at least 18 had been removed to raise prices: chilled dips went from 79p in the match to £1.20, and a strawberry jam from 28p to 31p.
How much two Tesco prices rose after leaving its Aldi Price Match (%)
Show the dataHide the data
| Tesco product | Price increase |
|---|---|
| Chilled dips (six varieties) | 51.9% |
| Strawberry jam (454g) | 10.7% |
Even a retailer built around matching treated it as a per-product choice. This is also an own-brand against own-brand comparison, the problem the trainer example below solves.
Currys shows the other limit. Its Price Promise, as Expert Reviews described it on 9 March 2022, matches UK shops in store and online only when “the product you’ve spotted cheaper on a competing website has the same model number”. It excludes trade and third-party prices, and student and NHS discounts. A price promise covers identical products, which is the same GTIN problem own-brand products have.
John Lewis went the other way. Which? reported on 4 May 2022 that it would scrap “Never Knowingly Undersold”, in place since 1925, for “Quality & Value”, with a £500m investment to “more proactively lead on great value” and more of its own-brand ANYDAY range. A match-anyone promise is one way to compete on price. This retailer chose to replace it with everyday value and own brand.
Low-price leadership: Aldi and Costco
Aldi was the cheapest of the eight in the Which? basket, at £159.48, with Lidl (with Plus) £2.00 behind. Costco’s fiscal 2025 annual report states the aim in its own words: “We do not focus in the short-term on [maximising] prices charged, but instead seek to maintain what we believe is a perception among our members of our ‘pricing authority’”.
The price of that position shows in the margin. Costco’s gross margin was 11.12% of net sales in fiscal 2025 (margin is not the same as markup).
Gross margin of Costco and Apple's products (% of net sales)
Show the dataHide the data
| Company | Gross margin (% of net sales) |
|---|---|
| Costco | 11.1% |
| Apple (products) | 36.8% |
The Apple figure is not a premium-pricing claim. Apple’s annual report says many of its competitors “seek to compete primarily through aggressive pricing and very low cost structures”, and its products earned a 36.8% gross margin.
Premium: the top of the basket
Waitrose’s £223.38 basket is the premium end of the Which? data: 19% above the median, 40% above Aldi. A premium position is competitive as long as shoppers still buy at it. Whether it holds is settled by your sales and POAS. The competitor gets no vote.
Penetration: Disney+
Disney announced Disney+ in April 2019 at $6.99 a month ($69.99 a year) for a US launch on 12 November. Engadget reported it against a Netflix with over 139 million customers, and that Disney was prepared to take losses that could reach a billion dollars in 2020: margin given up on purpose, for a stated reason and a limited time.
Loss leader: Costco's rotisserie chicken
The Hustle reports Costco’s rotisserie chicken has cost $4.99 since 2009, after a brief rise to $5.99 in the 2008 financial crisis, and that Costco’s CFO admitted in 2015 to a multimillion-dollar hit from not raising it. A loss leader is judged on the basket it brings in, not on its own margin. In ads, the same logic needs to see what shoppers buy next, which is what Product Journeys shows.
Dynamic pricing: Amazon and Delta
Amazon’s seller guidance (18 October 2024) says “Price items at or below the lowest price from major retailers outside Amazon” to maximise your chance of the Featured Offer, and offers Automate Pricing, which “automatically adjusts your prices in real time”.
NBC News (2 August 2025) reported Delta planned AI-based revenue management on 20% of its domestic network by the end of 2025, with Fetcherr, while Delta said its ticket pricing “never takes into account personal data”. In both cases software moves the price itself.
Own brand against brands: Kirkland Signature
Costco’s annual report says Kirkland Signature products are “offered at prices that are generally lower than national brands” and “generally earn higher margins”. Own brand can sit below the brand price and still carry more margin.
Psychological pricing: the $9 ending
In three field experiments, Anderson and Simester (2003) found a $9 price ending increased demand in all three, more for new items than for items sold before, and less when a “Sale” cue was used. A $9 ending dresses the price up without moving it against competitors, so use it after you have chosen a position.
4. Competitive pricing on Google Shopping
Shopping ads show your price, so position matters before the click. Google’s own tool for it is the price benchmark in Merchant Center, defined as “the average price that typically leads to more successful ad auctions, impressions, clicks, or conversions”. It is built from “all retailers selling a product with the same GTIN”, and you must “provide a valid GTIN” to receive one.
A product only you sell has no other retailer with its GTIN, so an own-brand product gets no benchmark. Channable’s help centre puts it plainly: “Use the benchmark to support decisions, not replace margin targets”.
The same 93 items priced with and without loyalty offers (£)
- Basket price with loyalty offers (£)
- Basket price without (£)
Show the dataHide the data
| Supermarket | Basket price with loyalty offers (£) | Basket price without (£) |
|---|---|---|
| Lidl | 161.48 | 161.84 |
| Tesco | 187.71 | 193.45 |
| Sainsbury's | 188.95 | 195.01 |
| Morrisons | 192.93 | 193.13 |
Price basis matters as much as matching. In the Which? data, Tesco with Clubcard (£187.71) and without (£193.45) differ by 3.1%, Sainsbury’s by 3.2%. Competitor Prices compares list prices without shipping, so every product is compared on its price alone.
5. A worked example: Nike Pegasus 42 against adidas and PUMA
Nike’s Pegasus 42 costs €139.99 on nike.com/nl. No adidas or PUMA product shares its GTIN, so we match on six approved dimensions: use, cushioning, drop, plate, weight and colour. A trainer is comparable when it matches at least 75% of them.
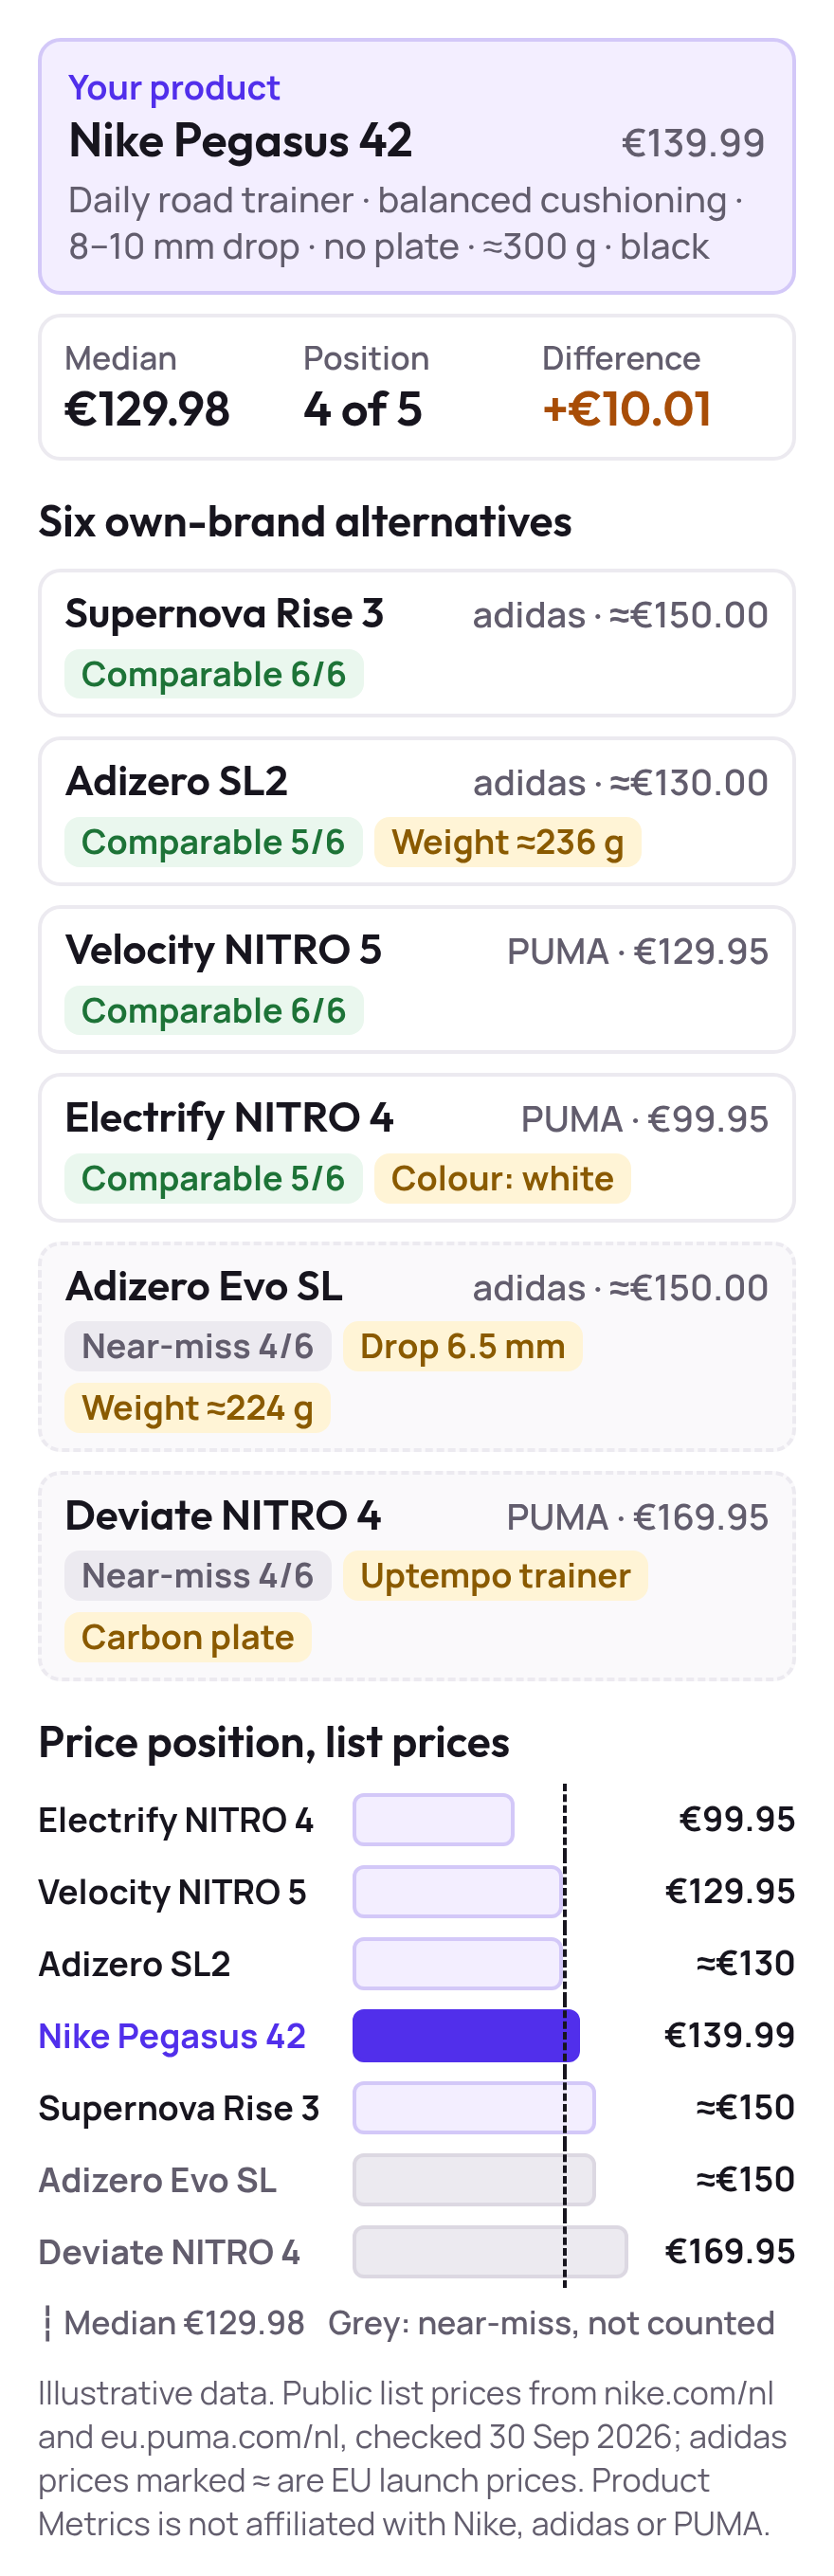
Four of the six qualify. The PUMA Electrify NITRO 4 differs only in colour, so it counts. The adidas Adizero Evo SL and PUMA Deviate NITRO 4 miss on two dimensions each and drop out.
List price of the Nike Pegasus 42 against four comparable trainers (€)
- List price
- Median of the four comparable trainers (€129.98)
Show the dataHide the data
| Trainer | List price |
|---|---|
| PUMA Electrify NITRO 4 | €99.95 |
| PUMA Velocity NITRO 5 | €129.95 |
| adidas Adizero SL2 | €130.00 |
| Nike Pegasus 42 (yours) | €139.99 |
| adidas Supernova Rise 3 | €150.00 |
The four comparable prices are €99.95, €129.95, €130.00 and €150.00 (the adidas prices are EU launch prices). Their median is €129.98 (€129.975 rounded). The average, €127.48, is dragged down by the €99.95 Electrify, which is why the median is the safer reference.
Your numbers follow from that:
- Price position: 4 of 5, counting yourself, where 1 is cheapest.
- Price ratio: 139.99 ÷ 129.98 = 1.08.
- Price difference: 139.99 − 129.98 = +€10.01.
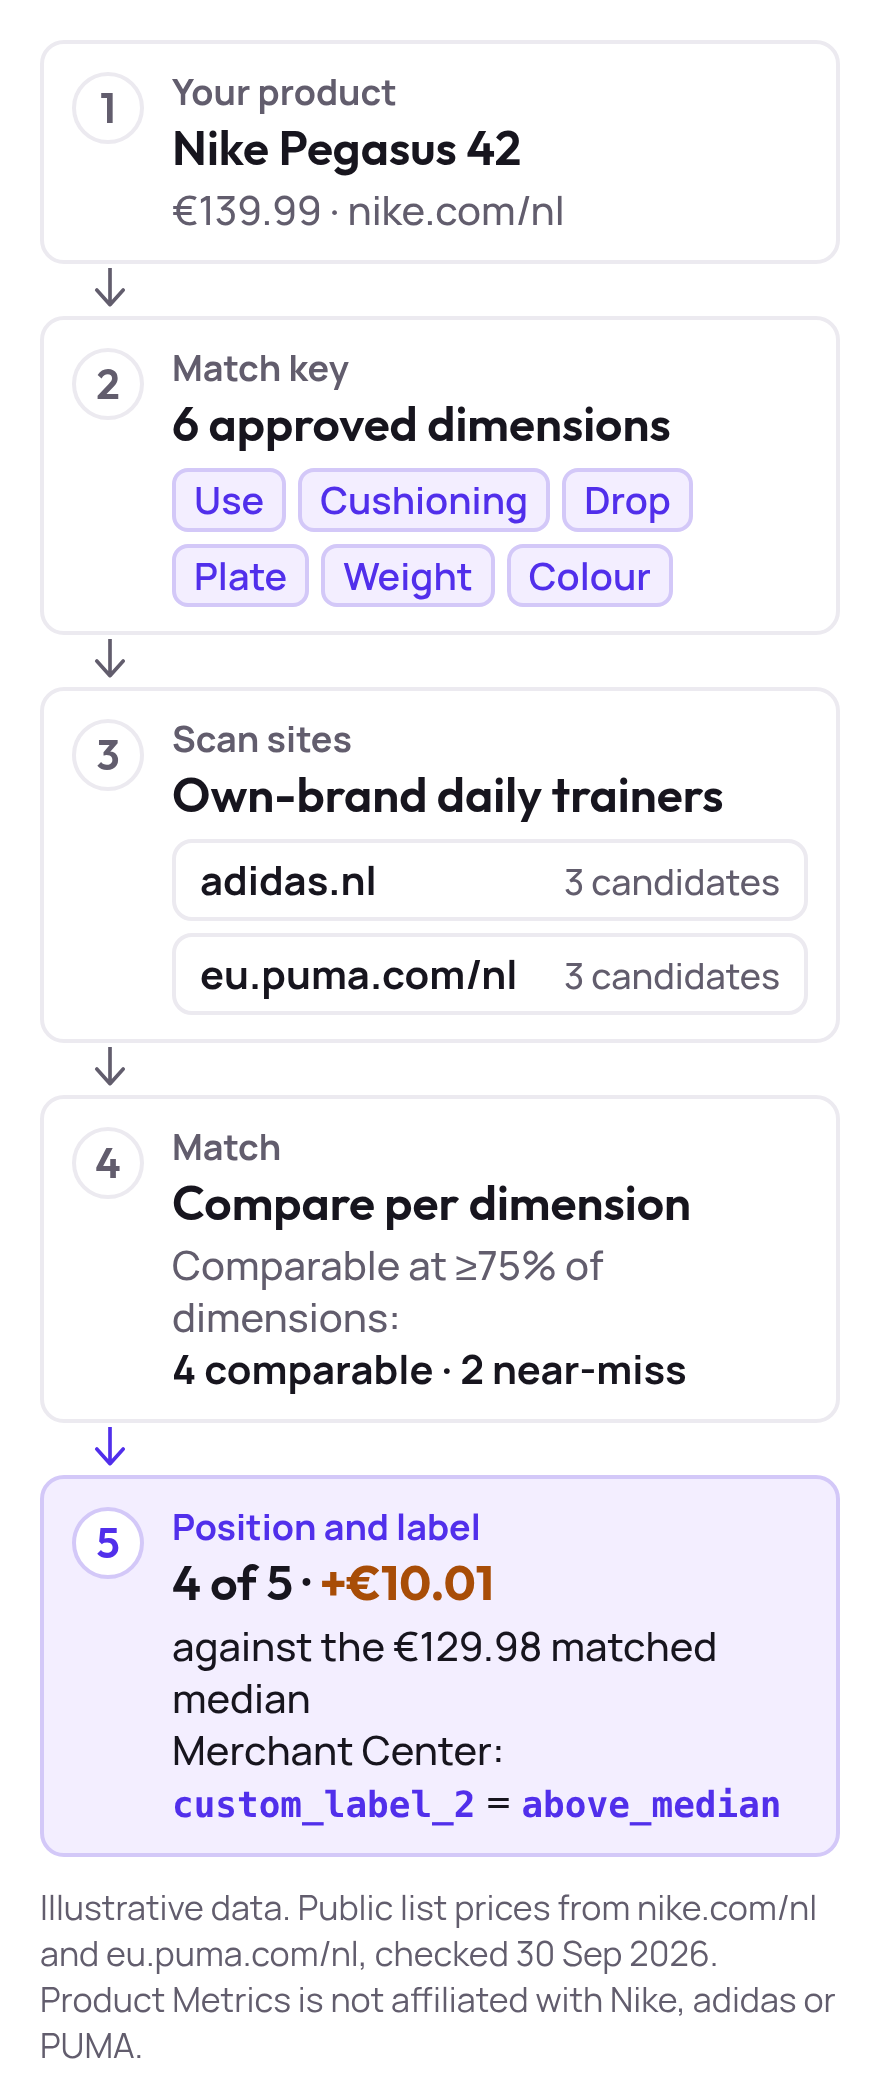
For how to run the comparison step by step, see how to track competitor prices for Google Shopping. Other tools can match similar products too: price monitoring software compared shows how.
6. What matching the median costs
A €10.01 gap sounds small. Next to margin it is not. The numbers below are illustrative: take a 44% contribution margin, the figure on the Competitor Prices page. The €139.99 price is €115.69 without 21% VAT, so variable costs (product, fulfilment, returns allowance) are 56% of that, €64.79, and contribution margin is €50.91 per pair.
At the €129.98 median, the price without VAT is €107.42. Costs stay €64.79, so contribution falls to €42.63, down 16%. The margin drops from 44.0% to 39.7%, and break-even ROAS (1 ÷ margin) rises from 2.27 to 2.52. The POAS equivalent: POAS is ROAS × contribution margin, so break-even POAS stays 1.0.
ROAS one trainer needs to break even at three prices
Show the dataHide the data
| Selling price (€, incl. VAT) | ROAS needed to break even |
|---|---|
| €139.99 (yours) | 2.27 |
| €129.98 (median) | 2.52 |
| €99.95 (cheapest) | 4.64 |
To earn the same total contribution after the match you need more orders: price cut ÷ (margin − price cut). A cut of 7.15% at a 44% margin needs 7.15 ÷ 36.85 = 19.4% more orders. At a 25% margin the same cut needs 40.1% more. To see what a new price leaves on one product, enter its cost and the price in the margin and markup calculator.
How many more orders a 7.2% price cut needs to keep the same profit (%)
Show the dataHide the data
| Contribution margin before the cut | Extra orders needed |
|---|---|
| 20% | 55.6% |
| 25% | 40.1% |
| 30% | 31.3% |
| 35% | 25.7% |
| 44% | 19.4% |
| 50% | 16.7% |
Now add performance, again from the Competitor Prices page: POAS of 1.40 against a target of 2.00. At the same orders and ad spend, matching the median lowers POAS to 1.17. Reaching 2.00 through price alone would take about 71% more orders at the same ad spend.
On these numbers a match widens the gap to target before it narrows it. Price may still be part of why the product misses target, and the calculation shows what testing that would cost. Our guide to break-even ROAS per product shows how to set that floor, and the break-even ROAS calculator does it for yours.
7. How do you get competitive pricing?
Five steps, and the last two tie the price to your margin.
- Match like with likeCompare products shoppers weigh against yours. Use GTIN for branded products and approved dimensions such as use, colour and weight for own brand.
- Put every price on one basisUse list prices without shipping, or loyalty prices throughout, and note the date you checked.
- Work out your price ratioDivide your price by the median of the matched products. 1.00 is the median, 1.08 is 8% above it.
- Price the match against marginRecalculate break-even ROAS and the orders needed at the matched price. Break-even POAS stays 1.0.
- Read it next to POAS, then recheckChoose a position on purpose, and compare again weekly or monthly. Prices move.
Then read your price ratio next to POAS. This guide treats a ratio within ±5% of 1.00 as “at” the median. That band is our convention, not a standard, so choose your own.
| Price ratio | POAS on target | POAS below target |
|---|---|---|
| Above, over 1.05 | The premium is holding. Note the gap and watch whether it widens. | The gap is one suspect. Compare it with stock, reviews and delivery, and read what a match would cost (section 6) first. |
| At, 0.95 to 1.05 | Price is not the issue. | Price is not the lever either. Look at margin, cost per click and conversion rate. |
| Below, under 0.95 | The low position is paying for itself. Watch your margin if the median moves. | Margin is the likely constraint. A low price raises break-even, so check that first. |
A position is affordable when POAS at the new margin stays at or above target. If it would not be, the problem lives in margin or costs, and matching prices will not reach it.
Sitting above the median is defensible when shoppers value something your matched dimensions miss, such as brand, service or stock, and POAS holds at your current price. Sitting at it makes sense when shoppers compare these products closely and POAS at the matched margin stays at or above target. Sitting below it needs the margin to pay: for a stated reason and end date, as with penetration, or because a basket pays, as with a loss leader.
This is how to read the numbers, not a recommendation to change any price. For the Pegasus, Competitor Prices would show the 4-of-5 position next to POAS, margin and stock, and that position can become a Merchant Center label your rules use to give products higher or lower priority. What you charge stays your call, and your feed prices stay as you set them.
8. What are the pros and cons of competitive pricing?
Three things work in its favour.
- A reference outside your own costs: Google’s benchmark exists because the market price is a signal: it is the price that “typically leads to more successful ad auctions, impressions, clicks, or conversions”.
- A number you can track: the price ratio is one figure per product, comparable week to week.
- It matches how shoppers compare: Which? compares the same basket across shops, and Google compares the same GTIN across retailers.
The recurring cost is margin. Matching lowers contribution per order, so section 6’s arithmetic applies to every product you follow downwards. That is why these mistakes are expensive:
- Comparing unlike products: a cheaper product that shoppers would not swap for yours is not a competitor price. Match first, as in section 5.
- Mixing price bases: loyalty prices, shipping and sale prices move the gap by several percent, as the Which? data shows.
- Chasing the lowest price: Apple’s annual report warns that “competitors have aggressively cut prices and lowered product margins”. Following them down is a margin decision, so make it on purpose.
- Copying a position without its model: Costco’s 11.12% gross margin works for Costco. Check yours with the numbers in section 6.
- Reacting to a snapshot: one day’s prices hide movement. Check on a schedule, as in the competitor price analysis template.
Start with ten products
Pick your ten highest-spend products. Match each to three or four comparable competitor products, put the prices on one basis and work out the price ratio. Then check break-even for each: set it with the break-even ROAS calculator and compare with POAS. For the vocabulary behind the process, read what price intelligence is, and see your own products with Competitor Prices.
Keep reading.
Competitor price analysis template (free spreadsheet)
Download a free competitor price analysis template: compare your prices with three competitors, see price position and ratio, and log changes weekly.
How to track competitor prices for Google Shopping
Track competitor prices when nobody sells your product: match own-brand products by dimensions, compare list prices, then read price position next to POAS.
Price monitoring software compared for Google Shopping
Ten ways to monitor prices compared on cost at 1,000 products, matching and update frequency: Merchant Center, Prisync, Pricefy, Wiser, Minderest and more.
Frequently asked questions.
What is a competitive price?
What does price competition look like in practice?
How do you get competitive pricing?
Should I match my competitors' prices?
See which of your products to push, fix or pause. Start with your own products, or a 30-second estimate.
Check one product first: work out its break-even ROAS in the calculator. Then see where all your products stand.
Not ready to connect? Book a demo: a video call with Berend, then a demo account.