 Log in with Google
How to track competitor prices for Google Shopping
Track competitor prices when nobody sells your product: match own-brand products by dimensions, compare list prices, then read price position next to POAS.
If you sell your own brand, you cannot look up a competitor’s price for the same product: nobody else carries it, so there is no barcode to match. You can still track competitor prices for Google Shopping. Compare your products with the alternatives shoppers weigh against them, then read where your price sits next to ad performance.
The method comes from Competitor Prices, the Product Metrics feature that matches own-brand products on dimensions instead of barcodes. For a small range, the same steps work in a spreadsheet.
Decide what “the same product” means
Competitor price tracking only works if you compare like with like. For branded products that is easy: the same GTIN is the same product. Google’s own price benchmarks in Merchant Center work this way, comparing against other retailers that sell the same GTIN.
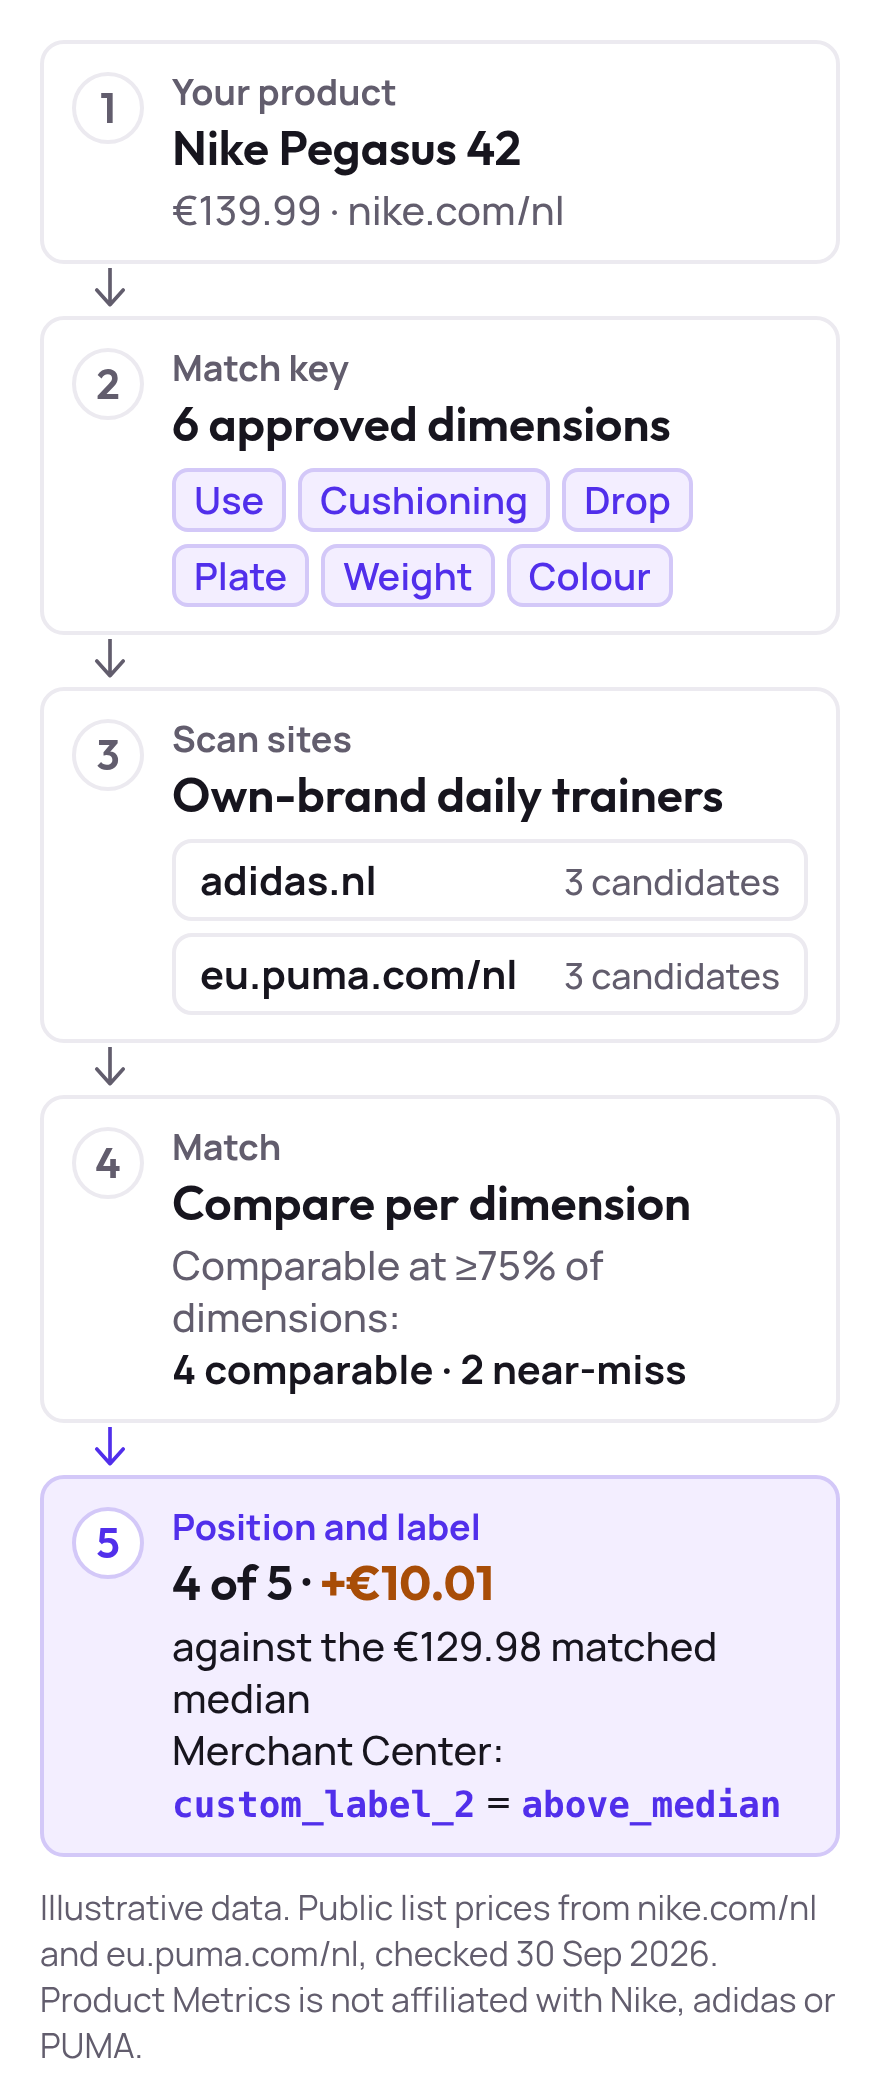
For own-brand products the barcode is yours alone, so GTIN matching returns nothing. Instead, compare on the dimensions your customers compare on. For a running trainer, that is use, cushioning, drop, plate, weight and colour. A Nike Pegasus 42 and an adidas Supernova Rise 3 share no barcode, yet a shopper weighs them against each other.
- Name the products you compareStart with the products that take most of your ad spend. A short list you act on beats a long list you ignore.
- Define what makes two products comparablePick the dimensions shoppers weigh in your category, such as use, cushioning, drop, plate, weight and colour.
- Find competitors' own-brand alternativesPick three to five competitors per category and shortlist their products that match on most dimensions.
- Compare list prices without shippingUse the same basis for every product, so the gap reflects price alone.
- Check again on a schedulePrices move. Weekly is a sensible start, daily for fast categories, monthly for slow ones.
Compare on the dimensions shoppers use
Pick them from how shoppers talk about the category rather than from the fields in your product data. Running shoes are judged on drop and cushioning, sofas on seat depth, coffee on roast and origin. Keep the list short, five to seven dimensions, and decide how many must match before two products count as comparable. Competitor Prices uses 75% of your approved dimensions, so one near-miss does not discard an otherwise good comparison.
Use one price basis
The basis has to be the same for every product. We compare list prices without shipping costs, so every product in a category is compared on its price alone. Note the date you checked: a price tracked last month is history.
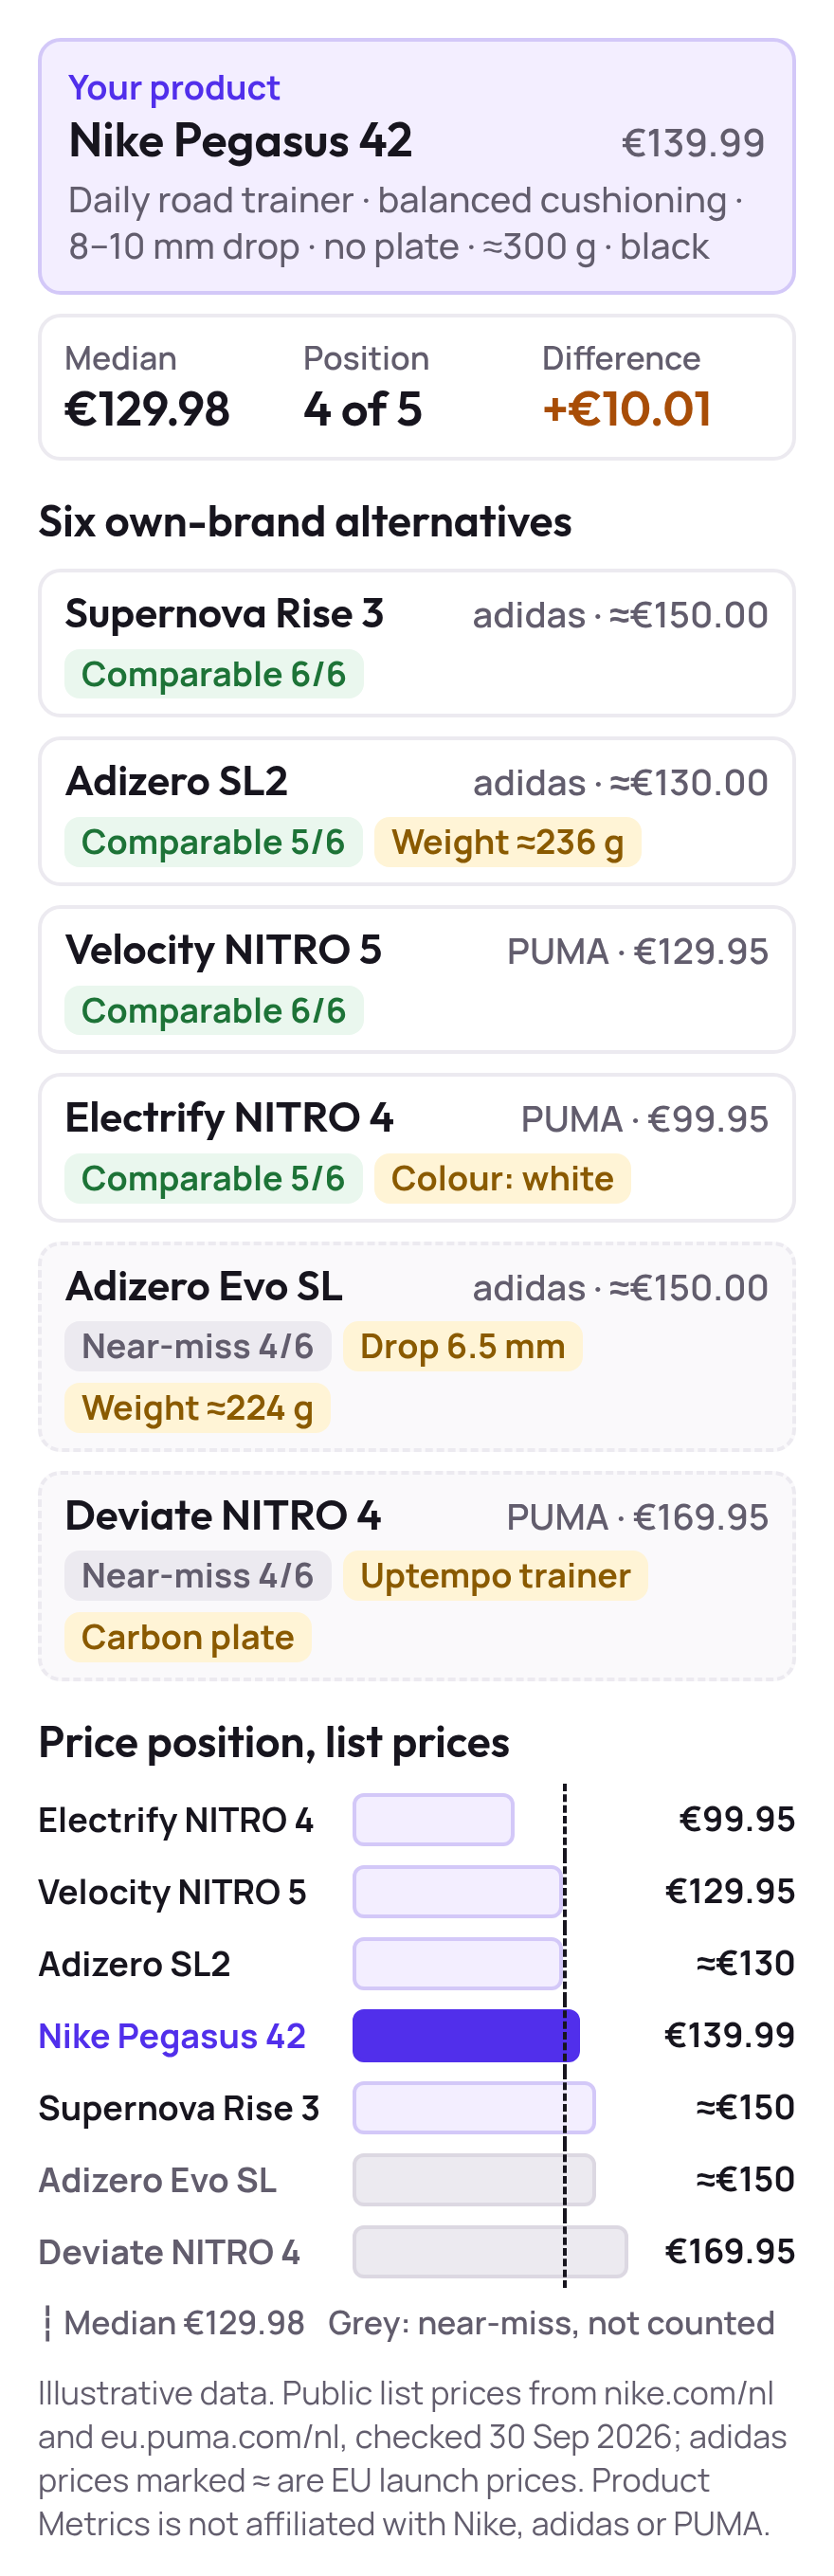
List price of the Nike Pegasus 42 and six rival daily trainers (€)
Show the dataHide the data
| Trainer | List price |
|---|---|
| PUMA Electrify NITRO 4 | €99.95 |
| PUMA Velocity NITRO 5 | €129.95 |
| adidas Adizero SL2 | €130.00 |
| Nike Pegasus 42 (yours) | €139.99 |
| adidas Supernova Rise 3 | €150.00 |
| adidas Adizero Evo SL | €150.00 |
| PUMA Deviate NITRO 4 | €169.95 |
Here four of the six alternatives match at least 75% of the approved dimensions. Their median is €129.98, so the €139.99 Pegasus 42 sits €10.01 above it. On its own that gap is no reason to cut the price; it is a question to put to the product’s margin and POAS.
A series shows what a snapshot can’t
A snapshot tells you where you stand today; a series shows where prices are heading. Keep one row per competitor product and one column per check, and plot them against your own price.
Three competitors' prices against your €139.99 over eight weeks (€)
- Competitor 1 price
- Competitor 2 price
- Competitor 3 price
- Your price (unchanged) (€139.99)
Show the dataHide the data
| Week | Competitor 1 price | Competitor 2 price | Competitor 3 price |
|---|---|---|---|
| Wk 1 | €142.00 | €150.00 | €169.95 |
| Wk 2 | €141.00 | €150.00 | €169.95 |
| Wk 3 | €136.00 | €150.00 | €159.95 |
| Wk 4 | €136.00 | €145.00 | €159.95 |
| Wk 5 | €124.95 | €145.00 | €159.95 |
| Wk 6 | €124.95 | €138.99 | €149.95 |
| Wk 7 | €124.95 | €138.99 | €149.95 |
| Wk 8 | €129.95 | €138.99 | €149.95 |
Eight weeks of checks show what any single one would miss. Competitor 1 went under you in week 3, then dropped another 8% (€136.00 to €124.95) in week 5 and partly recovered. Competitor 2 slid about 7% (€150.00 to €138.99) and now sits €1.00 under you. Competitor 3 stays above you throughout. Your price never moved, and you still went from cheapest to third of four.
Read price position next to POAS
Put a €10 gap next to margin, stock and ad results before you do anything with it. If the product gets clicks but misses its POAS target, a price above the median is one plausible reason. If it hits its target, the gap may be fine. Our guide to POAS vs ROAS explains why profit per product is the number to read the gap against, and what price intelligence is covers the difference between monitoring, intelligence and repricing.
For the Pegasus 42, Competitor Prices shows that €10.01 gap as a price position, a price ratio and a price difference, next to Product Score and the Merchant Center labels your campaigns can use. It shows where you stand, and your team decides what happens to the price.
Check on a schedule
Prices go stale quickly, so repeat the comparison regularly. Daily is 30 checks per product per month, weekly is 4 and monthly is 1. With the Price Monitoring add-on, one check of one product costs €0.004 excluding VAT.
| Schedule | Checks per product per month | Cost for 500 products, excl. VAT |
|---|---|---|
| Daily | 30 | €60.00 |
| Weekly | 4 | €8.00 |
| Monthly | 1 | €2.00 |
When a spreadsheet stops scaling
A spreadsheet works for a handful of products: our free competitor price analysis template has the formulas. Past a few dozen products, look for software, and check it against this list.
| Look for | Why it matters |
|---|---|
| Matching beyond GTIN | Own-brand products share no barcode with competitors |
| Price history, not only today’s price | Movement is the signal (see the eight-week chart above) |
| A schedule you control | Daily, weekly or monthly, by product |
| One stated price basis | List price, with or without shipping, the same for every product |
| A link to ad performance | A gap only matters next to margin and POAS |
| A predictable cost per check | The bill stays clear as your range grows |
Competitor Prices was built to that list. For a side-by-side of the options, see price monitoring software compared, and for the terms behind it, read what price intelligence is.
Start with ten products by hand
For real examples of how companies price against competitors, see competitive pricing examples. If the gaps on your own products turn out to matter, Competitor Prices tracks them for you, and the break-even ROAS calculator sets the targets to read them against.
To begin, list your ten highest-spend products, write down five dimensions per category and compare them once by hand.
Keep reading.
Competitor price analysis template (free spreadsheet)
Download a free competitor price analysis template: compare your prices with three competitors, see price position and ratio, and log changes weekly.
Price monitoring software compared for Google Shopping
Ten ways to monitor prices compared on cost at 1,000 products, matching and update frequency: Merchant Center, Prisync, Pricefy, Wiser, Minderest and more.
What is price intelligence? A Google Shopping guide
Price intelligence turns competitor prices into context for pricing and ad decisions. See the data it needs, three Shopping use cases and a worked example.
Frequently asked questions.
How do I compare my prices with competitors'?
What does competitor price tracking look like in practice?
How often should I track competitor prices?
Should I match my competitors' prices?
See which of your products to push, fix or pause. Start with your own products, or a 30-second estimate.
Check one product first: work out its break-even ROAS in the calculator. Then see where all your products stand.
Not ready to connect? Book a demo: a video call with Berend, then a demo account.