 Log in with Google
Google Ads Auction Insights: How to Read and Use It
How to download Google Ads auction insights, read impression share, overlap and outranking, and rank competitors with a free tool. Step by step.
Google Ads Auction Insights is the report that compares your ads with the other advertisers in the same auctions. For Shopping campaigns it shows three metrics: impression share, overlap rate and outranking share. To get it, tick your campaigns in Google Ads, select Auction insights and download the table as a CSV.
Google’s help page starts with the six Search statistics, and so do most guides to the report. This one starts with Shopping and Performance Max. It shows how to download the report, what each number means, how to read it against break-even ROAS and how to rank your competitors with the free tool at the end of the page.
We checked every Google Ads claim against Google Ads Help on 15 and 16 October 2026, and each page is linked in the sources. The euro figures are illustrative.
Quick answer: Google Ads auction insights in three steps
- Open it: in Google Ads, go to Campaigns, tick your Shopping or Performance Max campaigns and select Auction insights.
- Download it: set the date range to the last 90 days, add a Week time segment and use the download icon above the table to save a CSV.
- Read and act on it: rank competitors by overlap rate and outranking share, then increase priority only where the campaign’s ROAS clears its break-even ROAS. The free Auction Insights tool below does the ranking from your CSV.
Part 1: How to download the auction insights report in Google Ads
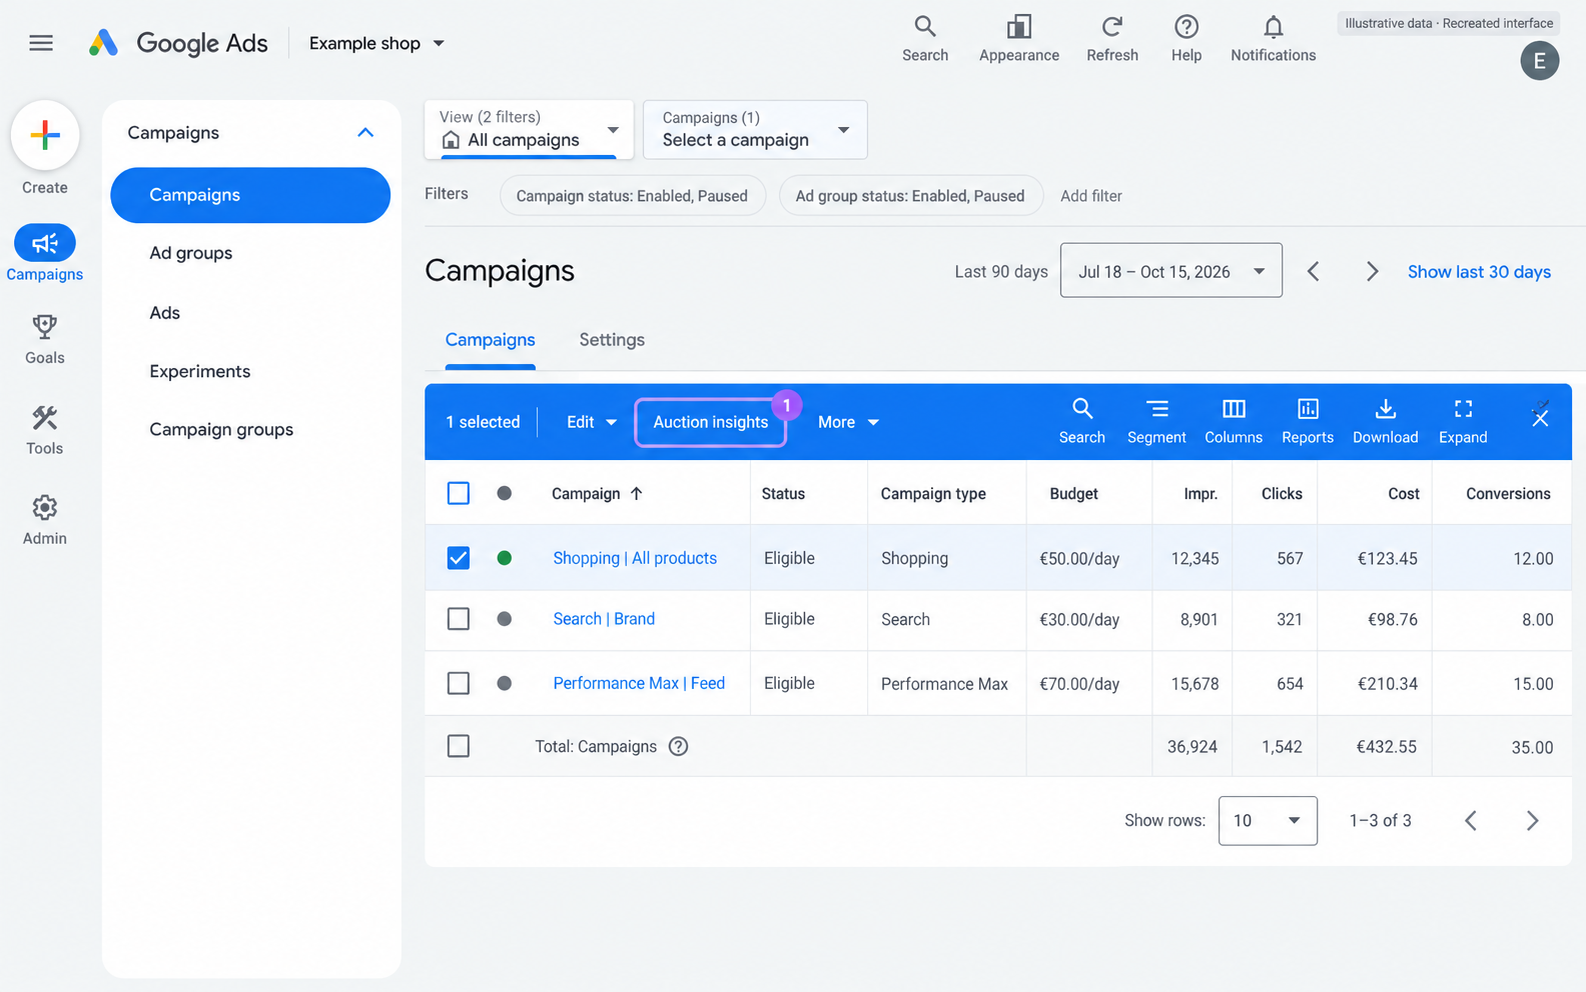
1. Select your campaigns and open Auction insights
- In Google Ads, open the Campaigns menu, expand Campaigns and select the Campaigns table. You can also use the Ad groups table for Shopping campaigns.
- Tick the box next to each campaign or ad group you want in the report. Shopping reports work for ad groups and campaigns, and Performance Max reports for campaigns. Keyword reports are for Search campaigns.
- Select Auction insights. If you ticked a mix of Search, Shopping and Performance Max campaigns, choose “Shopping campaigns” in the dropdown. Performance Max impressions are then split into “Search” and “Shopping”.
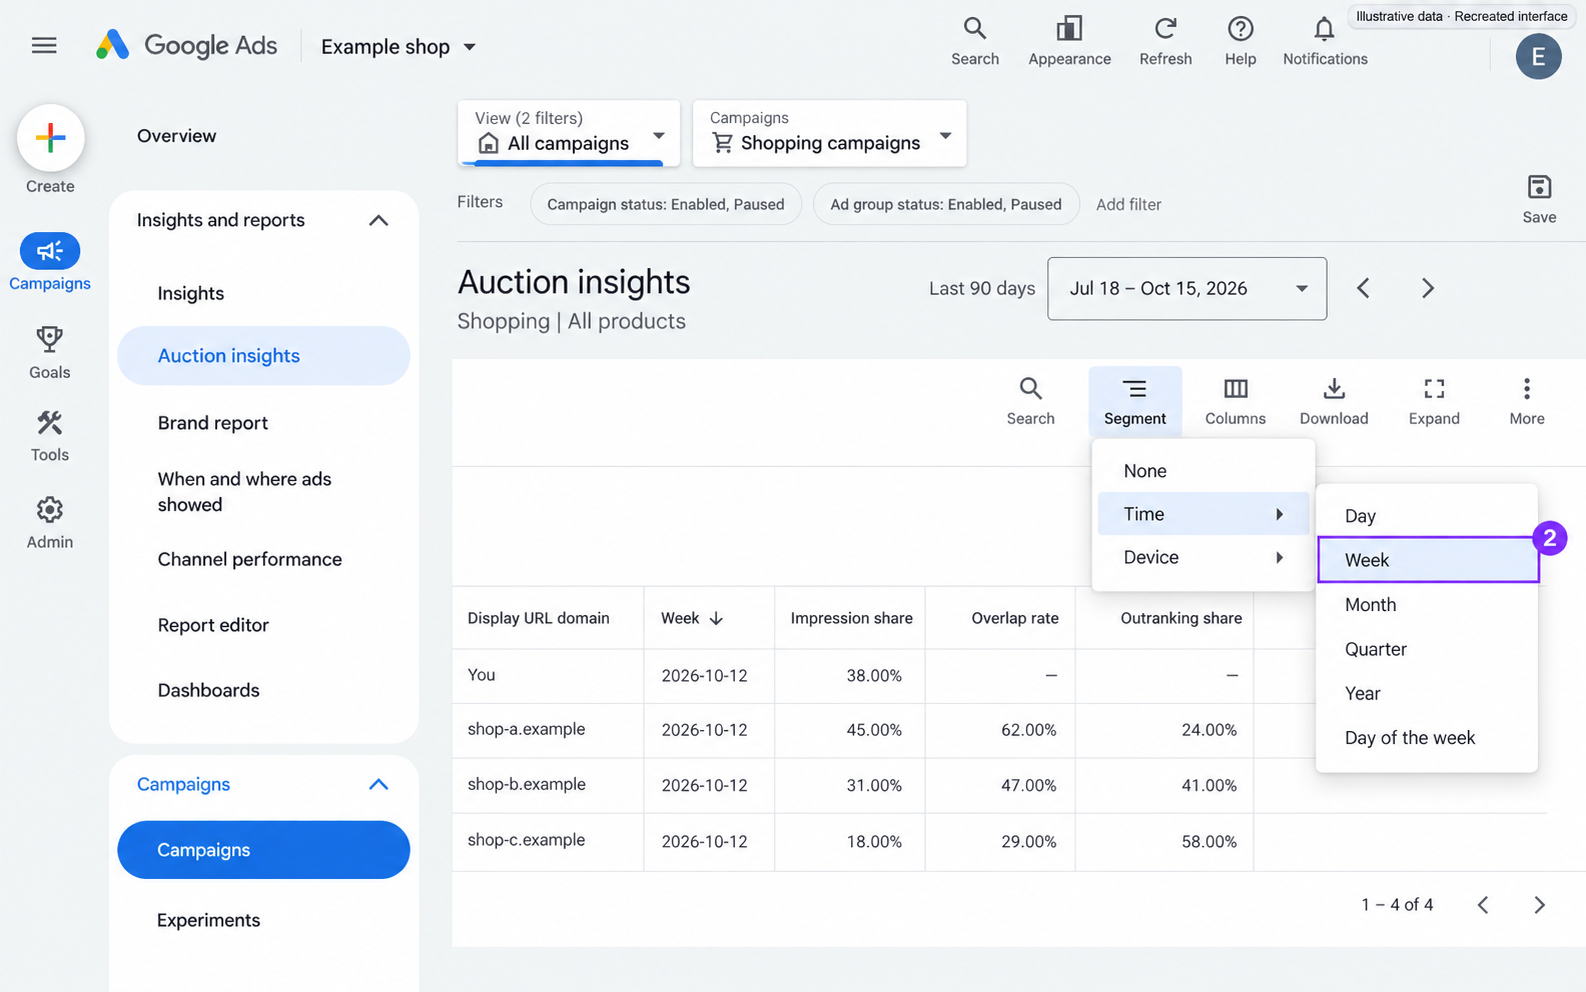
2. Set the last 90 days and segment by week
- Set the date range to the last 90 days.
- Select the segment icon, then Time, and choose Week (Use segments in your tables). Google segments Shopping auction insights by time and device.
3. Download the weekly report as Excel CSV
- Select the download icon in the upper right corner above the table, then Download, and choose a format such as Excel CSV.
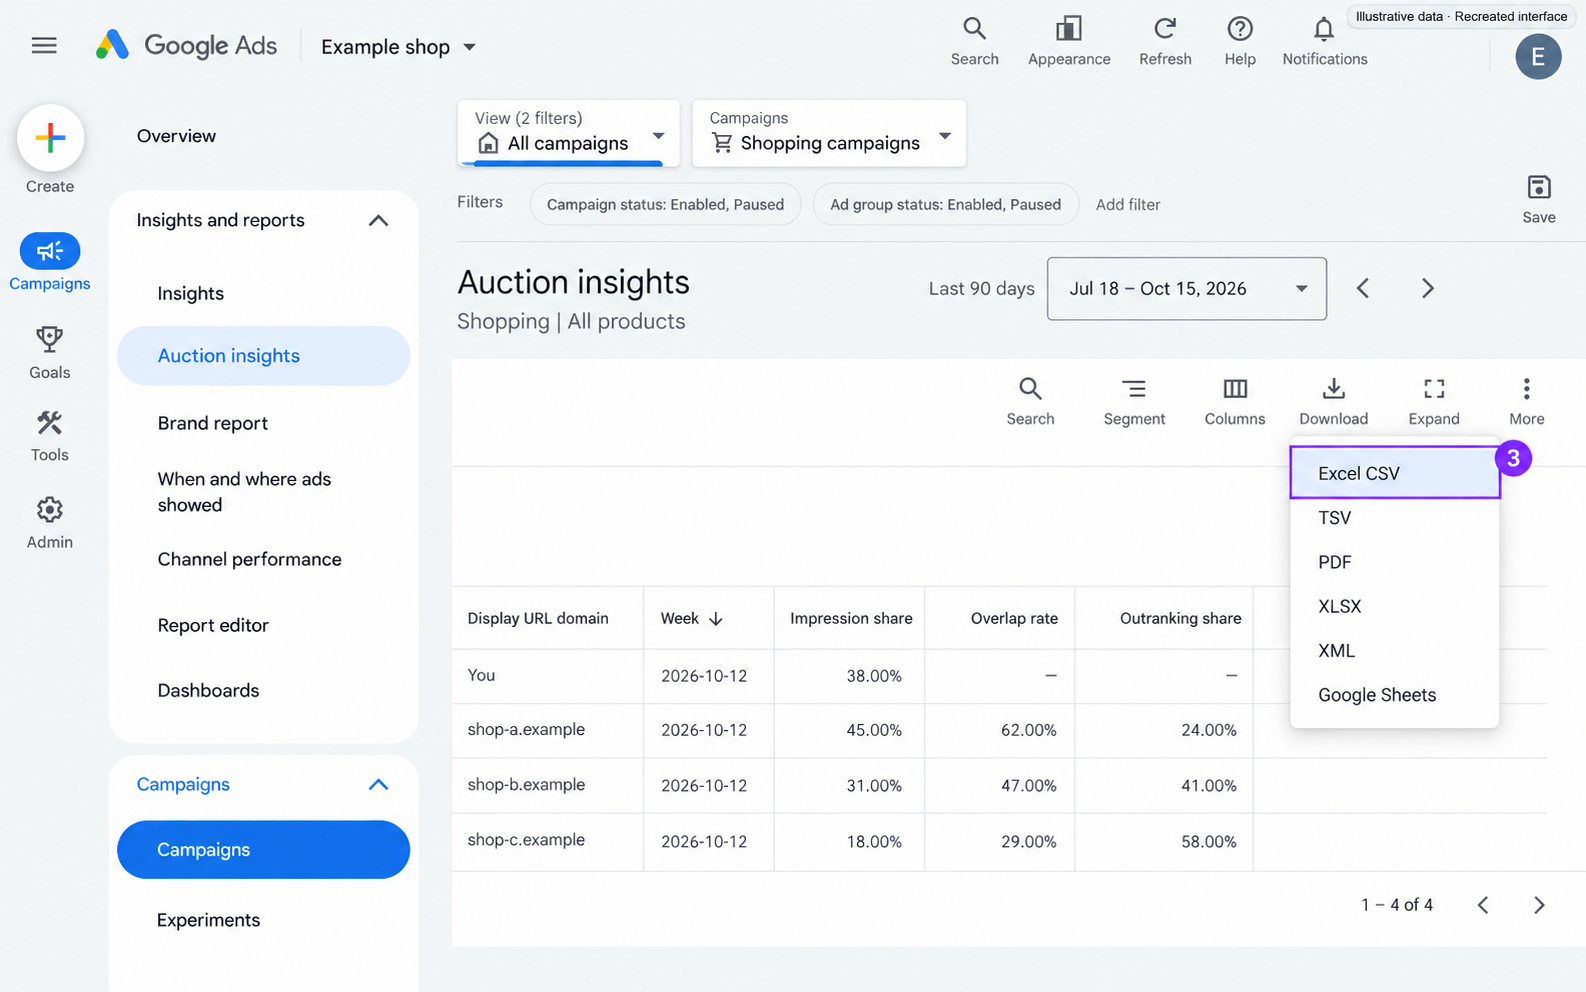
Segments you apply show up in the downloaded report as rows, so a Week segment gives one row per competitor per week. These are the settings we use for an export the tool can read.
| Setting | Our choice | Why |
|---|---|---|
| Level | One or more campaigns | A campaign has more auctions than one ad group, so it is more likely to pass Google’s minimum activity threshold. |
| Date range | Last 90 days | About 13 weeks: enough points for a trend, recent enough to reflect your current set-up. This is our choice, not a Google rule. |
| Time segment | Week | One row per competitor per week gives the tool its trend line. Google allows Day only for date ranges of 16 days or less. |
| Format | Excel CSV | The tool reads comma-separated files and UTF-16 tab-separated exports. |
If the report stays empty, Google Ads Help gives two reasons: it shows no insights when your impression share is below 10%, and campaigns and ad groups need a minimum threshold of activity for the period you selected. Try a longer date range, or the campaign instead of a single ad group.
Part 2: Upload the export to the free tool
The Auction Insights tool at the end of this page reads your CSV in the browser. The file isn’t uploaded to a server or stored. Drop it on the tool or pick it with the file button. It needs four columns and uses two more when they are there.
| Column in your export | Needed | What the tool does with it |
|---|---|---|
| Display URL domain | Yes | Names each competitor. |
| Impression share | Yes | One of the three inputs of the power score. |
| Overlap rate | Yes | Power score input, and one axis of the threat map. |
| Outranking share | Yes | Power score input, and the win or lose side of the threat map. |
| Day, Week or Month | Optional | Draws the trend of each competitor over time. |
| Campaign | Optional | Adds a campaign filter. |
The tool handles UTF-16 tab-separated exports and cells exported as “< 10%”. After it has read the file, you can filter by campaign, choose how many competitors to show and download the ranking as a CSV.
Part 3: Read the auction insights metrics
Auction Insights shows six statistics for Search campaigns and three for Shopping campaigns. Each row below your own is another advertiser that took part in the same auctions. The definitions are shortened from Google Ads Help, and the last column is our reading.
| Statistic | What Google says it measures | Search | Shopping | How to read it |
|---|---|---|---|---|
| Impression share | Your impressions divided by the impressions you were eligible to receive. For competitors, measured against the auctions they were eligible for. | Yes | Yes | Reach. A gap is an opportunity only where the return clears break-even. |
| Overlap rate | How often another advertiser’s ad received an impression when yours did too. | Yes | Yes | Who you meet. It says nothing about who wins. |
| Outranking share | How often your ad ranked higher in the auction than theirs, or showed when theirs didn’t. | Yes | Yes | Who wins when you meet. Read it next to overlap. |
| Position above rate | How often their ad was shown higher than yours when both showed. | Yes | No | Search only. |
| Top of page rate | How often an ad showed above the unpaid results. | Yes | No | Search only. |
| Absolute top of page rate | How often an ad was the very first ad above the organic results. | Yes | No | Search only. |
Google’s own examples help. An overlap rate of 60% means that in 6 of every 10 times your ad showed, the other advertiser’s ad showed as well. An outranking share of 20% means your ad won over theirs in 2 of every 10 auctions you entered together.
A row may show “google.com”. Google says that happens when an advertiser uses Google-hosted domains or Google Business Profile, or when its landing page is a Google Site.
Read overlap rate and outranking share together
Overlap rate tells you which competitors you meet, and outranking share tells you how often you win when you do. Read both for each competitor. This grid is our reading, not Google’s, and the free tool’s threat map uses the same four boxes.
| Overlap rate | Outranking share | What it suggests |
|---|---|---|
| High | High | You meet this competitor often and mostly win. Check whether the return justifies more share. |
| High | Low | The competitor you most need to understand. Check price and product data before anything else. |
| Low | High | Rarely meets you. Low priority. |
| Low | Low | A small overlap you lose. Look only if the products matter. |
In the tool, high overlap means above the median of the competitors in your file, and the line between winning and losing is an outranking share of 50%. Both lines come from your own export, not from a Google benchmark.
Neither number tells you why you lose. Google says the overall quality and relevance of your Shopping offers factor into eligibility, and its tips for impression share name budget, bids and product data (Improve your impression share).
Shopping has its own prominence measure
Shopping campaigns have absolute top impression share, but it sits in the campaign columns, not in Auction Insights. Google defines it as the percentage of your Shopping ad impressions shown in the most prominent Shopping position, and reports it for campaigns, ad groups and product groups (About impression share).
Shopping impression share also counts differently from Search. When several of your Shopping ads could show in one auction, only your first impression per search counts, so you are not credited twice.
What the Shopping report shows, and what it leaves out
The Shopping report is available for ad groups and campaigns, with segments for time and device, and only from the Search Network. Google Ads Help describes nothing for Shopping by product, brand, category or custom label. The table sets the Shopping report next to the Performance Max report.
| Detail | Shopping | Performance Max |
|---|---|---|
| Report level | Ad groups and campaigns | Campaigns, and the account level. Also in Report Editor. |
| Statistics | Impression share, overlap rate, outranking share | Search and Shopping ads data. Google does not list the statistics. |
| Segments | Time and device | Search and Shopping |
| Traffic | Search Network only | “Search and Shopping ads served on the Search Network or after November 2021” |
| History | From October 2014 | Not stated separately |
| By product or label | Not described | Not described |
Search partners are excluded, and Google gives no number for the activity threshold. Your impression share in the report can also differ slightly from the campaign view, which Google puts down to Auction Insights filtering out auctions with very low impressions.
A competitor’s figure can differ from what that competitor sees in its own report, because its eligible auctions only partly overlap with yours. Google’s example: you show 100%, while the competitor has 50% in its own eligible auctions. For product-level impression share on Shopping, the Product Groups tab is the nearest thing. It shows only your own figure, and only for product groups with enough volume.
Performance Max: campaign level, split by Search and Shopping
For Performance Max, Google documents an Auction Insights report per campaign with impressions segmented by Search and Shopping. Impression share is Search plus Shopping impressions divided by eligible Search plus Shopping impressions. We read that as meaning the other places Performance Max serves are not part of the report.
The Listing groups tab of an asset group reports product-level data, and its numbers can differ from the Campaign tab (Google Ads Help). That tab has no competitor columns.
So the campaign is the unit you can read. We suggest one campaign per group of products you want to read separately, for example per margin band or per segment. That works against Google’s guidance that “performance will generally improve if you run fewer, larger campaigns that get more conversions” (About Target ROAS bidding), so weigh it against your conversion volume. Our guides on Performance Max for ecommerce and target ROAS from margin show how to size the split.
How the competitor power score works
The competitor power score is our composite, not a Google metric. It is the mean of three numbers from your export: the competitor’s impression share, its overlap rate and 1 − your outranking share. We call that last number “not outranked by you”: the share of the auctions you both entered in which you did not outrank them.
Illustrative data: four competitors from one Shopping campaign. Power score = (impression share + overlap rate + not outranked by you) ÷ 3.
| Competitor | Impression share | Overlap rate | Your outranking share | Not outranked by you | Power score |
|---|---|---|---|---|---|
| A | 62% | 55% | 30% | 70% | 62.3% |
| B | 35% | 70% | 65% | 35% | 46.7% |
| C | 80% | 12% | 45% | 55% | 49.0% |
| D | 20% | 25% | 85% | 15% | 20.0% |
Competitor A leads: it meets you often and you outrank it in only 30% of shared auctions. Competitor C ranks second with 12% overlap, because its impression share is high. That share is measured against the auctions C was eligible for, not yours, so read the score next to overlap rate. The median overlap of the four is 40%, so the threat map puts A and B on the high-overlap side, and of those two only A on the losing side.
Part 4: Act on auction insights with break-even ROAS as the floor
Act on Auction Insights only where the campaign’s return clears its break-even ROAS. More impression share for a campaign that loses money on each sale loses more money. These six steps take you from the report to a decision per product.
- Find the competitors you meet mostSort by overlap rate. A competitor at 5% overlap rarely matters. The tool counts a competitor as high overlap when it sits above the median of your file.
- Check who wins those auctionsAn outranking share below 50% means you outranked that competitor in fewer than half of the auctions you both entered.
- Separate budget from rankAuction Insights doesn't say why you lose. The campaign columns Search lost IS (budget) and Search lost IS (rank) show whether you lost impressions to budget or to Ad Rank.
- Put break-even ROAS next to the campaign's ROASBreak-even ROAS is 1 ÷ contribution margin. More impression share is only worth buying where the return clears it.
- Go to product levelIn a contested campaign, check price position and product data first. Lower priority for low-margin products you keep losing, and increase priority for high-margin products that clear break-even.
- Change one thing, then read the report againGive it a conversion cycle and compare the same campaign over a period of the same length. Save the ranking each month: a competitor whose power score keeps rising matters more than one that is high and flat.
Separate budget from rank
Auction Insights names the competitor, not the reason you lose. Two campaign columns get closer. Search lost IS (budget) is the share of time your ads weren’t shown because the budget ran out, and Search lost IS (rank) the share lost to Ad Rank. Google reports both for Shopping campaigns (Get impression share data).
A campaign that loses share to budget needs a budget decision. A campaign that loses to rank against a high-overlap competitor needs a look at price and product data first, starting with Google Shopping feed optimisation.
Break-even ROAS sets the floor
Impression share says how much of the available demand a campaign reached. It doesn’t say whether reaching more is worth it, and break-even ROAS does. Break-even ROAS is 1 ÷ contribution margin: a product with a 15% contribution margin needs a ROAS of 6.67 to cover its costs, and one with a 45% margin needs 2.22. The profit equivalent is POAS, where break-even is 1.0 (POAS vs ROAS).
Replace the numbers in this widget with your own campaign’s, or use the break-even ROAS calculator. The preset is campaign C from the example below.
Below break-even
Below break-even: ROAS 4 is under the 6.67 you need. After ads you lose €10.00 of every €100 of revenue.
- Contribution margin
- 15.0%
- €15.00 per order
- Break-even ROAS
- 6.67
- 1 ÷ margin
- POAS
- 0.60
- ROAS × margin. 1.00 is break-even.
- Left per €100 of revenue after ads
- -€10.00
- Target ROAS for the profit to keep
- 666.67%
- With no profit kept, target ROAS is 666.67%, equivalent to the break-even ROAS. A bidding target does not guarantee break-even; compare achieved return on the same revenue and cost basis.
Illustrative data: campaign C, a 15% contribution margin at a ROAS of 4
Per order, excl. VAT. For several products or VAT, use the break-even ROAS calculator.
A worked example in euros
Take a shop with three Shopping campaigns split by margin band. The month’s figures are invented to show the pattern.
Illustrative data: one month for three Shopping campaigns. Revenue is what the ads generated. Profit after ads is revenue × contribution margin − ad spend, so it deducts product and variable costs and the ad spend, but not fixed costs. All amounts are excl. VAT.
| Campaign | Contribution margin | Break-even ROAS | ROAS | Impression share | Ad spend | Revenue | Profit after ads |
|---|---|---|---|---|---|---|---|
| A | 45% | 2.22 | 5.00 | 38% | €3,000 | €15,000 | €3,750 |
| B | 25% | 4.00 | 4.40 | 62% | €5,000 | €22,000 | €500 |
| C | 15% | 6.67 | 4.00 | 71% | €4,000 | €16,000 | −€1,600 |
| Account | 4.42 | €12,000 | €53,000 | €2,650 |
Impression share by campaign, three margin bands
Show the dataHide the data
| Campaign | Impression share |
|---|---|
| A: 45% margin | 38% |
| B: 25% margin | 62% |
| C: 15% margin | 71% |
The account ROAS of 4.42 looks healthy, and campaign C has the best impression share. Yet C loses €1,600 after ad spend, because each €1 of spend returns €4.00 of revenue and only €0.60 of contribution. Campaign A is the opposite: each €1 returns €5.00 of revenue and €2.25 of contribution, so it adds €1.25 of profit after ads per euro spent.
ROAS against break-even ROAS, by campaign
- ROAS
- Break-even ROAS
Show the dataHide the data
| Campaign | ROAS | Break-even ROAS |
|---|---|---|
| A: 45% margin | 5.00 | 2.22 |
| B: 25% margin | 4.40 | 4.00 |
| C: 15% margin | 4.00 | 6.67 |
The reading is to increase priority for campaign A, where an impression share of 38% leaves room, and lower priority for campaign C, where winning more auctions loses more money. Those are upper bounds. The next impression can cost more than the average one, so move in steps and read the report again (target ROAS pacing).
Check price when a competitor outranks you
When a competitor has high overlap and you win little of it, check price, product data and priority for the products involved. Auction Insights points at the competitor, and price is the one you can measure from outside Google Ads.
Google’s price benchmark in Merchant Center covers products with a valid GTIN and describes the benchmark as the average price that typically leads to more successful ad auctions (Google Merchant Center Help). Own-brand products often have no shared GTIN, which is why Competitor Prices matches them by style, colour and dimensions you approve instead.
It then gives each product a price position next to its POAS, margin and stock. Illustrative data from the Competitor Prices example: a Nike Pegasus 42 at €139.99 sits €10.01 above a matched median of €129.98, a price ratio of 1.08, comparing list prices without shipping costs. Price position can become a Merchant Center label, so campaigns built on labels carry it. Your team decides every price.
Auction Insights tells you who. Price position tells you, product by product, what they charge. Our guide to tracking competitor prices for Google Shopping shows how to compare them.
Decision grid: impression share, return and price position
This grid combines the three signals for one campaign. It is our rule of thumb and assumes the ROAS is read after the conversions have arrived.
| Impression share | Return against break-even | Price position | What to do |
|---|---|---|---|
| Low | Above | At or below the median | Increase priority, and check whether budget limits it. |
| Low | Above | Above the median | Check price and product data before spending more. |
| High | Above | Any | Hold. Watch competitors whose overlap is growing. |
| High | Below | Any | Lower priority. Fix margin or price before you buy more reach. |
Product Segmentation segments each product by advertising clicks and ROAS, or POAS once you connect margins, and writes the segment to a Merchant Center label. Campaigns built on those custom labels make each Auction Insights report a read on one kind of product. The Performance Max page shows how that looks.
Where to start
Open Auction Insights for your largest Shopping or Performance Max campaign, and write down its impression share and the competitor with the highest overlap. Then work out that campaign’s break-even ROAS from its products’ margins, with the calculator or break-even ROAS per product. If the return clears break-even, the impression share gap is worth closing. If it doesn’t, the report has told you where not to grow.
For the wider picture, how to optimise Google Shopping ads covers the feed and the review routine, and Google Shopping management covers when software helps.
Search volume for auction insights in the US and the Netherlands
People search for this report by its name far more than with questions about it. In the US, “google ads auction insights” gets 2,900 searches a month, and seven ways of writing the name get 7,900 between them.
US monthly searches for Auction Insights keywords
Show the dataHide the data
| Keyword | Monthly searches |
|---|---|
| google ads auction insights | 2,900 |
| auction insights | 1,600 |
| google adwords auction insights | 1,500 |
| auction insights google ads | 600 |
| adwords auction insights | 450 |
| google auction insights | 450 |
| auction insights in google ads | 400 |
| auction insights limitations | 80 |
| google ads auction insights report | 80 |
In the Netherlands, Ahrefs shows 10 searches a month for three terms (“google ads auction insights”, “auction insights google ads” and “auction insights”) and 0 for the other 51 Dutch rows. The file also gives each term’s global volume: 3,300 a month for “google ads auction insights”.
Free Auction Insights tool: rank your Shopping competitors
Drop your Auction Insights CSV here to get the competitor power ranking, the threat map, a trend chart when the export has a time segment, and a table you can download. The file is read in your browser and isn’t uploaded or stored.
Your biggest rival: runnersplanet
runnersplanet has the highest competitor power, 53.6%. It shows in 50.1% of the auctions you show in, and your outranking share against it is 34.9%.
Illustrative data
- Competitor power
- 53.6%
- Mean of impression share, overlap rate and not outranked by you
- Your impression share
- 57.6%
- Mean of the You row
- Competitors
- 6
- Domains merged by shop name
- Periods
- 13
- Distinct periods in this view
Competitor power, top 6
Show the dataHide the data
| Competitor | Competitor power |
|---|---|
| runnersplanet | 53.6% |
| trailshop | 41.8% |
| sportdepot | 40.9% |
| pacegear | 30.1% |
| marathonmarket | 27.9% |
| kidsrun | 18.0% |
Competitor power per period
- runnersplanet
- trailshop
- sportdepot
Show the dataHide the data
| Period | runnersplanet | trailshop | sportdepot |
|---|---|---|---|
| 13 Jul | 50.3% | 42.7% | 41.0% |
| 20 Jul | 51.5% | 43.1% | 41.6% |
| 27 Jul | 51.0% | 41.9% | 40.5% |
| 3 Aug | 52.7% | 43.0% | 41.7% |
| 10 Aug | 51.9% | 41.4% | 40.3% |
| 17 Aug | 53.3% | 42.1% | 41.1% |
| 24 Aug | 54.0% | 42.2% | 41.3% |
| 31 Aug | 53.4% | 40.8% | 40.1% |
| 7 Sep | 54.8% | 41.5% | 40.9% |
| 14 Sep | 55.7% | 41.8% | 41.3% |
| 21 Sep | 55.4% | 40.7% | 40.4% |
| 28 Sep | 56.6% | 41.2% | 41.0% |
| 5 Oct | 56.5% | 40.5% | 40.4% |
Illustrative data: fictional shops, until you load your own export.
Competitor power is our composite, not a Google metric. Auction insights covers only the auctions you took part in, so it does not describe the whole market.
Threat map
Rows split at the median overlap rate in this view (25.1%). Columns split at 50% not outranked by you. This reading is ours, not Google's.
Understand first
High overlap, mostly not outranked by you
- runnersplanet50.1% overlap, 65.1% not outranked
- sportdepot32.1% overlap, 54.1% not outranked
Head-to-head you win
High overlap, mostly outranked by you
- trailshop44.5% overlap, 38.9% not outranked
Small overlap you lose
Low overlap, mostly not outranked by you
- pacegear18.1% overlap, 50.1% not outranked
- marathonmarket12.5% overlap, 61.3% not outranked
Rarely meets you
Low overlap, mostly outranked by you
- kidsrun9.5% overlap, 28.9% not outranked
Competitor table
- 1runnersplanet53.6%
runnersplanet.example
- Impression share
- 45.7%
- Overlap
- 50.1%
- Not outranked by you
- 65.1%
- Periods
- 13
You meet often and mostly don't rank above them. Check price and product data first.
- 2trailshop41.8%
trailshop.example
- Impression share
- 41.9%
- Overlap
- 44.5%
- Not outranked by you
- 38.9%
- Periods
- 13
You meet often and mostly rank above them. Check whether the return justifies more share.
- 3sportdepot40.9%
www.sportdepot.example, shop.sportdepot.example
- Impression share
- 36.5%
- Overlap
- 32.1%
- Not outranked by you
- 54.1%
- Periods
- 13
You meet often and mostly don't rank above them. Check price and product data first.
- 4pacegearFew periods30.1%
pacegear.example
- Impression share
- 22.1%
- Overlap
- 18.1%
- Not outranked by you
- 50.1%
- Periods
- 2
Seen in few periods; treat as noise. A small overlap you lose. Look only if the products matter.
- 5marathonmarket27.9%
marathonmarket.example
- Impression share
- < 10%
- Overlap
- 12.5%
- Not outranked by you
- 61.3%
- Periods
- 13
A small overlap you lose. Look only if the products matter.
- 6kidsrun18.0%
kidsrun.example
- Impression share
- 15.5%
- Overlap
- 9.5%
- Not outranked by you
- 28.9%
- Periods
- 13
Rarely meets you. Low priority.
| # | Competitor | Power | Impression share | Overlap | Not outranked by you | Periods | What it means |
|---|---|---|---|---|---|---|---|
| 1 | runnersplanetrunnersplanet.example | 53.6% | 45.7% | 50.1% | 65.1% | 13 | You meet often and mostly don't rank above them. Check price and product data first. |
| 2 | trailshoptrailshop.example | 41.8% | 41.9% | 44.5% | 38.9% | 13 | You meet often and mostly rank above them. Check whether the return justifies more share. |
| 3 | sportdepotwww.sportdepot.example, shop.sportdepot.example | 40.9% | 36.5% | 32.1% | 54.1% | 13 | You meet often and mostly don't rank above them. Check price and product data first. |
| 4 | pacegearFew periodspacegear.example | 30.1% | 22.1% | 18.1% | 50.1% | 2 | Seen in few periods; treat as noise. A small overlap you lose. Look only if the products matter. |
| 5 | marathonmarketmarathonmarket.example | 27.9% | < 10% | 12.5% | 61.3% | 13 | A small overlap you lose. Look only if the products matter. |
| 6 | kidsrunkidsrun.example | 18.0% | 15.5% | 9.5% | 28.9% | 13 | Rarely meets you. Low priority. |
Not outranked by you = 1 − your outranking share against that competitor. Competitors seen in fewer than 3 periods are flagged: one-off appearances skew averages.
Sources
- Use auction insights to compare performance, Google Ads Help
- About impression share, Google Ads Help
- Get impression share data and Improve your impression share, Google Ads Help
- Create, save, and schedule reports from your statistics tables and Use segments in your tables, Google Ads Help
- Manage a Performance Max campaign with listing groups, Google Ads Help
- Performance Max feature compatibility and About Target ROAS bidding, Google Ads Help
- About Pricing in Merchant Center Analytics, Google Merchant Center Help
- Keyword volumes: Ahrefs Keywords Explorer, US and NL, 16 October 2026
- Search results and page types: Ahrefs SERP overview for “google ads auction insights”, US, 15 October 2026
Keep reading.
Google Shopping Category Explained for Retailers
Learn what a Google Shopping category is, how to pick the right one, and how it shapes feed performance, policies, and PMax results.
How Google Shopping ads work, from feed to sale
How Google Shopping ads work: Merchant Center, the campaign, the auction, where ads show and how a click and a sale are recorded. Sourced from Google.
Customer Match for Google Shopping: A Practical Guide (2026)
Use Customer Match in Google Shopping and Performance Max: eligibility, CSV template, local hashing, lifecycle goals and a free audience profit sheet.
Frequently asked questions.
What is Google Ads auction insights?
Is Google AdWords Auction Insights a different report?
Which Auction Insights metrics are available for Shopping campaigns?
Why is my auction insights report empty?
Can I see competitors' bids in Auction Insights?
Can I see Auction Insights for Performance Max?
Can I see Auction Insights per product?
What is a good impression share?
See which of your products to push, fix or pause. Start with your own products, or a 30-second estimate.
Check one product first: work out its break-even ROAS in the calculator. Then see where all your products stand.
Not ready to connect? Book a demo: a video call with Berend, then a demo account.