
Ecommerce solution software: types and how to choose
Ecommerce solution software compared by type, from storefronts to profit tools, with a scoring rubric and a two-week pilot to run before you buy.
Ecommerce solution software is the set of tools that runs an online sale: the storefront, payments, order management, product data, ad feeds and the reporting that says what each product earned.
Most stores already own most of these. What’s missing is usually the link between them, so a bestseller looks like a winner until the refunds arrive.
My rule: judge every tool on evidence from your own products, never on a demo. The worked example uses illustrative numbers; every market figure links to its source.
What types of ecommerce solution software are there?
Ecommerce solution software comes in six types: storefront platforms, payment processing, order management, product information management, ads and feed management, and analytics and profitability tools. Each does one job, and a missing one shows up as a specific failure.
| Type | Core job | Typical user | Gap when missing |
|---|---|---|---|
| Storefront platform | Product pages, cart and checkout | Brands selling direct online | No reliable product page or cart |
| Payment processing | Accepts cards and stores tokens | Any merchant taking card payments | Card data handled outside a secure flow |
| Order management | Routes orders and syncs stock across channels | Multichannel sellers | Overselling and manual order entry |
| Product information management | Holds product attributes once for every channel | Teams with complex product data | Conflicting data in feeds and marketplaces |
| Ads and feed management | Sends product data to Shopping and Performance Max | Retailers running paid search | Weak control over which products get spend |
| Analytics and profitability | Joins ad spend, margin and returns per SKU | Heads of growth and merchandisers | Revenue reports that hide unprofitable items |
The volume behind these systems is large. UNCTAD counted nearly US$25 trillion in business-to-business and business-to-consumer ecommerce sales across 43 economies in 2021.
The storefront is only the shop window; order management and product data are the stockroom that decides whether the description is right, the item exists and the order leaves on time.
Do you need a separate app for every type?
No. A storefront platform often covers payments, stock and reporting well enough for a single-channel store. A separate tool earns its place when the built-in version can’t handle your channel mix, your number of products or your financial decisions.
The harder line runs between reporting activity and supporting decisions. A dashboard can show purchases without showing whether those products made money.
When you compare ecommerce analytics platforms by the decision they support, ask which product costs, ad allocation and refunds sit behind each metric.
Practical rule: A capability isn’t covered just because an app has a menu item for it. Someone must own its inputs, exceptions and reconciliation.
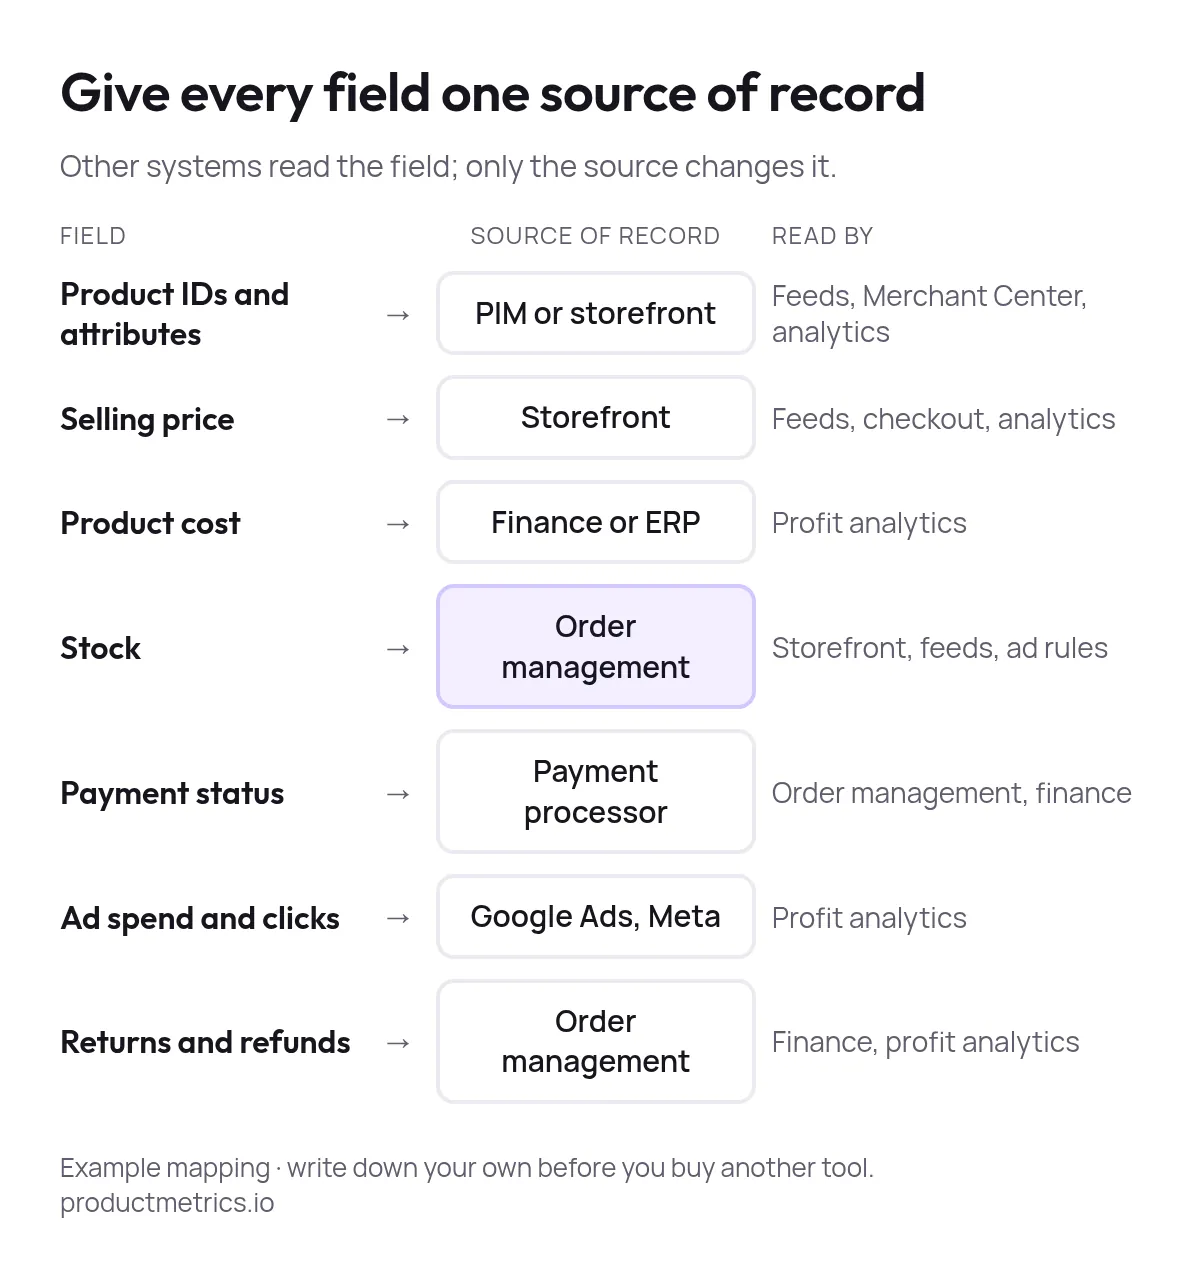
Map your current tools onto the table above. Mark each type as covered, missing, duplicated or run in a spreadsheet, and name its owner.
A spreadsheet is fine; a spreadsheet nobody owns is a poor base for automated spending decisions.
What should you check in the storefront and checkout?
Check two things in the storefront and checkout: how quickly shoppers can use the pages, and how the payment flow handles card data and failures.
How much does site speed affect conversions?
A 0.1-second improvement across key mobile speed metrics went with 8.4% more retail conversions and 9.2% higher average order value in a Google-commissioned Deloitte study of about 30 million sessions across 37 brands, published in 2020.

Show the dataHide the data
| Retail metric | Change per 0.1 s faster |
|---|---|
| Conversions | 8.4% |
| Average order value | 9.2% |
Use the study to justify performance work, then find the delays that hurt your own shoppers.
Measure each failure point separately:
- Largest Contentful Paint: does the main product content appear quickly on image-heavy product templates?
- Interaction to Next Paint: do filters, variant selectors and add-to-cart respond straight after a tap?
- Time to First Byte: are server, cache or API delays slowing the page before the browser starts?
Set budgets per template and device, and use real-user monitoring next to lab tests, because a fast office laptop hides what mobile shoppers see.
If a personalisation script slows a profitable product template, weigh what it adds against the delay.
What should the payment flow do?
The payment flow should keep raw card numbers out of your systems and treat every payment state as its own event.
The PCI Security Standards Council’s ecommerce guidance describes tokenisation as replacing card numbers with tokens, which reduces the cardholder data a merchant handles without removing every PCI duty.
Card details go through processor-hosted fields; your backend keeps the token, order ID, payment status and non-sensitive metadata. The order service then needs explicit failure handling:
| Failure | What the system must do | Test it with |
|---|---|---|
| Payment request times out | Retry with an idempotency key, never charge twice | A forced timeout and resend |
| Unsigned payment webhook | Reject messages whose signature fails | A webhook with a wrong signature |
| Partial refund or chargeback | Record authorisation, capture, refund and chargeback separately | A partial refund on a test order |
A successful demo purchase proves little about exceptions. Ask the vendor to draw where card data flows, who controls the encryption and signing keys, and what happens on a retry.
If sales can’t answer, bring in their implementation team before you sign.
Which products deserve ad budget after returns?
The products that deserve ad budget are the ones that keep contribution after advertising, fulfilment and returns, and those are often not the bestsellers.
According to the National Retail Federation and Happy Returns, US retailers expected 19.3% of online sales to be returned in 2025, against 15.8% of all retail sales.

Show the dataHide the data
| Sales channel | Expected return rate |
|---|---|
| All retail sales | 15.8% |
| Online sales | 19.3% |
So the order recorded at checkout is not the final number, least of all online.
How do you calculate post-return contribution?
Post-return contribution is merchandise revenue after discounts and excluding VAT, minus product and fulfilment costs, allocated ad spend and the expected cost of returns. Calculate it per order line, then add it up per SKU:
- Product and fulfilment costs: cost of goods, outbound shipping, packing and payment fees.
- Acquisition costs: ad spend allocated consistently to the product or its customer journey.
- Expected return cost: return rate × net loss per return.
The net loss per return is the refund plus reverse shipping, inspection and handling, minus the stock value you recover when the item can be resold.
Don’t deduct product cost a second time, and use either an expected-return provision or actual return losses for the same orders, never both.
Use your own return rates per category, not market averages.
A DHL eCommerce survey of 24,000 online shoppers across 24 countries in 2025 found that 64% had returned an item to an online retailer; that describes shoppers, not the share of orders that come back.
Our guide to the ecommerce return rate shows how to measure yours.
Worked example: the bestseller against the quieter winner
For example, a heavily advertised shoe reaches a ROAS of 6, but 35% of pairs come back because the fit description is unclear. An accessory reaches a ROAS of 4 at a lower price, and only 5% come back.
| Shoe | Accessory | |
|---|---|---|
| Orders | 100 | 160 |
| Price excl. VAT | €120 | €40 |
| Revenue | €12,000 | €6,400 |
| Ad spend | €2,000 | €1,600 |
| ROAS | 6 | 4 |
| Cost of goods | €6,000 | €2,560 |
| Fulfilment and payment fees | €800 | €800 |
| Return rate | 35% | 5% |
| Net loss per return | €72 | €30 |
| Return cost | €2,520 | €240 |
| Contribution after ads and returns | €680 | €1,200 |
The net loss per return assumes return handling of €12 for the shoe and €6 for the accessory, and that every returned item is resold at cost.
Measured as POAS, profit before ads per euro of ad spend, the shoe scores 1.34 and the accessory 1.75. POAS vs ROAS explains the metric.

Show the dataHide the data
| Product | Contribution ÷ net sales |
|---|---|
| Shoe (ROAS 6) | 8.7% |
| Accessory (ROAS 4) | 19.7% |
Net sales are revenue minus refunded returns: €7,800 for the shoe and €6,080 for the accessory. The dashboard ranks the shoe first; the contribution ranking reverses it.
Scale the product that keeps contribution, not the product that records the most checkout revenue.
The accessory may deserve more priority, while the shoe needs a sizing fix before more traffic. Keep cohorts open until returns have arrived, or recent orders look healthier than they are.
Then give every SKU an action: scale profitable demand, hold uncertain cohorts, fix misleading product content or pause products with persistently negative contribution.
Doing this by hand works for two products. Across 5,000, it needs software that reads costs, returns and ad data per product; the guide to profitable ecommerce advertising covers the campaign side.
In Product Metrics, Product Segmentation uses Machine Learning to place each product in one of six segments: ad clicks give the volume, ROAS or POAS the return.
The labels you approve go to Google Merchant Center for Shopping and Performance Max.
How should stock levels change your advertising?
Stock levels should decide whether a product stays eligible for ads: pause products that will sell out before replenishment arrives, and lower priority where confirmed stock lands in time.
Use the order management system as the stock source of record, never an advertising spreadsheet.
- Pull the stock inputsPer SKU: sellable stock on hand, reserved units, inbound quantity, expected receipt date and average daily unit sales. Leave out damaged or quarantined units.
- Calculate days of coverDivide sellable stock by average daily unit sales. Flag products without a meaningful sales history as uncertain instead of treating low demand as unlimited cover.
- Pause products that will run outIf cover is shorter than the supplier lead time and no inbound stock is booked, exclude the product from its advertising product group. Keep a buffer for organic and marketplace orders.
- Limit exposure when replenishment is confirmedIf confirmed stock arrives before the current stock runs out, keep the product eligible with lower priority. A Merchant Center label groups or excludes products; it doesn't cap spend per SKU.
- Publish and check the changeSync stock status and labels, then confirm the campaign selection actually changed. Feed processing and campaign updates take time.
Review fast sellers at least weekly, with automated checks in between. A sudden promotion or supplier delay should trigger a new assessment straight away rather than waiting for the next meeting.
Which stock rules fit which products?
Different products need different rules. For a replenishable bestseller, protect availability until the shipment is received and checked. For a seasonal product near its selling deadline, faster depletion can be the right call.
Where substitutes exist, send demand to an available alternative rather than an out-of-stock variant. The ecommerce inventory planning guide connects stock coverage with acquisition decisions in more depth.
Inventory Insights in Product Metrics flags products that will run out, based on lead time, expected demand and a safety buffer, and reports revenue at risk per product.
Operational safeguard: A booked delivery isn’t sellable stock. Base promises on receipt confidence, warehouse processing and the commitments you’ve already made.
Feeds will sometimes be stale. Keep landing-page availability accurate and offer a clear alternative, so a click on an unavailable product still has somewhere to go.
Which software should you start with for your store?
Start with the software that fixes the decision your team can’t make reliably today; store size alone is a weak guide. Find the row closest to your store:
| Store profile | Start with | Add next | Watch for |
|---|---|---|---|
| Single channel, a few hundred SKUs or fewer | Storefront platform with native payments and analytics | Feed tools once Shopping spend is steady | Reports that hide SKU-level margin |
| Many products on Shopping or Performance Max | Storefront plus a feed and ads tool with SKU data | Profit analytics and product information management | Feed labels that don’t match product data |
| Multichannel with shared stock | Storefront plus order management | Product information management, then ads automation | Advertising items that can’t ship |
| High-return categories | Storefront plus returns handling and profit analytics | Ad segmentation using post-return margin | Scaling bestsellers with negative contribution |
A small apparel range with costly returns can need deeper financial controls than a larger range of predictable replenishment products. Add a layer only once the one beneath it reconciles.
Single channel or multichannel?
A single-channel store with consistent margins can rely on native platform reporting at first; don’t buy a specialist tool to reproduce a report you already trust.
Add product feed management software when product selection, attributes or Shopping maintenance becomes a recurring bottleneck.
A multichannel seller starts elsewhere. Shared stock and order routing come first, because the same units may be promised on several channels. Automating acquisition before the order system is dependable only creates more manual cleanup.
When does profit reporting per product pay off?
Profit reporting per product pays off as soon as your products differ materially in shipping cost, discounts or return behaviour, because revenue averages then hide the losers.
A high-return category should get returns handling and financial visibility before advanced bidding rules, or marketing optimises towards orders that operations later unwinds.
Product Metrics fits stores with 500 to 50,000 products on Performance Max and standard Shopping. The first €10,000 of rolling 30-day Google Shopping spend is free, and the pricing page lists the bands above that.
How do you score ecommerce software before you buy?
Score each tool from 1 to 5 on five tests using your own data, then run the two best through a 14-day pilot.
A score of 1 means unproven; 5 means your team verified it with representative data.
| Test | What to check | Evidence to keep |
|---|---|---|
| Systems map | Every system touching orders, products, ads and cash, incl. plugins and agency feeds | Owner per handoff |
| Source of record | Product IDs, selling price, product cost and stock | Written field-to-system map |
| Connector | view_item, add_to_cart, begin_checkout, purchase with Merchant Center item IDs |
Event log incl. variants and refunds |
| Total cost | 12 months of subscriptions, transaction fees, implementation, modules and upkeep | Cost estimate |
| SKU reporting | Cost, margin, ad allocation and returns per SKU | Export finance can reproduce |
Where disputes are material, include that workflow in the total cost; Disputely’s overview of chargeback software pricing and fit helps price that part.
Veto a tool that fails the connector or SKU reporting test, whatever its total score. A good-looking dashboard can’t make up for a product ID you can’t trace or a margin nobody can explain.
How should the 14-day pilot run?
Shortlist one tool that fills your biggest missing type and one that fits your channel mix.
Connect each to a test store or a copy of your product data, with automated changes switched off until you have checked the output.
During the 14-day pilot, compare feed-to-order item matches, look for missing and duplicate events, and reconcile SKU reports with accounting totals, documenting the adjustments for timing, VAT, shipping and refunds.
Agree the acceptable variance with finance before you look at the results.
Two weeks proves connector reliability and upkeep. It can’t prove return economics when your return cycle runs longer, so validate those calculations on older order cohorts.
Record setup time and recurring manual work next to the reconciliation results. Keep a tool only if its output is dependable and it saves work or enables a decision you couldn’t make before.
Close with a decision memo: the chosen tool, the type it fills, the first products to review, the owner and the next review date. Note the rejected options too, so the same pitch doesn’t restart the process.
Final thoughts
The best stack is the one whose numbers agree. When the feed, the order system and finance tell the same story per product, ad budget can follow profit instead of checkout revenue.
Find the one decision you can’t make today and buy only what fixes it.
If the storefront itself is your gap, Rankozo’s leading online store builders compared is a starting shortlist. Check each option against your checkout requirements and integrations rather than expecting it to solve product profitability.
For a second view on platform choice, Shugert Marketing’s guide to compare ecommerce platform options helps frame the decision. Bring your marketplace orders, product data ownership and checkout customisation needs to that comparison.
Written by
Berend Vrakking, Founder of Product Metrics
1M+ products analysed · Nominated at the Dutch Search Awards for Best Measurement Campaign (2023) and Best Use of Data (2024)
Keep reading.
Ecommerce inventory planning: replenish, hold or promote
Ecommerce inventory planning per product: read GMROI, excess capital and revenue at risk together to decide what to replenish, hold, promote or deprioritise.
How to calculate stockout cost and revenue at risk
How to calculate stockout cost and revenue at risk per product: forecast demand until the restock, minus sellable stock, times the price excl. VAT.
Dropshipping profit margin after ads, refunds and returns
Dropshipping profit margin after ads, refunds and returns: vendor margin claims, a 100-order example, EU return rules and break-even ROAS.
Frequently asked questions.
What is the difference between an ecommerce platform and ecommerce solution software?
Is a spreadsheet good enough for product profitability?
How long should return cohorts stay open before you judge a product?
See which of your products to push, fix or pause. Start with your own products, or a 30-second estimate.
Check one product first: work out its break-even ROAS in the calculator. Then see where all your products stand.
Questions, or want to spar about your products? Book a demo: a video call with Berend, then a demo account.