
What is nCAC? New customer acquisition cost explained
What is nCAC? New customer acquisition cost is acquisition spend ÷ first-time customers. The formula, which costs count, and how it compares with MER and ROAS.
nCAC (new customer acquisition cost) is what it costs you to win someone who has never bought from you before. For example, €10,000 of ads that bring in 250 first-time buyers is €40 each.
I worked one store’s month out four ways below, and it lands anywhere from €40 to €55.56. An nCAC means little without its definition and a payback check.
What is nCAC and how do you calculate it?
nCAC = acquisition spend in the period ÷ customers whose first-ever order was in that period. Spend goes on top and people go underneath, and each needs a fixed definition.
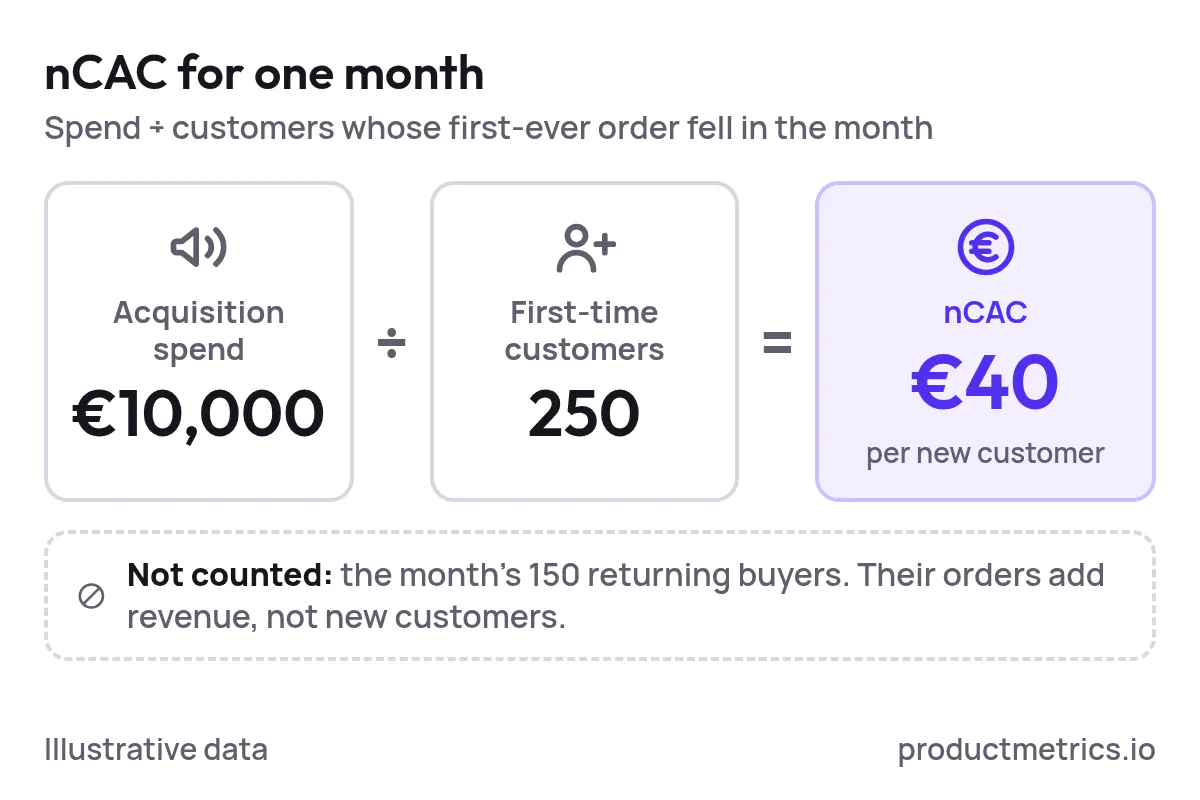
You’ll see it spelled nCAC, NCAC and NC-CAC. In ecommerce reporting they all ask the same question: what did it cost to win someone who had never bought from you?
What goes in the numerator?
The numerator is paid media only in its narrow version. The fully loaded version adds agency, creative and software costs. Both are valid; switching between them unannounced is not.
Who counts in the denominator?
The denominator counts people placing their first order, not orders. A returning customer who clicks a Shopping ad and buys again adds revenue, not a new acquisition.
Take first-time status from your store’s order history, not from an ad platform. Your store sees each buyer’s full history; a platform sees only its own tracked events.
Wevion’s guide to new customer acquisition cost makes the same point: platforms count repeat purchases as conversions too.
How much does the cost basis change nCAC?
The cost basis can move nCAC by more than a third without one customer behaving differently.
For example, take one store’s month: €10,000 of paid media, 250 first-time customers (180 attributed to paid channels) and 150 returning buyers.
| Basis | Acquisition spend | Customers counted | nCAC |
|---|---|---|---|
| Media only, all first-time customers | €10,000 | 250 | €40.00 |
| Fully loaded, all first-time customers | €13,500 | 250 | €54.00 |
| Media only, paid-attributed first-time customers | €10,000 | 180 | €55.56 |
| Blended CAC, all customers (contrast) | €10,000 | 400 | €25.00 |
The fully loaded row adds €2,000 of agency fees, €1,000 of creative and €500 of software. Nothing changed about the customers; the store just counted more of what it paid to win them.

Show the dataHide the data
| Basis | Cost per customer counted |
|---|---|
| Media only, all first-time customers | €40.00 |
| Fully loaded, all first-time customers | €54.00 |
| Media only, paid-attributed first-time customers | €55.56 |
| Blended CAC, all customers | €25.00 |
Row one spreads media spend over every first-time buyer, including those from organic search or referrals. It shows the spend that goes with new-customer growth, not proof that ads caused every acquisition.
Row three keeps the spend and narrows the customers to those your attribution rules credit to paid channels.
Blended CAC, the last row, flatters the business. It includes returning buyers, so a retention promotion makes acquisition look cheap while the customer base barely grows.
The customer acquisition cost formula post works through the same gap between cost per order and cost per new customer.
Which costs belong in each version?
There is no universal scope for nCAC, which Wicked Reports’ coverage of new customer acquisition cost reflects too. Name the version you report instead of publishing an unlabelled number.
| Item | Fully loaded basis | Paid-media basis |
|---|---|---|
| Search, Shopping and Performance Max media | Included | Included |
| Social and display media | Included | Included |
| Agency or freelancer fees | Included | Excluded |
| Ad creative, photography and video | Included | Excluded |
| Marketing software and tools | Included | Excluded |
| Affiliate and influencer commissions | Included | Excluded |
These are conventions, not fixed definitions. If affiliate payouts go into your fully loaded number, Otter A/B’s explanation of CPA network pricing and payout models helps you decide which contractual charges count as acquisition spend.
Write the counting rules next to the number
Agree these five settings with finance once, then print them beside every nCAC you report.
| Setting | What to decide |
|---|---|
| Cost basis | Paid media only, or fully loaded |
| First-time customer | Matched on account ID or normalised email, checked against full order history; guest duplicates merged, renewals excluded |
| Attribution window | The click-to-order window that makes a first-time buyer paid-attributed |
| Refunds and cancellations | Whether a refunded or cancelled first order still counts |
| Timing | Which month a delayed first order lands in |
Take extra care with Shopping and Performance Max. Brand demand, retargeting and organic discovery can all touch one purchase, so attribution doesn’t prove the ad found the customer.
Report fully loaded blended nCAC and paid-attributed nCAC side by side. Keep platform-reported CPA separate until you’ve reconciled its costs, customers and conversion definitions with your store data.
How does nCAC compare with MER and ROAS?
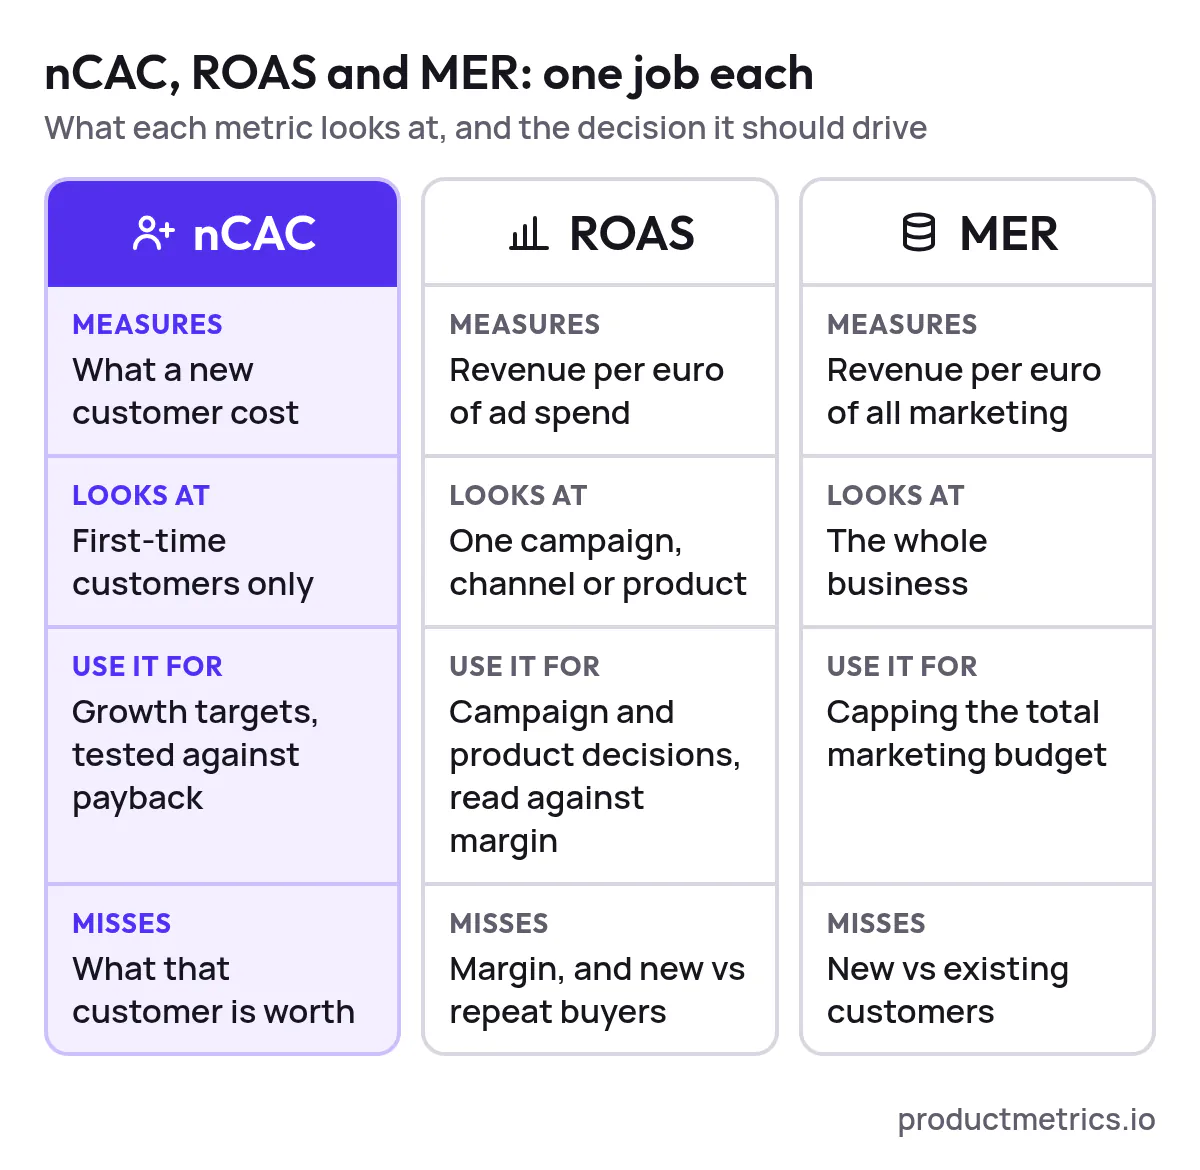
nCAC, MER and ROAS answer three different questions, so none can stand in for another. ROAS checks a campaign, MER the whole budget, nCAC the cost of a new buyer.
| Metric | Formula | Question it answers | Blind spot |
|---|---|---|---|
| ROAS | Attributed revenue ÷ ad spend | Did these ads return revenue? | Ignores margin, includes repeat buyers |
| MER | Total revenue ÷ total marketing spend | Is the whole budget paying off? | Doesn’t split new from existing customers |
| Blended CAC | Marketing spend ÷ all customers | What does the average buyer cost? | Mixes new and returning customers |
| nCAC | Acquisition spend ÷ first-time customers | What does a new customer cost? | Says nothing about what that customer is worth |
Can a stable MER hide an acquisition problem?
Yes. In this example, the store’s marketing efficiency ratio (MER) holds at 4 all year while nCAC climbs from €40 to €55, because existing customers and retargeting keep total revenue in line with spend.

Show the dataHide the data
| Quarter | nCAC |
|---|---|
| Q1 | €40 |
| Q2 | €45 |
| Q3 | €50 |
| Q4 | €55 |
The owner reads the flat MER and sees no change. The acquisition lead sees each new customer costing more every quarter. Both are right about their own part of the business.
That is why the marketing efficiency ratio guide treats MER as a cap on the total budget, not a verdict on growth. The MER and nCAC calculator gives you both from the same account totals.
So give each metric its own job: ROAS for campaign and product decisions, read against margin; MER to cap the total budget; nCAC for growth targets tested against payback.
Is a lower nCAC always better?
No. A lower nCAC is only better if the customers you win still contribute enough to repay it. A cheaper audience can be worse business if it buys heavily discounted products and never comes back.
Contribution is what an order leaves after variable costs, not revenue. In this example, the first order leaves €18 of contribution against a €40 nCAC, so the store is €22 down per customer until repeat orders make it up.
Online Brand Growth’s contribution margin guide is a useful reference for that first calculation, and the contribution margin calculator does it per product.
- Work out first-order contributionStart from net first-order revenue and subtract product cost, fulfilment, shipping subsidies, payment fees, discounts and a returns allowance. Don't subtract discounts twice if revenue is already net of them.
- Match the nCAC to the same cohortUse customers acquired in the same period and with the same first product group. A storewide average says little about one product's buyers.
- Add contribution from later ordersKeep a ledger per cohort that adds the contribution of every repeat order and subtracts returns. Keep the acquisition spend separate.
- Find the payback monthLook for the first month in which the running total beats what the cohort cost to win. Monthly checkpoints show roughly when; order-level data gives the exact date.
- Check you can fund the waitCompare the payback period with the cash you can tie up while still paying for stock, fulfilment and running costs.

Show the dataHide the data
| Months after first order | Cumulative contribution per new customer |
|---|---|
| 0 | €18 |
| 3 | €26 |
| 6 | €33 |
| 9 | €39 |
| 12 | €44 |
Base the curve on what cohorts actually did, not on hoped-for repeat orders, and count the customers who never return.
The LTV:CAC ratio guide covers the same trade-off as a ratio, built on profit rather than revenue.
Why does an average nCAC mislead per product?
One storewide nCAC averages products that win customers cheaply with products that barely win any. Group customers by the product in their first order, then follow their later purchases across all your products.
A low-margin entry product can still pay off if its buyers return for refills and accessories. Read the first product from orders: the product clicked and the product bought often differ.
So one nCAC ceiling for every product is the wrong target. Set limits by each product group’s contribution and payback, and check that contribution still holds before cutting spend just because nCAC rose.
Doing that by hand stops scaling after a handful of products. Product Metrics shows nCAC per product as well as the average.
Full Signal Tracking sends new and returning customers to Google Ads and Meta as separate signals, so bidding can value a first order differently from a repeat one.
The break-even nCAC section of the CAC formula guide shows how much a first order can carry.
What is a good nCAC for ecommerce?
A good nCAC is one your contribution repays within a window you can fund, so the right number is your own. Benchmarks show whether a rise is yours or the market’s.
Northbeam reported that in 2025 advertisers in its dataset spent about 15% more on ads for about 14% more revenue, while median first-time customer acquisition cost rose nearly 9%.

Show the dataHide the data
| Measure | Change from 2024 to 2025 |
|---|---|
| Ad spend | 15% |
| Revenue | 14% |
| Median first-time CAC | 9% |
Median MER fell just over two percentage points in the same data. Growth was available in 2025, but each new customer cost more.
nStar Finance’s ecommerce unit economics guide puts median paid CPA for direct-to-consumer ecommerce at $32.74 in 2025, up 9.2% from $29.98 in 2024. It measures paid acquisition, so read it as direction, not a target.

Show the dataHide the data
| Industry | Median CAC ÷ median order value |
|---|---|
| Health and wellness | 110% |
| Pets | 69% |
| Beauty and personal care | 67% |
| Food and beverage | 65% |
| Apparel and accessories | 41% |
| Consumer electronics | 32% |
| Retail | 28% |
| Sports and outdoor | 20% |
Order value changes what a given nCAC means. Mage Loyalty’s customer acquisition cost benchmarks, drawn from Polar Analytics’ medians across 4,000+ Shopify brands (August 2026), show health and wellness paying $72.66 per customer on a $66 order. Sports and outdoor pays $27.66 on $138.48.
A replenishment brand can afford to lose money on the first order; a durable-goods brand has to make it pay.
Compare yourself first with your own history on a fixed definition. A rising nCAC with steady payback can be healthy expansion into dearer audiences, as long as you can fund it.
Final thoughts
nCAC tells you what a new customer cost. Only the cohort’s contribution tells you whether the customer was worth that price.
This week, agree the five counting settings with finance and calculate both nCAC versions for last quarter. Then write down the payback month for your biggest first-order product group.
When a number moves next quarter, you’ll know whether the customers changed or only the accounting.
For a structured review of whether your ads pay off overall, SellerAI’s prompts for analysing ad profitability can frame the discussion. Feed them reconciled store figures rather than platform summaries.
Before your next big promotion, read AdBeacon’s guide to nCAC around Black Friday. It shows how a wave of returning buyers flatters blended CAC exactly when first-time buyers get most expensive.
Written by
Berend Vrakking, Founder of Product Metrics
1M+ products analysed · Nominated at the Dutch Search Awards for Best Measurement Campaign (2023) and Best Use of Data (2024)
Keep reading.
D2C marketing strategy: a practical plan for ecommerce
D2C marketing strategy for ecommerce: start from contribution margin per product, give each channel one job and test for 90 days before you scale.
Marketing efficiency ratio: how to calculate and use it
Marketing efficiency ratio (MER) is net revenue ÷ total marketing spend. What counts as spend, break-even and target MER by margin, and budget rules.
Customer acquisition cost formula for ecommerce
The customer acquisition cost formula for ecommerce: ad spend ÷ new customers. A worked example, Google's definition and the most you can pay for a first order.
Frequently asked questions.
Is nCAC the same as CPA?
How often should you calculate nCAC?
Does Google Ads report nCAC?
See which of your products to push, fix or pause. Start with your own products, or a 30-second estimate.
Check one product first: work out its break-even ROAS in the calculator. Then see where all your products stand.
Questions, or want to spar about your products? Book a demo: a video call with Berend, then a demo account.