
Performance Max Campaigns: How They Work and How to Improve
Performance Max campaigns explained: what Google decides, what you still control, and how to steer budget to profitable products with labels and targets.
A Performance Max campaign is a Google Ads campaign type that serves one budget across YouTube, Display, Search, Discover, Gmail and Maps, and picks placements, bids and ad combinations itself. The usual advice is to load every product and set one target ROAS.
I’d start the other way round. Campaign ROAS is an average, and an average can look healthy while individual products lose money on every sale. I checked Google’s figures against its own published sources in November 2026.
How does a Performance Max campaign work?
A Performance Max campaign works like a kitchen where you stock the ingredients and Google decides which dish goes to which table. You supply products, creative and a target; Google picks the placement, the bid in each auction and the mix of assets.
Google’s launch announcement for Performance Max rolled it out to all advertisers on 2 November 2021. Google reported an average 13% increase in total incremental conversions at a similar cost per action, from its own data for July to September 2021.
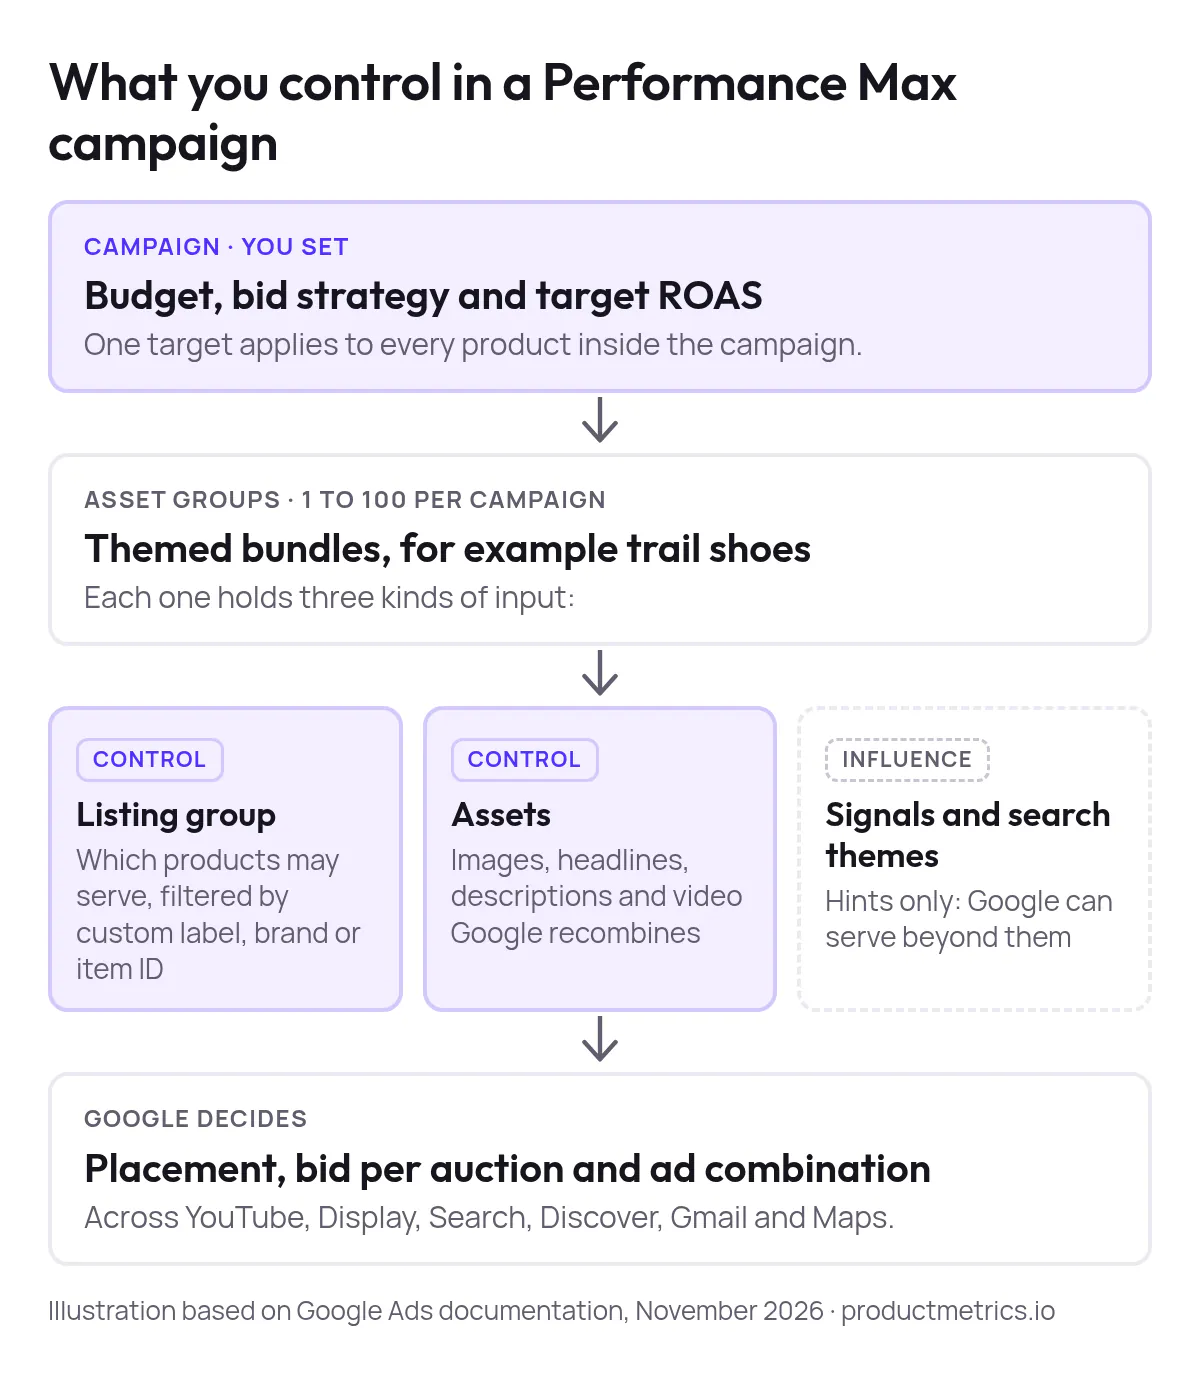
The parts of the campaign
One campaign holds between 1 and 100 asset groups. An asset group is a themed bundle, such as trail shoes with trail imagery and a trail landing page. These are the parts you work with:
| Part | What it does | Control or influence |
|---|---|---|
| Listing group | Decides which products from your feed may serve | Control |
| Assets | Images, logos, headlines, descriptions and video that Google recombines per surface | Control |
| Audience signals and search themes | Tell Google which buyers and searches are likely to convert | Influence |
| Campaign target ROAS | Sets the return Google bids towards for every product in the campaign | Control |
Creative and product economics fail in different ways. A good product under-delivers without video for YouTube, and no creative rescues an uncompetitive price or an empty shelf.
What you control and what you only influence
Audience signals and search themes are hints, not targeting rules. Google’s developer documentation on asset group signals describes them as information to optimise ad serving. Performance Max uses them to look for similar or stronger intent, so it serves beyond them.
Treat signals as training context and listing groups as your eligibility controls.
Before changing anything, list each asset group and listing group and mark it control or influence. If most of your recent changes went into signals, you’ve been steering with influence and leaving your controls alone.
When should you use Performance Max instead of Standard Shopping?
Use Performance Max to scale products with proven conversion volume, and Standard Shopping where you want product-level reporting and direct control. They are layers, not replacements:
| Feature | Performance Max | Standard Shopping | Search campaigns |
|---|---|---|---|
| Where ads appear | YouTube, Display, Search, Discover, Gmail, Maps | Google Shopping placements | Google Search results |
| Control over placements | Listing groups and signals only | Higher: by product and priority | High: by keyword and match type |
| Reporting detail | Channel and search-term views, limited product detail | Product-level performance | Keyword-level performance |
| Best use | Scaling reach with strong conversion volume | Precise control over priority products | Intent-led queries outside your products |
What Google’s headline numbers measure
Google’s guidance on unified cross-channel advertising reports 27% more conversions or value at a similar CPA or ROAS for advertisers adopting Performance Max (Google internal study, October 2023).
The same page cites a 2024 Nielsen marketing-mix meta-analysis, commissioned by Google, of 1.1 million campaigns over 104 weeks. It found 8% higher ROAS and 10% higher sales effectiveness than Search-only strategies.
| Claim | Who measured it | Compared with |
|---|---|---|
| 13% more incremental conversions | Google data, July–September 2021 | Similar cost per action |
| 27% more conversions or value | Google internal study, October 2023 | Similar CPA or ROAS |
| 8% higher ROAS, 10% higher sales effectiveness | Nielsen, commissioned by Google, 2022–2024 campaigns | Search-only strategies |
All three are averages across many advertisers, measured by or for Google. None says whether a given product in your account made money.
Where Performance Max limits you
Performance Max limits your visibility and control in return for reach and automated bidding:
| Strength | Matching limit |
|---|---|
| Six surfaces from one campaign | Placement data stays coarser than in keyword campaigns |
| Bids set per auction at scale | Thin conversion data leaves the model little to learn from |
| Signals find new buyers | Signals don’t exclude traffic you didn’t intend |
| Budget flows to what converts | Easy converters win spend whether or not they earn |
The last row matters most for retailers with mixed margins. That’s why I run Performance Max next to Standard Shopping: Performance Max for proven products, Standard Shopping for the ones I’m not ready to hand over.
Why does campaign ROAS hide products that lose money?
Campaign ROAS hides loss-making products because it is an average: a few strong products lift the total while weaker ones lose money on every sale.
Take one campaign of four products, for example, reporting a ROAS of 5, or 500% in target ROAS terms:

Show the dataHide the data
| Product | ROAS | Break-even ROAS |
|---|---|---|
| Trail shoe | 7 | 2.5 |
| Road shoe | 6 | 3.3 |
| Discounted trainer | 3.5 | 4 |
| Running jacket | 1.5 | 2.5 |
Each product’s break-even ROAS is 1 divided by its contribution margin, the share of revenue left after cost of goods, shipping, payment fees and returns. Here are the inputs, so you can check every figure:
| Product | Ad spend | Revenue | ROAS | Margin | Profit after ads |
|---|---|---|---|---|---|
| Trail shoe | €2,000 | €14,000 | 7 | 40% | €3,600 |
| Road shoe | €1,000 | €6,000 | 6 | 30% | €800 |
| Discounted trainer | €1,000 | €3,500 | 3.5 | 25% | −€125 |
| Running jacket | €1,000 | €1,500 | 1.5 | 40% | −€400 |
| Campaign | €5,000 | €25,000 | 5 | €3,875 |
The trainer reaches a ROAS of 3.5 and still loses money, because a 25% margin needs 4. Channel, search-term and asset reports show how ads were delivered, not whether each product covered its costs.
Metrics to check per product
Start with margin and stock cover, because a thin margin or near-empty stock distorts every metric after them. A product about to sell out doesn’t need more demand, and no creative saves a product with no margin headroom.
| Metric | What it tells you | Warning sign |
|---|---|---|
| Contribution margin | Share of revenue left after variable costs | Too thin to cover the ad cost of a sale |
| Stock cover | Weeks of inventory on hand | Spend on products close to selling out |
| ROAS | Revenue per euro of ad spend | High ROAS on a low-margin product |
| POAS | Profit per euro of ad spend | Below 1, so profit doesn’t cover ad spend |
| Conversion rate | Share of clicks that become orders | Clicks rising while conversion rate falls |
| Return rate | Share of orders sent back | Returns large enough to erase the margin |
Then compare ROAS with POAS. POAS equals ROAS × contribution margin and breaks even at 1: the trainer’s POAS is 3.5 × 0.25 = 0.875. How POAS differs from ROAS covers which one to bid on.
A product can be your best revenue driver and your worst profit driver at once.
To find yours, export 30 days by product, sort by spend and flag every product below break-even. On 200 products that takes an afternoon; on 5,000 it has to be redone every month.
How do you segment products for Performance Max?
Segment products on two axes: volume in ad clicks, which says whether there is enough evidence, and return against your target ROAS or POAS, which says whether the evidence is good. Set the target first, from the margin:

Show the dataHide the data
| Contribution margin | Break-even ROAS |
|---|---|
| 20% | 5 |
| 25% | 4 |
| 30% | 3.3 |
| 40% | 2.5 |
| 50% | 2 |
Break-even POAS stays at 1 whatever the margin, so one POAS target replaces five ROAS targets. Check the discounted trainer from the example, or type in your own product:
Below break-even
Below break-even: ROAS 3.5 is under the 4 you need. After ads you lose €3.57 of every €100 of revenue.
- Contribution margin
- 25.0%
- €25.00 per order
- Break-even ROAS
- 4
- 1 ÷ margin
- POAS
- 0.88
- ROAS × margin. 1 is break-even.
- Left per €100 of revenue after ads
- -€3.57
- Target ROAS for the profit to keep
- 400.00%
- With no profit kept, target ROAS is 400.00%, equivalent to the break-even ROAS. A bidding target does not guarantee break-even; compare achieved return on the same revenue and cost basis.
At a 25% contribution margin, a ROAS of 3.5 falls short of the break-even ROAS of 4.
Per order, excl. VAT. For several products or VAT, use the break-even ROAS calculator.
The break-even ROAS calculator does the same for one product with more cost lines.
Six segments, six jobs
Product Segmentation places every product in one of six segments by those two axes, using machine learning on your own account data:
| Segment | Volume (ad clicks) | Return against target | What to do |
|---|---|---|---|
| Stars | High | Above target | Increase priority; fix stock first |
| Question Marks | High | Just under target | Test price, title and product page |
| Cash Cows | Low | Above target | Protect and grow reach |
| Dogs | High | Below target | Lower priority or fix the page |
| Drainers | Low | No return | Keep in a catch-all |
| Ghosts | No impressions | Nothing to measure | Reactivate or clean the feed |
Stars come first. If a Star runs low on stock, fix availability before adding budget, because demand pushed into a stockout wastes clicks. Cash Cows earn well on little traffic, so they need reach more than budget.
Question Marks and Dogs draw plenty of clicks, so diagnose them before deciding on budget: price position, a weak product page or a poor fit after the click.
Drainers return nothing, so exclude them. Ghosts get no impressions, which points to the feed rather than the bid.
One workable split puts Stars in Performance Max with a target ROAS a little below your goal, and Dogs in Standard Shopping with a target above it. Count how many top spenders sit in Dogs or Drainers: that is your most urgent leak.
Review segments monthly, so products move on evidence rather than on one strong weekend.
How do you turn segments into feed labels?
Segments change delivery only once they reach the feed as Google Merchant Center custom labels, because listing groups filter on them.
Listing groups filter by item ID, brand, category, product type, condition, channel and custom label, so the label makes your decision enforceable.
- Pick the facts that change your decisionTypically return against target, contribution margin, stock cover in weeks and price position against competitors. Leave out data you won't act on.
- Set a threshold for each factFor example, a POAS of 1 as the line between earning and losing, or fewer than 4 weeks of stock cover as low stock. A threshold forces a decision.
- Write the result to a custom labelMerchant Center has five slots, custom_label_0 to custom_label_4. Keep values short and consistent, such as stars or dogs.
- Filter listing groups by that labelEach listing group then holds products in the same commercial state, so Stars and Dogs stop sharing one set of assumptions.
- Give each margin band its own targetGoogle sets target ROAS per campaign, so split campaigns only where margin bands differ enough to need different targets.
- Check product reports every weekListing groups control eligibility, not budget share inside a campaign. Confirm spend moved, then adjust labels or targets if it didn't.
Product Metrics writes those labels through product rules, and only the labels you approve. For example: WHEN POAS is at least 1.4, margin at least 40% and stock cover over 8 weeks, THEN set custom_label_0 to stars.
If feed rules start to collide, troubleshoot product feed rule conflicts before adding more logic.
Labels beat restructuring because the campaign stays put while products move.
When a product’s margin, stock or price changes, its label changes and it switches listing group by itself, so Smart Bidding keeps its history.
Set targets before you change budgets
Budget changes made before targets just scale the mix you already have, winners and losers together. Work in this order, checking POAS beside ROAS with the POAS calculator:
| Order | Do this | For the discounted trainer |
|---|---|---|
| 1 | Calculate break-even ROAS from the margin after shipping, fees and returns | 1 ÷ 0.25 = 4 |
| 2 | Set one target per margin band, not one for the account | Its 25% band needs a target ROAS above 400% |
| 3 | Move budgets in small steps and let conversion data settle | No extra budget while it sits at 3.5 |
| 4 | Check stock before adding budget; move segments monthly | Review it as a Dog at the next segment review |
How do you check that Performance Max adds sales?
Check it with a holdout test: switch the campaign off for one region or audience, compare sales with the regions that still see ads, and split the result into new and returning customers.
Attributed conversions alone flatter Performance Max, because it also collects branded searches and returning customers.
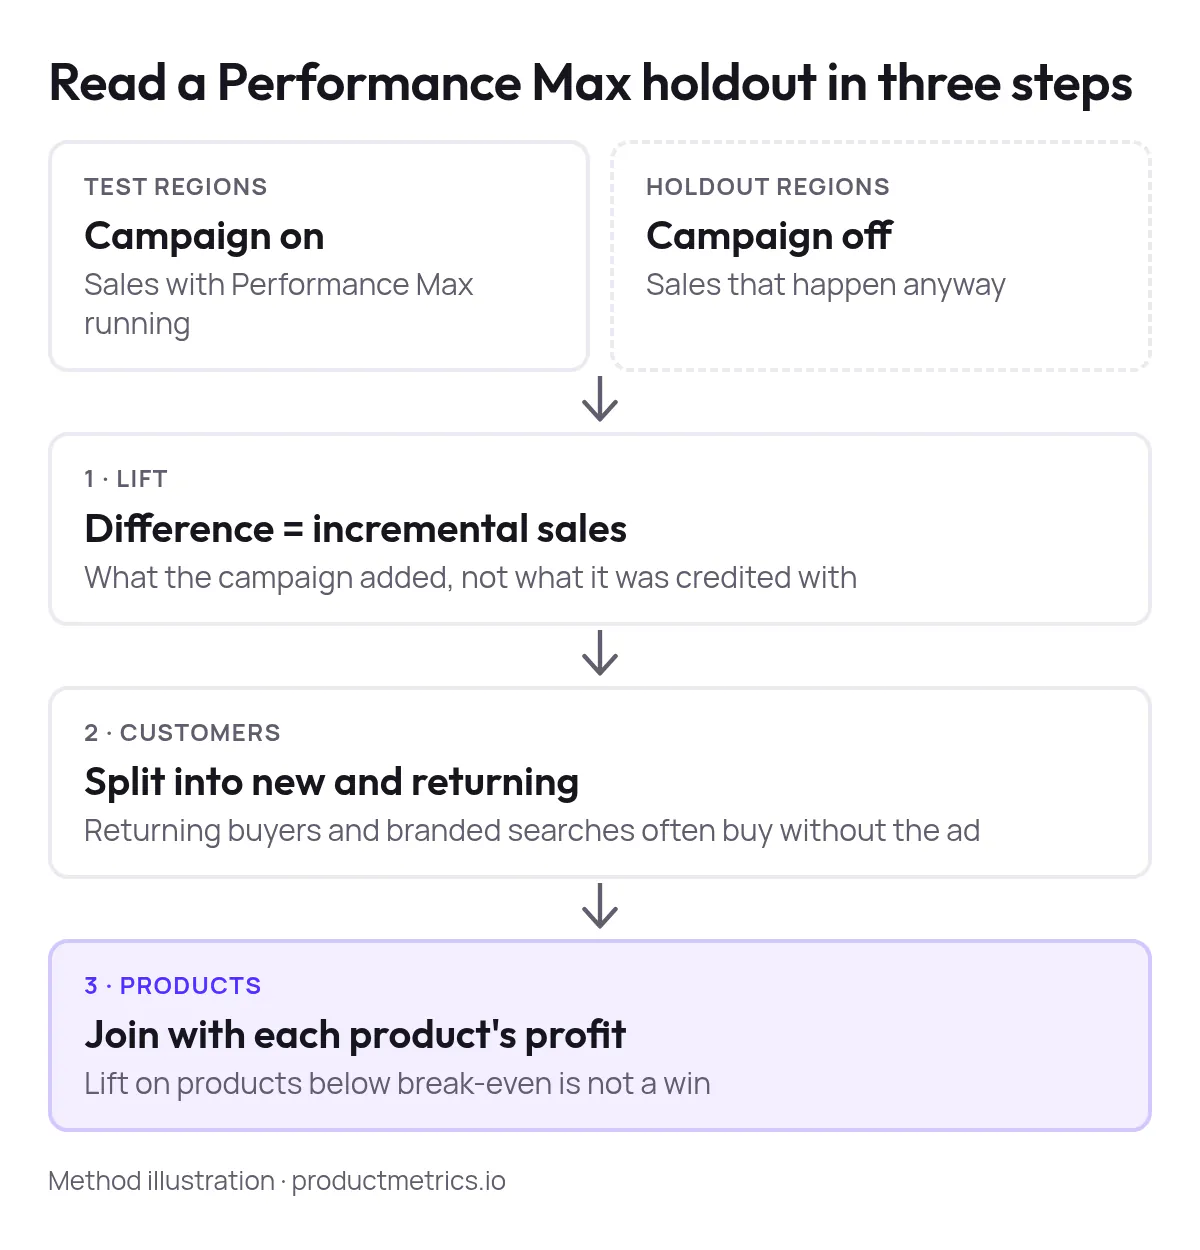
For example, a shoe retailer reports a ROAS of 6, yet most conversions come from branded queries and returning customers. A regional holdout shows new-customer sales rising only 4%. Budget should move away from those audiences before anyone adds spend.
| Holdout result | Likely cause | Action |
|---|---|---|
| Strong attributed ROAS, weak lift | Branded search or returning customers | Exclude them or add a new-customer goal |
| Lift comes from loss-making products | Profit not in the bidding signal | Lower those products’ priority |
| Lift on profitable products | Campaign creates demand | Scale those listing groups |
Google offers conversion lift studies, Meridian (its open-source marketing-mix model) and new-customer reporting for this. Join the result with each product’s profit, because lift on loss-making products isn’t a win.
Measuring incrementality per product and Performance Max for new customers go deeper on both.
Final thoughts
Performance Max decides where your money goes; you decide which products it’s allowed to spend on. Work out break-even ROAS for your 20 highest-spending products this week, label the ones below it, and change budgets only after that.
If you also need to judge how Performance Max shares credit with your other channels, marketing measurement with Helbling Digital Media explains how multi-touch attribution views complement a holdout test.
Written by
Berend Vrakking, Founder of Product Metrics
1M+ products analysed · Nominated at the Dutch Search Awards for Best Measurement Campaign (2023) and Best Use of Data (2024)
Keep reading.
Performance Max For New Customers - Setup, Value Rules, And Bidding Uplifts
Performance Max for new customers - setup, the three NCA modes, how much extra to value a new customer, value rules and campaign structure.
PMAX Product Segmentation: A Setup‑to‑Scale Playbook for Google Shopping
PMAX Product Segmentation from first setup to scale: feed labels, listing groups, a three-stage model, a 90-day test plan and segment-level metrics.
Google Ads Campaign Types for Ecommerce: Search, Shopping and PMax
Google Ads campaign types for ecommerce: when Search, Standard Shopping or Performance Max fits a product, what benchmarks hide and when to scale.
Frequently asked questions.
Can you exclude products from Performance Max?
Can you see product-level results in Performance Max?
How many asset groups should a Performance Max campaign have?
See which of your products to push, fix or pause. Start with your own products, or a 30-second estimate.
Check one product first: work out its break-even ROAS in the calculator. Then see where all your products stand.
Questions, or want to spar about your products? Book a demo: a video call with Berend, then a demo account.