
PMAX Product Segmentation: A Setup‑to‑Scale Playbook for Google Shopping
PMAX Product Segmentation from first setup to scale: feed labels, listing groups, a three-stage model, a 90-day test plan and segment-level metrics.
Performance Max (PMax) is now the default way many retailers run Google Shopping. It’s powerful—and famously opaque. Google’s automation decides which products to push, on which channels, at what bid. Done well, that’s leverage. Done badly, it’s a black box that pours budget into the wrong SKUs. (Source: Google Ads API – Get started with Performance Max, About Product Metrics)
This playbook is a step‑by‑step guide to PMax product segmentation that you can actually run in an account:
- From “all products in one campaign” to product‑level control
- From ad‑platform averages to POAS and contribution margin
- From one‑off restructures to a repeatable test‑and‑learn cadence
It’s written for teams that already know their way around Google Ads and Merchant Center, and need a durable structure they can scale across markets and brands.
1. Why PMax Product Segmentation Is Now a First‑Class Lever
1.1 PMax Chooses Winners Product by Product
PMax campaigns use your Merchant Center feed as the starting point for Shopping ads, not keywords. For retail campaigns, each asset group must include a product partition tree (listing groups) that decides which products are eligible to serve. (Source: Google Ads API – Get started with Performance Max, Google Ads API – Listing Groups for Retail)
Within that structure, Google’s Smart Bidding optimizes toward the conversion goals and value signals you provide. The combination of:
- Product data (titles, prices, availability, custom labels)
- Conversion and revenue/profit signals
- Bidding strategy (Target ROAS / Maximize conversion value)
is what decides which SKUs win impressions and budget in each auction. (Source: Google Ads Help – Manage a Performance Max campaign with listing groups, Google Ads Help – Bidding)
1.2 Why “All Products” PMAX Plateaus
With an undifferentiated “all products” PMax campaign, every item competes inside one shared budget and target. High‑click, low‑margin products often soak up spend because they generate fast, easy conversions—even if they don’t generate profit. Meanwhile, high‑margin or strategic products can remain under‑served. (Source: About Product Metrics)
Segmentation fixes this by:
- Giving you different budgets and targets for different product groups.
- Letting you shield Drainers and Dogs (low or negative POAS) from over‑investment.
- Pushing more budget into Stars and Cash Cows that reliably grow contribution profit.
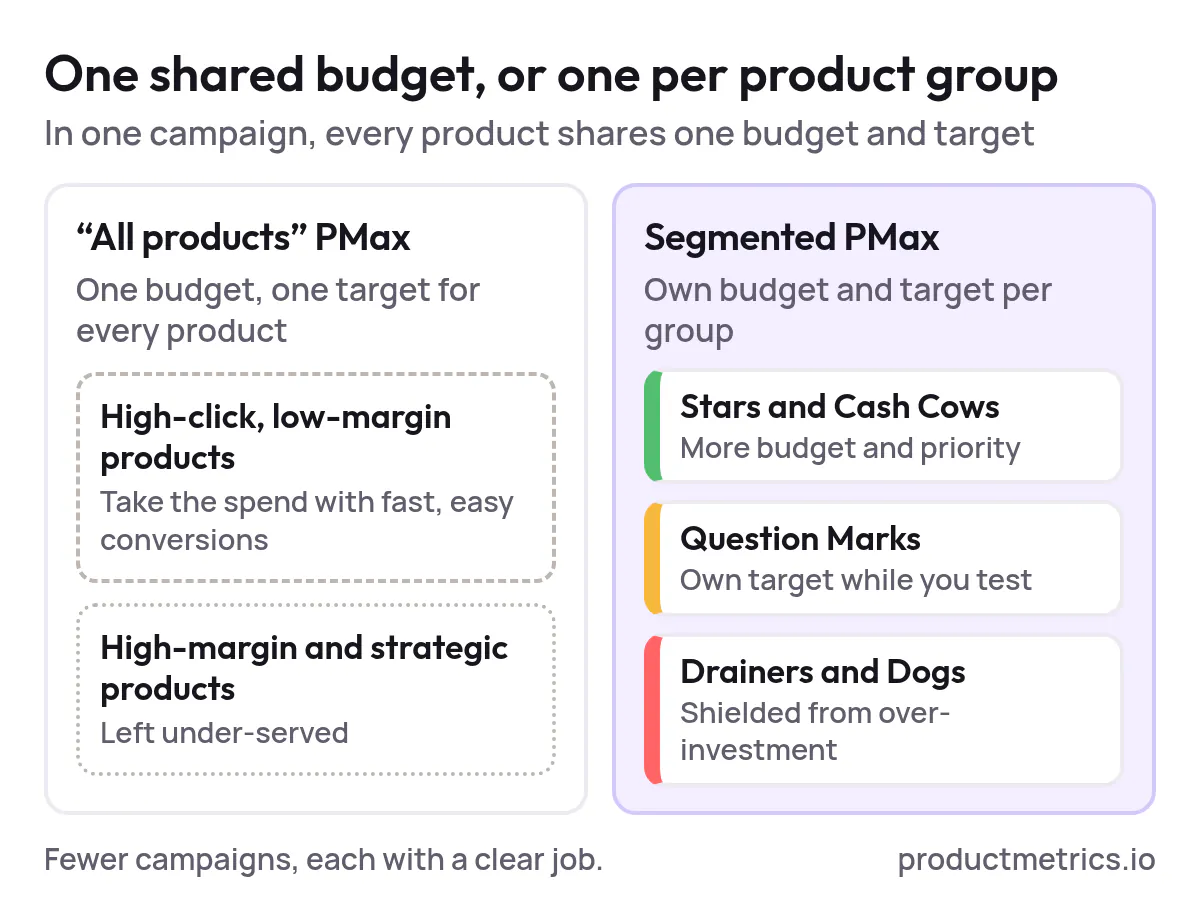
Google itself now recommends consolidated but intentional structures: fewer campaigns, but with clear asset group and listing‑group logic, instead of dozens of fragmented campaigns. (Source: Google – Retailer best practices for AI‑powered Performance Max)
1.3 Product Level Reporting Finally Caught Up
In 2026, Google expanded product‑level reporting so that more campaign types—including Performance Max—expose cost, conversions and conversion value at the product level, not just at the campaign or asset‑group level. (Source: Product Metrics – The 2026 Ecommerce ROAS Optimization Tools Landscape)
Combined with channel‑level reporting (segmenting PMax performance by ad network type and whether an ad used product data or video), this makes it much easier to see which SKUs are actually driving results where. (Source: Google Ads API – Performance Max campaign performance by channel, Google Ads Developer Blog – Channel‑level reporting for Performance Max)
That visibility is what makes a rigorous segmentation and testing strategy worth the effort.
2. The Building Blocks Feed Labels Listing Groups Asset Groups
Before we get into the playbook, it’s worth aligning on the objects you actually control.
2.1 Merchant Center Product Data and Custom Labels
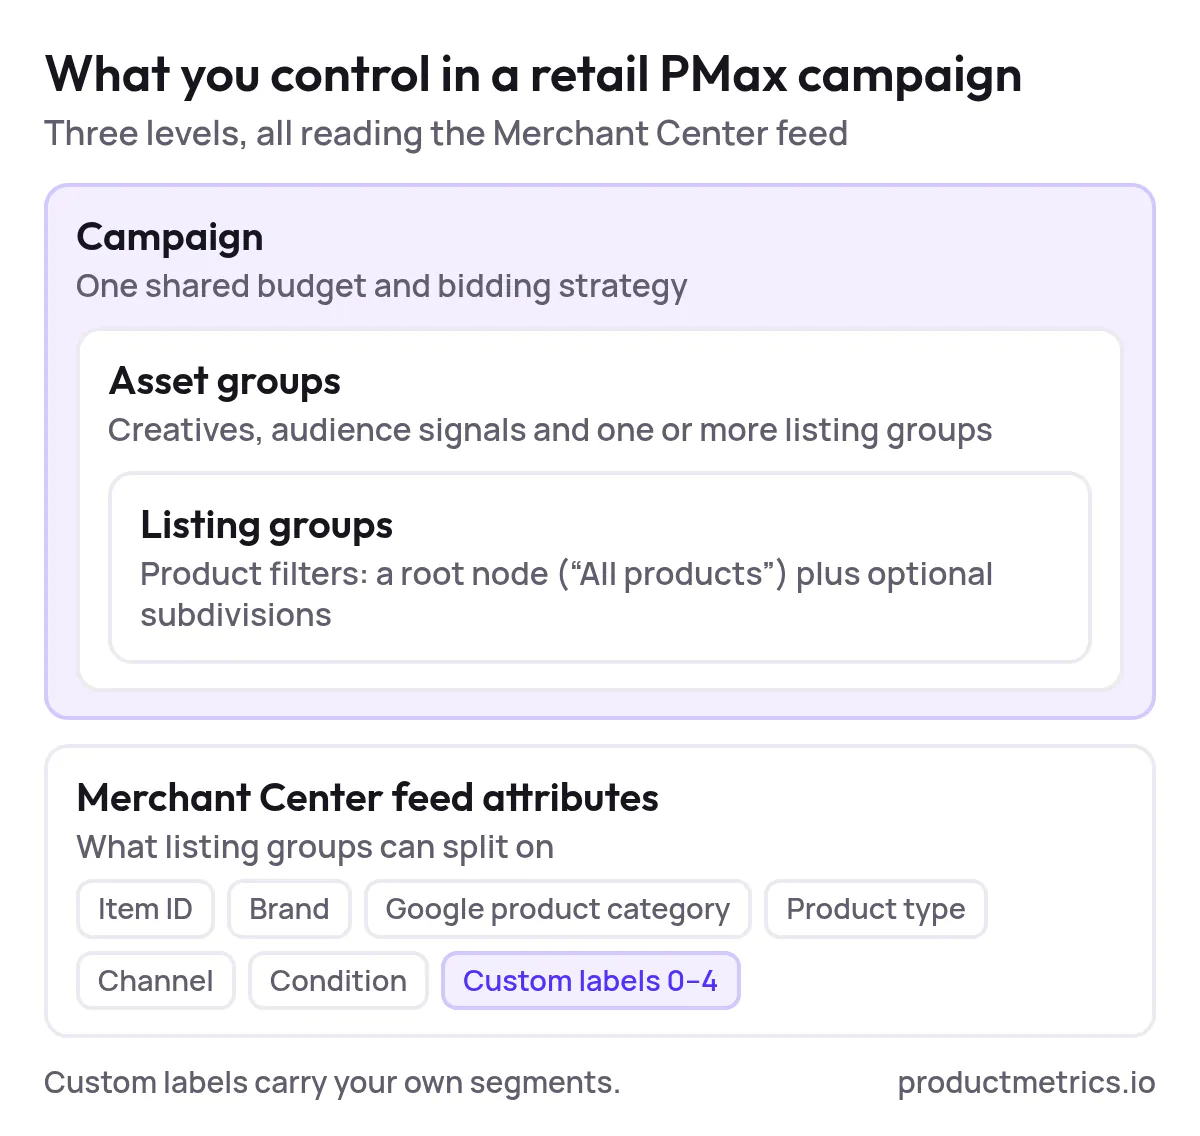
Merchant Center is where you submit your product feed. For PMax retail campaigns, listing groups can be subdivided by attributes like:
- Item ID
- Brand
- Google product category
- Product type
- Channel (online/local)
- Condition
- Custom labels (0–4)
These attributes are what you later use to filter and split products in Google Ads. (Source: Google Ads Help – Manage a Performance Max campaign with listing groups)
Custom labels are especially important: they’re arbitrary text fields you control, designed for internal segmentation (for example, stars, drainers, clearance, high_margin). (Source: Google Merchant Center – Product data specification)
2.2 Listing Groups
In a retail PMax campaign, each asset group contains listing groups that define which products are included. You can think of them as product filters:
- A root node (often “All products”).
- Optional subdivisions based on attributes like product type or custom labels.
Google explicitly warns that creating thousands of listing groups inside a single asset group can hurt performance, and recommends using custom labels for logical groupings instead of ultra‑granular trees. (Source: Google Ads Help – Manage a Performance Max campaign with listing groups)
2.3 Asset Groups and Campaigns
Above listing groups sit asset groups, which bundle:
- Creatives (text, images, video, logos)
- Audience signals
- One or more listing groups
A PMax campaign can have multiple asset groups, but one shared budget and bidding strategy. Structural decisions—how many campaigns, what each campaign’s goal is, and which products live where—are how you translate product strategy into PMax logic. (Source: Google Ads API – Assets in a Performance Max campaign, Search Engine Land – How to set up Performance Max campaigns the right way)
3. A Three‑Stage PMAX Segmentation Model From First Setup to Scale
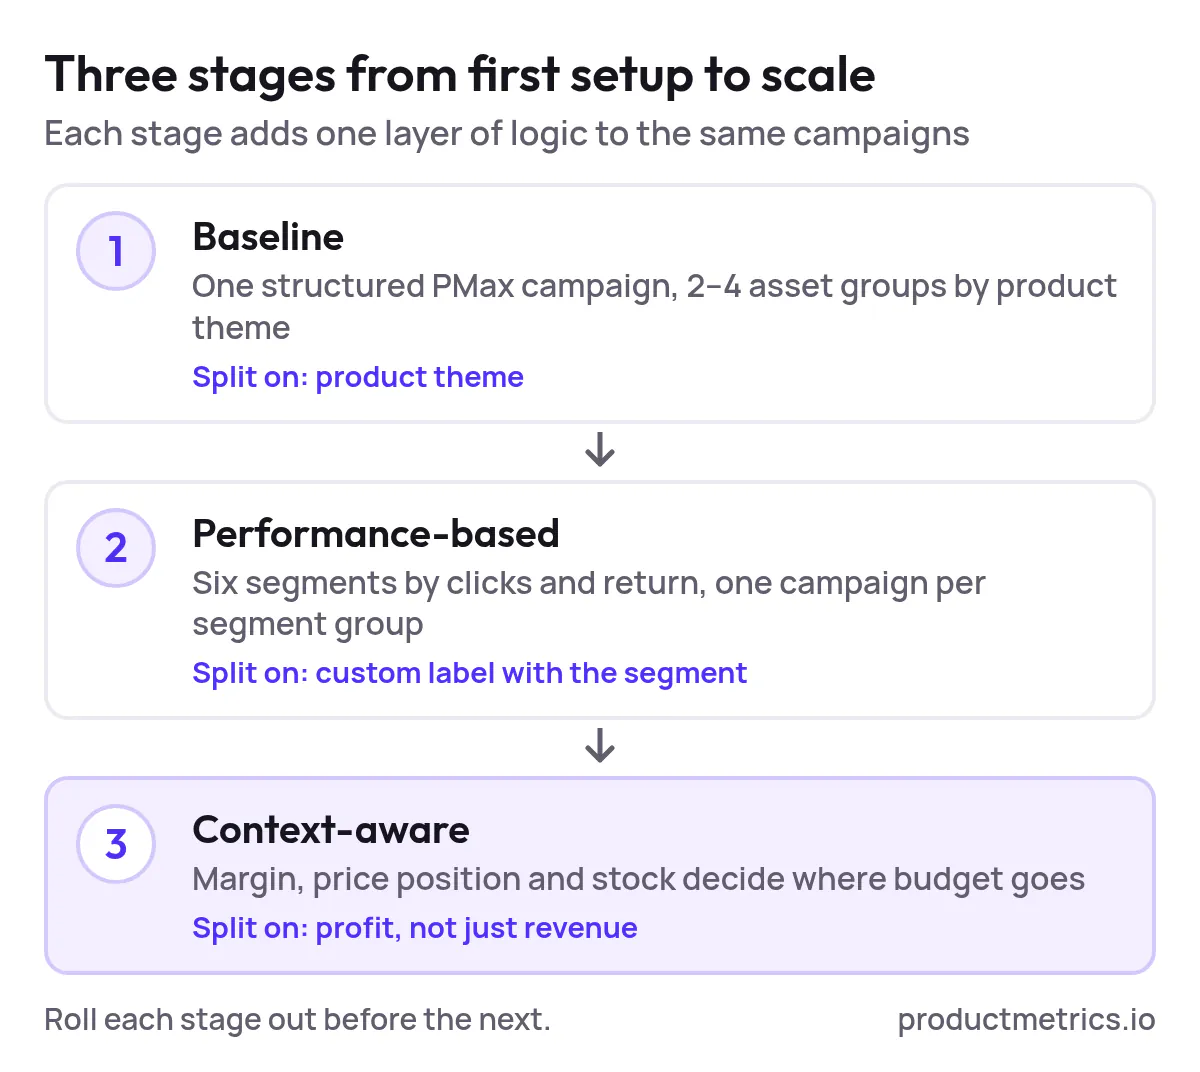
Most teams don’t jump from “all products” to a fully profit‑aware structure in one go. Here’s a three‑stage model you can roll out safely.
Stage 1 - Baseline From “All Products” to One Structured PMax
Goal: Clean baseline. One or two PMax campaigns, clear reporting, zero over‑segmentation.
What it looks like:
- 1 retail PMax campaign covering all products in the main country.
- 2–4 asset groups based on major product themes (e.g., “Running”, “Lifestyle”, “Accessories”).
- Minimal listing‑group splits by product type or brand for reporting only.
Why: This lets Google’s AI learn quickly on a consolidated budget while you collect product‑level data to inform future splits. It also aligns with Google’s recommendation to avoid fragmenting budgets into many small campaigns upfront. (Source: Google – Retailer best practices for AI‑powered Performance Max)
Stage 2 - Performance Based Introduce Profit Driven Segments
Goal: Move from catalog‑based splits to performance‑based segments.
Here you introduce a simple performance segmentation, either manually or using a tool like Product Metrics, which segments products into six buckets by ad clicks and return against your target ROAS/POAS:
- Stars – High volume, above‑target return
- Question Marks – High volume, just under target
- Cash Cows – Low volume, above‑target return
- Dogs – High volume, below target
- Drainers – Low volume, no meaningful return
- Ghosts – No impressions, no spend
Product Metrics does this automatically and writes the result back as Merchant Center labels, so every product carries its segment in a custom_label. (Source: Product Metrics – Product‑Level Google Shopping Optimisation, About Product Metrics)
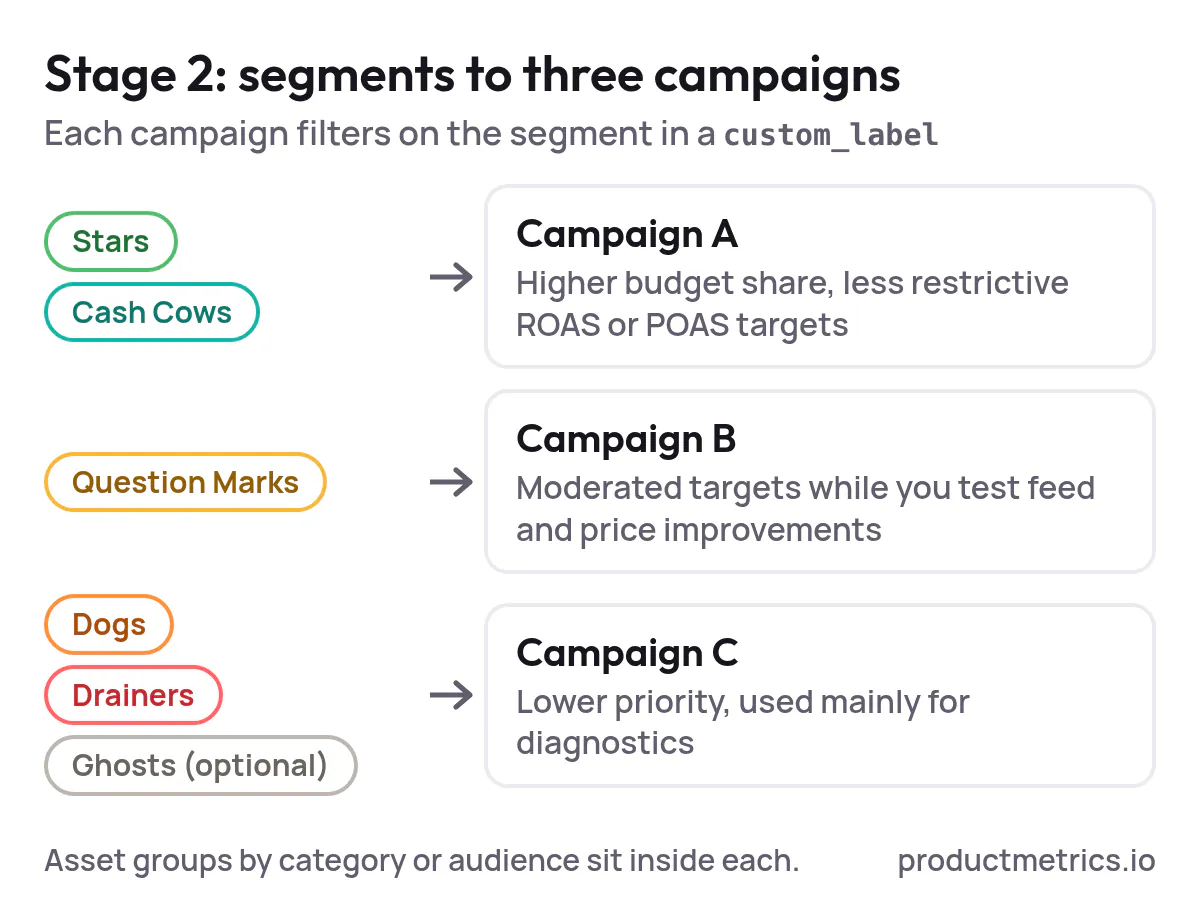
Structure at Stage 2:
- Campaign A – Stars & Cash Cows
- Higher budget share, less restrictive ROAS/POAS targets.
- Campaign B – Question Marks
- Moderated targets; focus on testing feed and price improvements.
- Campaign C – Dogs & Drainers (and maybe Ghosts)
- Conservative bidding or exclusion; used mainly for diagnostics.
Each campaign filters products via a custom_label segment and may still have multiple asset groups by category or audience. (Source: Product Metrics – Google Shopping Segmentation Software Guide)
Stage 3 - Context Aware Layer in Margin Price Position and Stock
Goal: Align PMax segmentation with actual business economics.
At this stage, segments aren’t just about ROAS; they also consider:
- Contribution margin (to calculate break‑even ROAS/POAS)
- Price position versus comparable competitors
- Inventory levels and stock cover
For example, Product Metrics computes break‑even ROAS as 1 ÷ contribution margin and shows how the same ROAS can be profitable for a high‑margin product and loss‑making for a low‑margin one. (Source: Product Metrics – Optimise Google Shopping ads, product by product)
You might then create:
- A High‑margin Stars campaign with relaxed ROAS targets and high budgets.
- A Low‑margin volume campaign with strict ROAS targets and tighter caps.
- A Stock‑pressure campaign for overstocked items, prioritised for visibility even at middling ROAS.
This is where you get to true POAS‑driven PMax, where budget follows profit, not just revenue.
4. Step By Step How to Implement PMAX Product Segmentation in Google Shopping
This section assumes you already have a working PMax retail campaign and a functioning Merchant Center feed.
Step 1 - Export Product Level Performance
From Google Ads, pull a 30–90 day export at the product or listing group level including:
- Item ID
- Product title and category
- Clicks, cost
- Conversions and conversion value
- ROAS or conversion value / cost
If possible, enrich this with contribution margin per product so you can compute break‑even ROAS and POAS. (Source: Product Metrics – Optimise Google Shopping ads, product by product)
Step 2 - Define Your First Segmentation Schema
Start with something you can explain in one sentence. Two common starting points:
- Six‑segment model (volume × return) – Stars, Question Marks, Cash Cows, Dogs, Drainers, Ghosts.
- Margin × performance – e.g., High‑margin winners, High‑margin underperformers, Low‑margin winners, Low‑margin underperformers.
Whichever you choose, write down for each segment:
- Entry criteria (click and ROAS/POAS thresholds, margin thresholds)
- Default action (scale, protect, test, fix, pause)
Product Metrics bakes this into its UI and rule engine, but you can also prototype the logic in a spreadsheet. (Source: About Product Metrics)
Step 3 - Turn Segments Into Merchant Center Labels
Next, you need to make your segmentation real in the feed.
Options:
- Manual / rules‑based
- Use a supplemental feed or feed rules to assign
custom_label_0based on logic you control (for example, mapping Shopify collections or tags to labels likehigh_marginorclearance). (Source: Google Merchant Center – Product data specification)
- Use a supplemental feed or feed rules to assign
- Automated / ML‑based
- Use a platform like Product Metrics, which connects to Google Ads, Merchant Center and your ecommerce platform, segments every product by potential and profitability, and pushes the result back as labels such as
stars,dogsorghosts. (Source: Product Metrics – Product‑Level Google Shopping Optimisation)
- Use a platform like Product Metrics, which connects to Google Ads, Merchant Center and your ecommerce platform, segments every product by potential and profitability, and pushes the result back as labels such as
Either way, your outcome should be: every eligible product in Merchant Center carries the segment in a consistent custom label.
Step 4 - Build or Refactor Your PMax Campaigns Around Labels
In Google Ads:
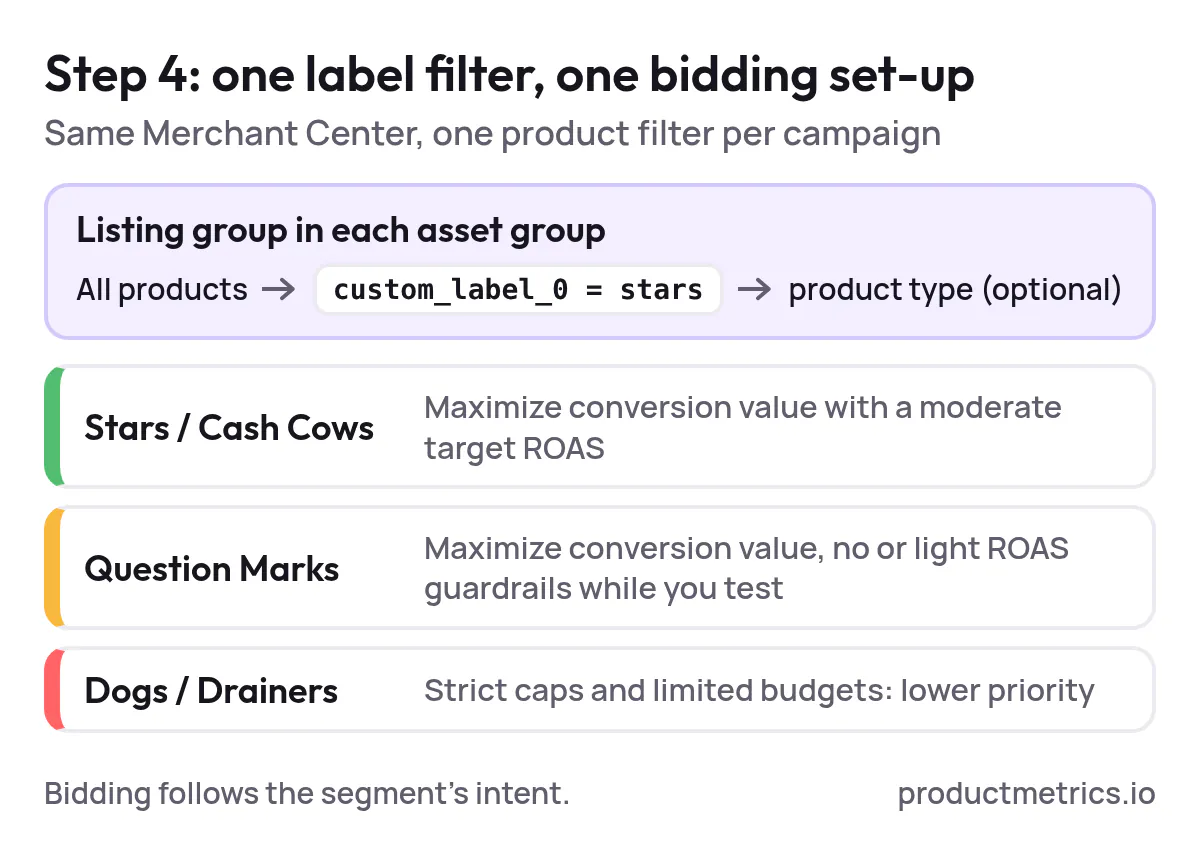
- Create new PMax campaigns for each major segment group (for example, Stars/Cash Cows in one, Question Marks in another, Dogs/Drainers in a third).
- In each campaign’s settings, attach the same Merchant Center account but restrict inventory using a product filter like
custom_label_0 = stars. (Source: Google Ads Help – Manage a Performance Max campaign with listing groups) - Inside each campaign, create asset groups by product theme or audience. Under each asset group, configure listing groups so they include only the intended labeled products (e.g., Stars in the Stars campaign).
- Choose a bidding strategy that matches segment intent:
- Stars/Cash Cows: Maximize conversion value with a moderate Target ROAS
- Question Marks: Maximize conversion value with no or light ROAS guardrails while you test pricing and feed
- Dogs/Drainers: Target ROAS or even Maximize conversions with strict caps and limited budgets
PMax retail campaigns require each asset group to have a valid product partition tree; a common pattern is a root “All products” node filtered by your custom label, with optional subdivisions by product type. (Source: Google Ads API – Listing Groups for Retail)
Step 5 - Run a Structured A/B or Hold Out Test
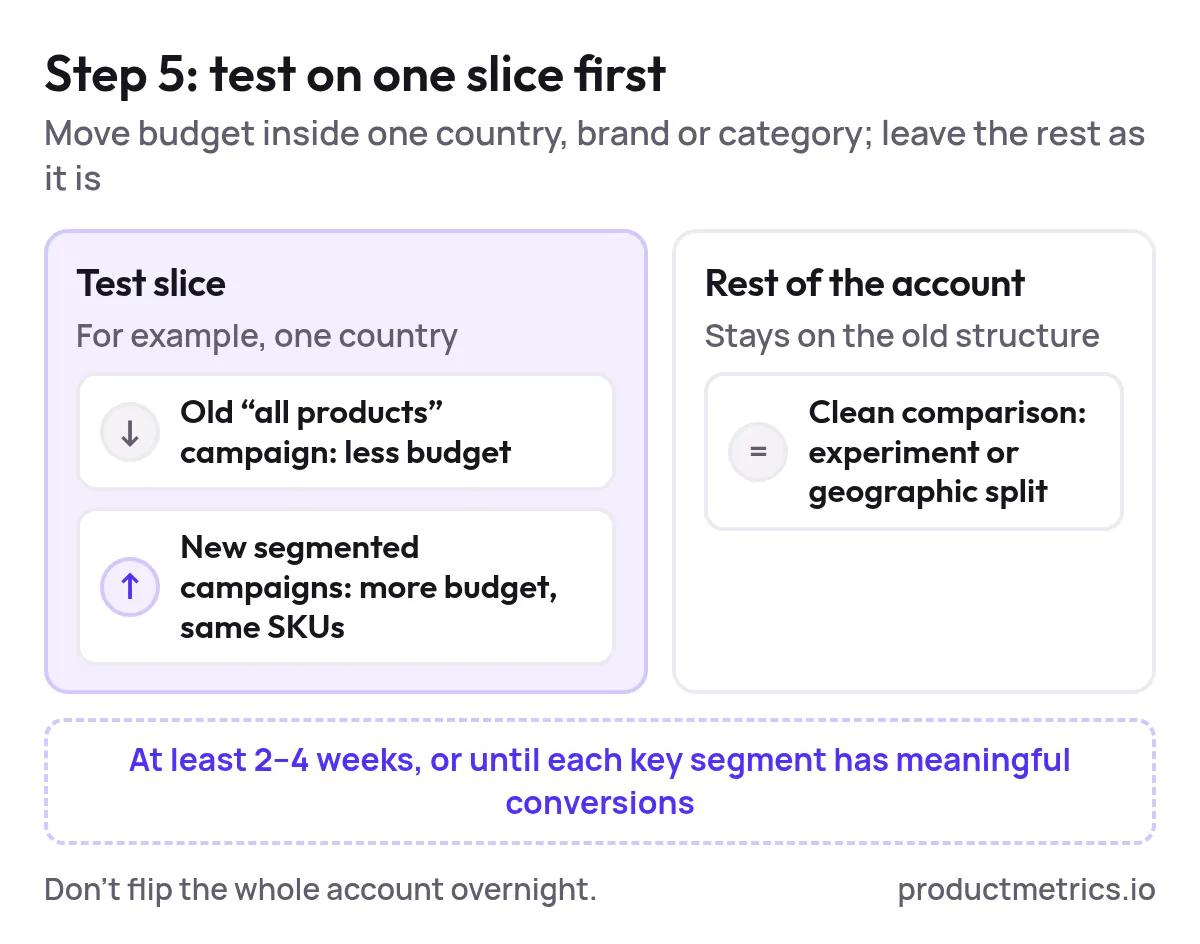
Don’t flip the whole account overnight. Instead:
- Pick one country, brand, or category as a testbed
- Reduce budget on the old “all products” PMax campaign for that slice
- Increase budget on the new segmented campaigns that cover the same SKUs
- Run for at least 2–4 weeks or until each key segment has statistically meaningful conversions
Where possible, use Google’s experiment framework or geographic splits to keep a clean comparison between old and new structures. (Source: Product Metrics – The 2026 Ecommerce ROAS Optimization Tools Landscape)
Step 6 - Iterate Based on Segment Level Results
Using product and channel‑level reporting, look at:
- Spend vs profit contribution by segment (POAS, not just ROAS)
- How quickly Smart Bidding stabilizes in each new campaign
- Whether Stars are gaining impression share and volume without collapsing POAS
Then adjust:
- Move borderline products between Question Marks and Stars/Cash Cows
- Tighten or relax ROAS/POAS targets
- Exclude persistent Drainers from Shopping altogether
Repeat the cycle in new categories or markets once the pattern holds.
5. A 90 Day Test And Learn Roadmap
To make this concrete, here is a simple 90‑day roadmap you can plug into your operating rhythm.
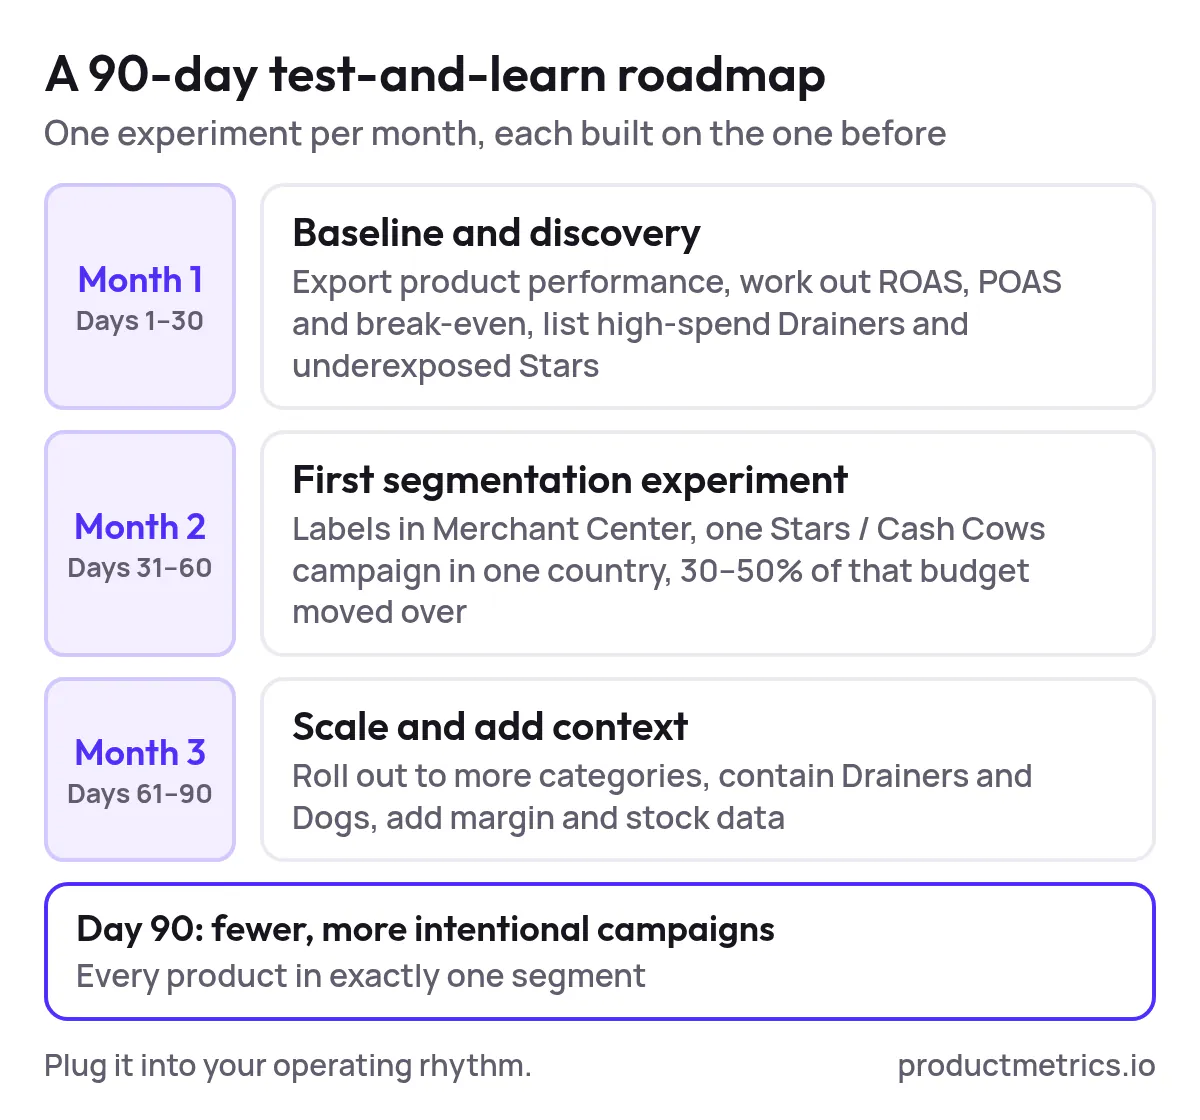
Month 1 - Baseline and Discovery
- Export product‑level performance for the last 60–90 days
- Compute ROAS, POAS and break‑even ROAS by product if you have margin data
- Run a free product‑level analysis in Product Metrics to see your catalog segmented into Stars, Question Marks, Cash Cows, Dogs, Drainers and Ghosts. (Source: Product Metrics – Product‑Level Google Shopping Optimisation)
- Document the worst offenders (high‑spend Drainers) and underexposed Stars
Month 2 - First Segmentation Experiment
- Implement
custom_label‑based segments in Merchant Center (via rules or Product Metrics) - Launch one new PMax campaign just for Stars/Cash Cows in one country
- Reduce budget on the legacy structure for those SKUs by 30–50%, shifting it into the new campaign
- Track:
- POAS and contribution profit for Stars/Cash Cows
- Share of total Shopping spend going to Stars vs Drainers
Month 3 - Scale and Add Context
- If the Stars/Cash Cows campaign shows stable or improved POAS, roll the pattern out across more categories
- Add a Drainers/Dogs campaign with strict caps to contain waste
- Bring in margin and stock data so your next wave of segments can distinguish between high‑margin and low‑margin stars and between overstock and constrained products. (Source: Product Metrics – Product Segmentation)
By the end of 90 days, your PMax structure should be:
- Fewer, more intentional campaigns
- Every product in exactly one segment
- Budgets and targets that follow product‑level profit, not just clicks
6. What to Measure Metrics for PMax Segmentation Effectiveness
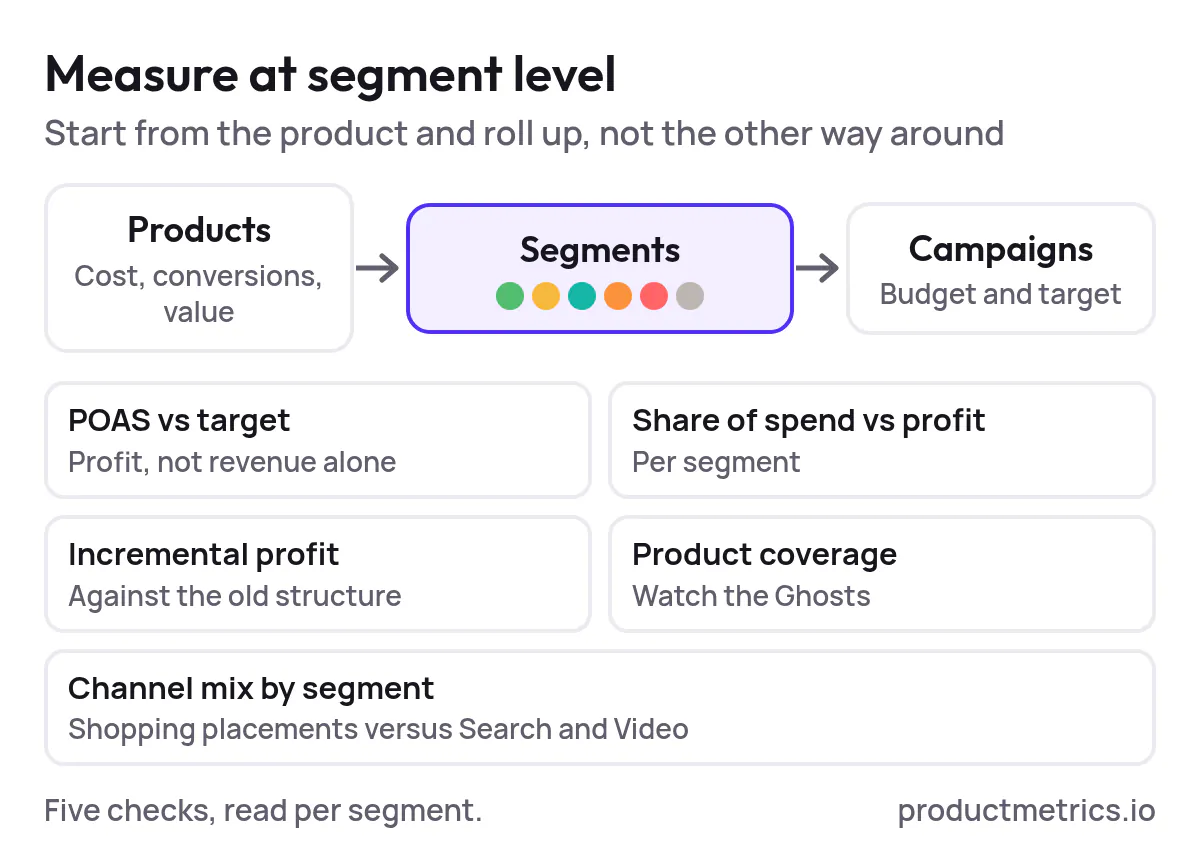
A segmentation project is only as good as its measurement. At minimum, track these at segment level (not just campaign level):
- POAS vs target – Profit on ad spend by segment, using contribution profit per order instead of revenue alone. (Source: About Product Metrics)
- Share of spend vs share of profit – What percentage of Shopping budget and profit each segment represents
- Incremental profit vs baseline – Compare segmented markets or brands against those still on the old structure
- Product coverage – The share of your catalog that actually receives impressions (watch Ghosts carefully)
- Channel mix by segment – Using PMax channel‑level reporting, see whether your Stars are winning in Shopping placements, or mostly in Search/Video where intent and economics may differ. (Source: Google Ads API – Performance Max campaign performance by channel)
Google’s expanded product‑level reporting means you can now build dashboards that start from the product and roll up into campaigns, not the other way around. (Source: Product Metrics – The 2026 Ecommerce ROAS Optimization Tools Landscape)
7. Common Failure Modes in Google Shopping Campaign Segmentation
If you read any PMax thread, you’ll see the same structural mistakes repeat.
7.1 Over Segmentation Into Dozens of Tiny Campaigns
Creating a separate PMax campaign for every brand, category and audience may feel like “control,” but it starves Smart Bidding of data and slows learning. Google explicitly recommends consolidating structures where possible so AI can optimize across a broader pool of conversions. (Source: Google – Retailer best practices for AI‑powered Performance Max)
A better pattern is fewer campaigns with clear segments encoded via labels and listing groups.
7.2 Category Only Thinking
Segmenting only by catalog taxonomy (e.g., Shoes vs Accessories) ignores the fact that two SKUs in the same category can have radically different margins, price competitiveness and roles in the assortment.
Performance‑based clustering—grouping products by actual behavior and profitability—beats taxonomy‑only splits. This is exactly the gap ML‑driven tools like Product Metrics aim to fill. (Source: Product Metrics – Product‑Level Google Shopping Optimisation)
7.3 Ignoring Feed Quality
No segmentation framework can rescue a broken feed. Inconsistent product types, missing brands, poor titles or incorrect availability fields all limit what PMax can do. Google and practitioners consistently emphasize that feed quality is one of the highest‑leverage levers for Shopping performance. (Source: Google Ads Help – Manage a Performance Max campaign with listing groups, Search Engine Land – How to set up Performance Max campaigns the right way)
Make feed cleanup part of your segmentation project, not an afterthought.
7.4 Trusting Revenue Level ROAS
A campaign ROAS of 3.5 might look healthy until you realize that:
- For a product with 50% contribution margin, break‑even ROAS is 2.0
- For a product with 20% contribution margin, break‑even ROAS is 5.0
In that example, the same 3.5 ROAS is profit‑positive for one SKU and loss‑making for another. (Source: Product Metrics – Optimise Google Shopping ads, product by product)

Product Metrics – Optimise Google Shopping ads, product by product
Show the dataHide the data
| Contribution margin | Break-even ROAS |
|---|---|
| 50% margin | 2.0 |
| 20% margin | 5.0 |
Segmenting by POAS and break‑even, not just top‑line ROAS, is non‑negotiable once your budgets are significant.
7.5 Not Closing the Loop With Tracking
PMax relies on clean conversion tracking. If ad blockers or browser privacy features are stripping out a meaningful share of your conversions, Smart Bidding is optimizing on incomplete data. Platforms like Product Metrics include server‑side, ad‑blocker‑resistant tracking to restore lost conversions and send higher‑quality signals back to Google Ads. (Source: Product Metrics – Product‑Level Google Shopping Optimisation)
Without that layer, it’s easy to misjudge whether a new segmentation structure is “working” when the issue is really missing signal.
8. Where Tools Fit And How Product Metrics Helps
You can implement a basic version of this playbook with Google’s native stack alone. But as catalogs grow into the thousands of SKUs, doing it by hand quickly stops scaling.
Broadly, teams combine three tool types:
- Native Google stack – Google Ads, Merchant Center, GA4, Looker Studio
- Feed management tools – Transform and distribute feeds to many channels, often with rule‑based labeling
- Product level optimisation platforms – Specialised in segmentation, profit awareness, price position and product‑level tracking
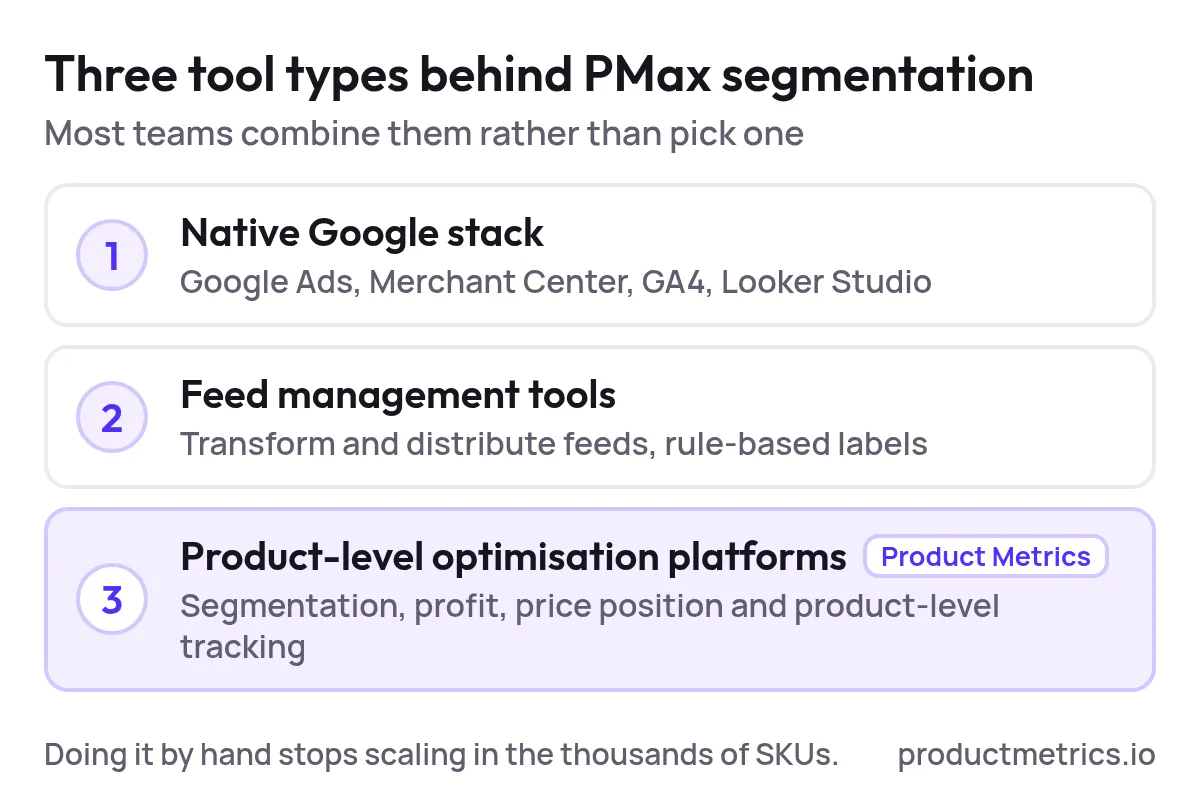
Product Metrics sits in the third category:
- ML‑based segmentation – Every product is assigned to one of six segments (Stars, Question Marks, Cash Cows, Dogs, Drainers, Ghosts) based on volume and return against your target ROAS or POAS. (Source: About Product Metrics)
- Merchant Center labels out‑of‑the‑box – Approved segments and product rules are exported as custom labels your Shopping and PMax campaigns can use directly. (Source: Product Metrics – Product‑Level Google Shopping Optimisation)
- Product context – For each SKU, you can see journeys, price position versus comparable competitors, margin and inventory context before deciding whether to push, fix or pause it. (Source: Product Metrics – Product Segmentation)
- Signal‑resilient tracking – Server‑side tracking with auto‑rotation is designed to get through ad blockers and privacy filters, preserving conversion signals for Smart Bidding. (Source: Product Metrics – Product‑Level Google Shopping Optimisation)
Pricing is a graduated share of your rolling 30‑day Google Shopping spend, with the first €10,000 per month free and effective rates dropping as you scale, which makes it attractive for teams that want segmentation and profit optimisation to pay for themselves. (Source: Product Metrics – Pricing)
If you already manage seven‑figure Shopping budgets and you’re still running PMax with a single “all products” campaign, implementing a segmentation‑first structure is one of the highest‑ROI projects you can run this year.
The fastest way to start is to see your own catalog through a segmentation lens:
- Run a free analysis in Product Metrics to see how your products fall into Stars, Question Marks, Cash Cows, Dogs, Drainers and Ghosts
- Decide which segments deserve more budget, which need fixing, and which should be paused
- Turn those decisions into Merchant Center labels and PMax campaigns you can iterate on every month
That’s how you move from “hoping PMax does the right thing” to a setup‑to‑scale playbook your team can run—and improve—quarter after quarter.
Written by
Berend Vrakking, Founder of Product Metrics
1M+ products analysed · Nominated at the Dutch Search Awards for Best Measurement Campaign (2023) and Best Use of Data (2024)
Keep reading.
Product Segmentation Marketing: Six Segments, Six Actions
Product segmentation marketing groups every advertised product by ad clicks and ROAS or POAS, so Shopping and Performance Max prioritise the right ones.
Data-Driven PMAX: Customer Signals, Listing Optimization, and What’s Next
Data-Driven PMAX: turn first-party customer signals and product data into Performance Max segments, custom labels and asset groups that protect margin.
Performance Max For New Customers - Setup, Value Rules, And Bidding Uplifts
Performance Max for new customers - setup, the three NCA modes, how much extra to value a new customer, value rules and campaign structure.
See which of your products to push, fix or pause. Start with your own products, or a 30-second estimate.
Check one product first: work out its break-even ROAS in the calculator. Then see where all your products stand.
Questions, or want to spar about your products? Book a demo: a video call with Berend, then a demo account.