
Best POAS Tracking Tools for E‑commerce and Google Ads A Practical Buyer’s Guide
Compare POAS tracking tools for Google Ads and Shopping: native Google reports, profit apps, attribution platforms and product-level POAS, by business size.
If you’re still optimising Google Ads and Google Shopping on ROAS alone, you’re very likely scaling campaigns that look good in revenue but quietly lose money once costs are counted.
Profit on ad spend (POAS) fixes that—but only if your tracking stack can actually measure profit per order, per product, and per campaign, then feed it back into Google Ads in a way bidding algorithms can use.
This guide is written to help you:
- Understand what POAS really measures and how it differs from ROAS.
- See the main types of POAS tracking tools in the market.
- Compare strengths, trade‑offs and fit across business sizes.
- Shortlist the best POAS tracking stack for your Google Ads and Shopping setup.
Throughout, we’ll use examples from widely used tools and from Product Metrics (productmetrics.io), which is built specifically for product‑level POAS optimisation in Google Ads and Performance Max.
1. POAS 101 What You’re Actually Optimising
Profit on ad spend (POAS) is the profit your ads generate, divided by the ad spend that drove it.
Product Metrics defines POAS as:
POAS = contribution profit before advertising ÷ ad spend
(where contribution profit = revenue minus product and variable order costs like shipping, payment fees and returns, excl. tax and before ad spend)
(Source: Product Metrics – POAS glossary)
Two useful consequences:
- POAS = ROAS × contribution margin. If two products share the same ROAS but very different margins, their POAS can be radically different. (Source: Product Metrics – POAS vs ROAS)
- Break‑even POAS is 1.0 when you define profit as contribution profit before advertising. A POAS above 1 adds money after ads; below 1 burns money. (Source: Product Metrics – POAS glossary)
In practice, POAS answers a different question from ROAS:
- ROAS: “How much revenue did I get for each dollar of ad spend?”
- POAS: “How much profit (after product and variable costs) did I keep for each dollar of ad spend?”
For Google Ads and Performance Max, that distinction is critical. Three SKUs can all sit at a ROAS of 4 while one is loss‑making, one breaks even, and one is highly profitable once margins and variable costs are applied. (Source: Product Metrics – POAS vs ROAS)

Show the dataHide the data
| Contribution margin | POAS |
|---|---|
| 20% | 0.8 |
| 25% | 1.0 |
| 40% | 1.6 |
A POAS tracking tool’s job is to surface that truth at the level where you make decisions—per campaign, ad group, product, and sometimes per creative.
2. What POAS Tracking Tools Actually Do
Most “POAS tools” combine three capabilities:
-
Profit calculation
- Pull order‑level revenue from your ecommerce platform.
- Join it with cost of goods sold (COGS) and other variable costs (shipping, payment fees, refunds, etc.). (Source: Wikipedia – Cost of goods sold)
- Calculate gross or contribution profit per order and often per product.
- Example: TrueProfit computes net profit by subtracting COGS, shipping, handling, transaction fees, ad spend and custom costs from revenue, then exposes those profit figures at order and product level. (Source: TrueProfit – How TrueProfit calculates your Net Profit)
-
Attribution and joining profit to ad spend
- Import ad spend and click data from platforms like Google Ads, Meta, and TikTok.
- Attribute orders back to campaigns, ad groups or ads using tracking parameters or server‑side tracking.
- Compute metrics like POAS = profit ÷ ad spend per channel, campaign or ad.
- Example: Triple Whale exposes a
poasmetric defined as “Profit on Ad Spend = Gross Profit / Blended Spend” alongside ROAS and MER in its summary metrics table. (Source: Triple Whale – Summary Metrics Table) - Example: TrueProfit’s attribution module reports “Net Profit on Ad Spend (POAS) = Net Profit / Ad Spend” per channel and campaign. (Source: TrueProfit – Marketing attribution overview)
-
Activation back into ad platforms
- Send profit‑based values into ad platforms so automated bidding can optimise on POAS instead of revenue.
- Or, in Google Ads, write product‑level labels (custom labels in Merchant Center) that express which SKUs deserve more or less budget.
Examples:
- Google Ads conversions with cart data combine purchase cart data with COGS from Merchant Center to derive gross profit and gross profit margin per order and per product for Shopping campaigns. (Source: Google Ads Help – Metrics available with conversions with cart data, Google Ads API – Product reporting for Shopping ads)
- ProfitMetrics tracks both revenue and gross profit as separate conversion actions in Google Ads, so advertisers can read POAS columns and move to profit‑based bidding strategies. (Source: ProfitMetrics – How to use POAS in Google Ads)
- Stape’s POAS Data Feed sends profit or margin values rather than revenue into analytics and ad platforms, including Google Ads and Meta, so bidding can directly optimise for profit. (Source: Stape – POAS Data Feed)
- Product Metrics sends profit, revenue, new vs returning customer flags and lifetime value to Google Ads and Meta as conversion values, and writes product‑level labels into Merchant Center for Shopping and Performance Max. (Source: Product Metrics – Product Metrics vs ProfitMetrics)
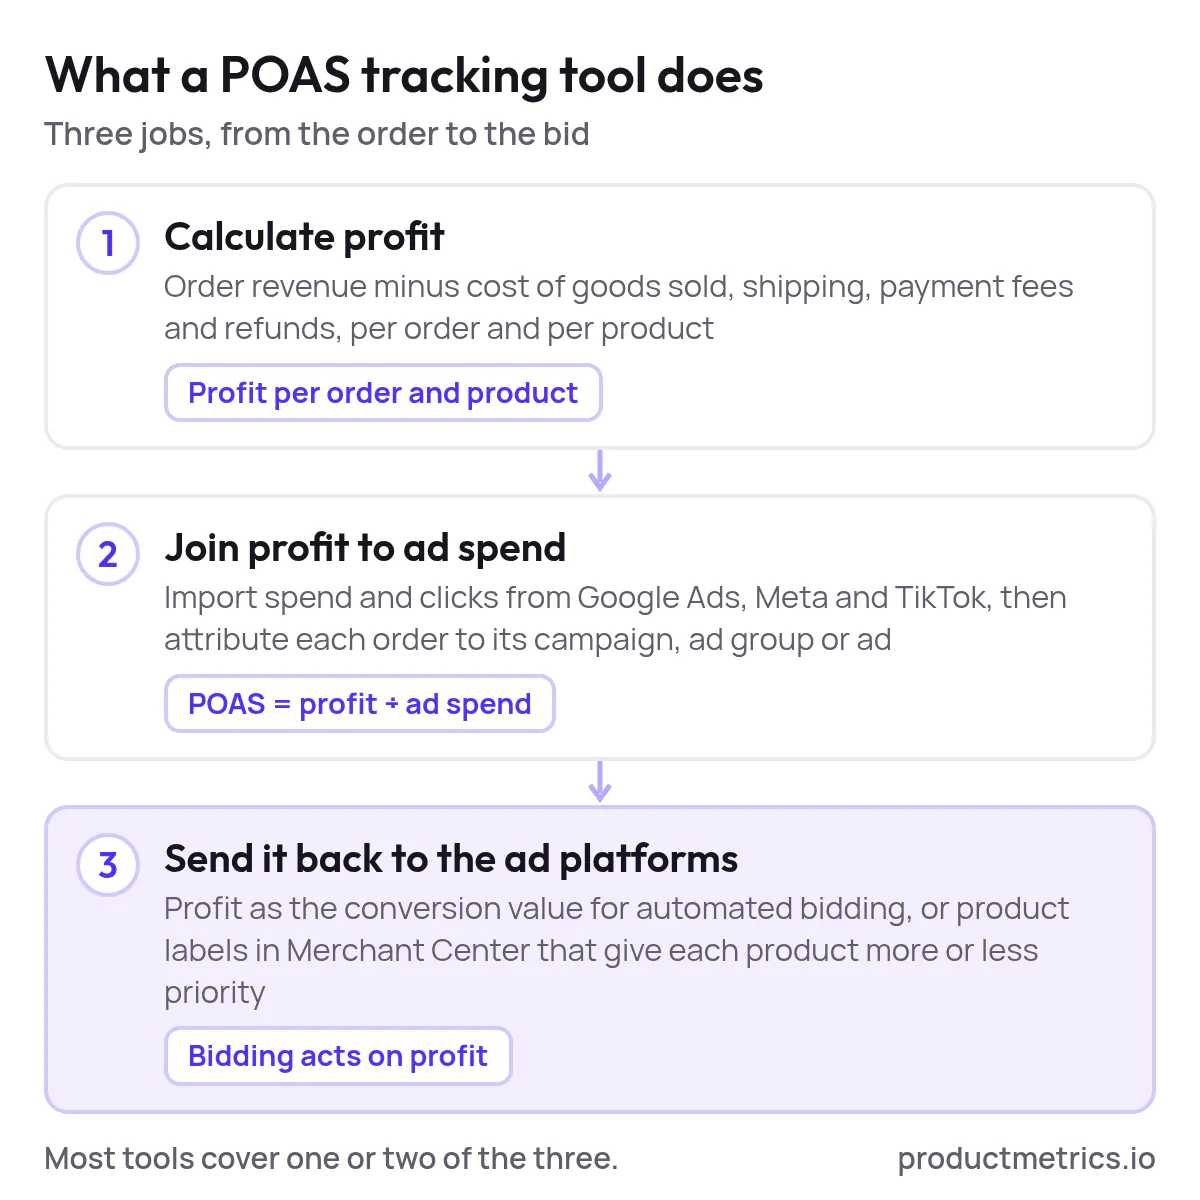
When you evaluate POAS tracking tools, you’re really choosing how you want to calculate profit, where you want to see it, and how tightly it should feed into Google’s bidding.
3. Types of POAS Tracking Solutions and When They Fit
Below are the main categories you’ll encounter when searching for the best tools for POAS tracking in Google Ads optimisation.
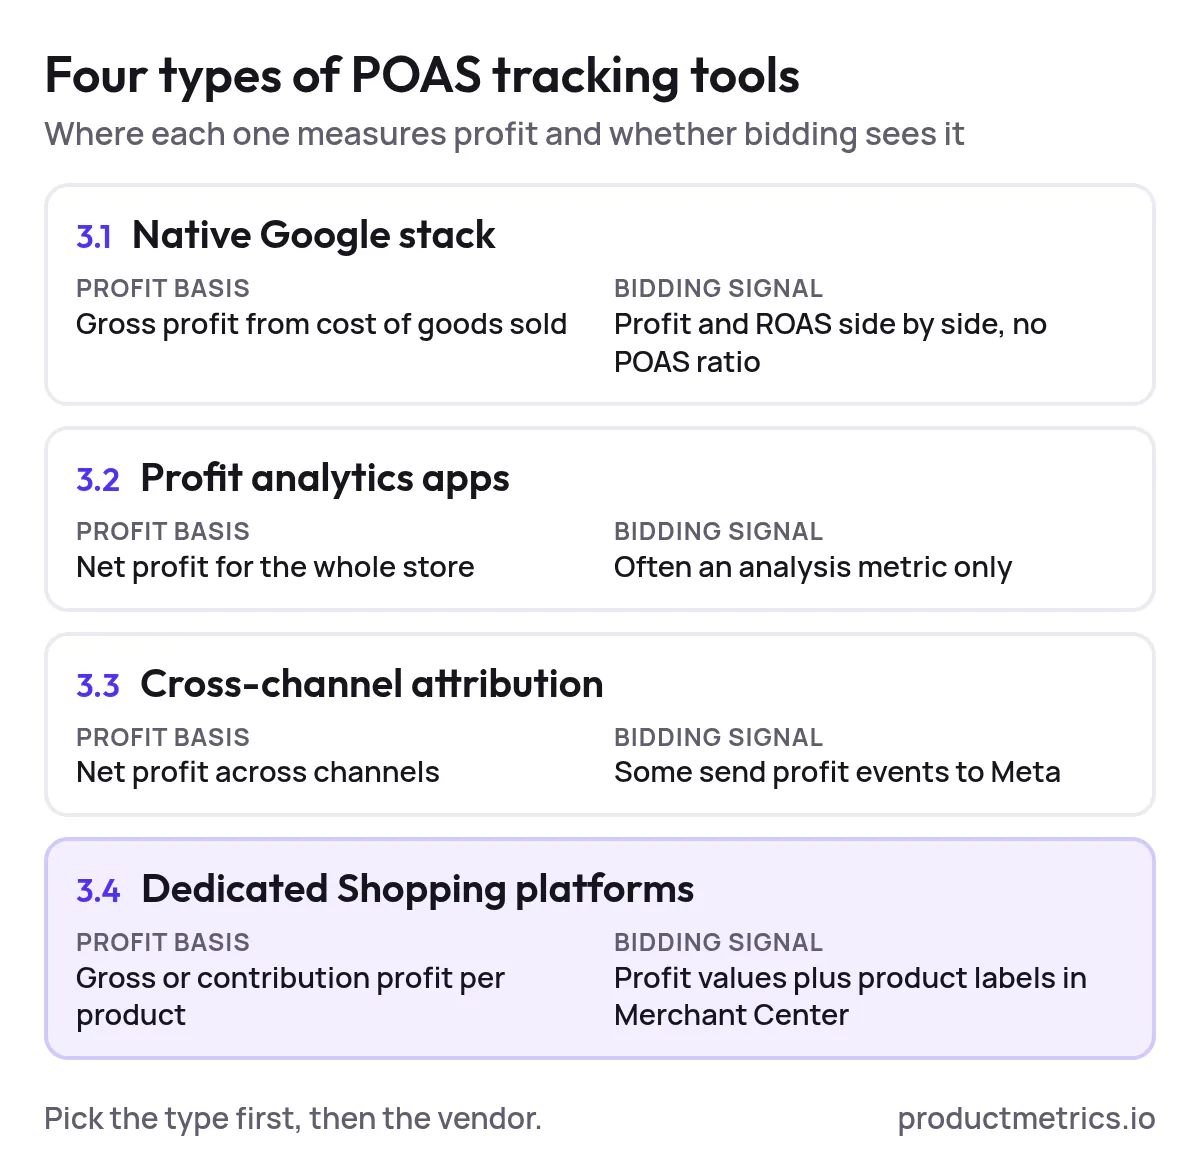
3.1 Native Google Stack Conversions With Cart Data Plus Product Reporting
If you want a low‑cost starting point and you already use Google Ads conversion tracking, start here.
- With Conversions with cart data, your website or app sends item‑level cart data (item IDs, quantities, prices) with purchase conversions. Combined with a COGS field in your Merchant Center feed, Google Ads can report gross profit and gross profit margin for Shopping campaigns. (Source: Google Ads Help – About conversions with cart data, Google Ads Help – Metrics available with conversions with cart data)
- Product‑level Shopping Performance View and the Products tab then show metrics like revenue, COGS, gross profit and gross profit margin per item ID across Shopping and Performance Max campaigns. (Source: Google Ads API – Product reporting for Shopping ads, Google Ads Help – About Product Reporting)
Strengths
- No extra vendor cost.
- Tight integration with Google Ads and Merchant Center.
- Product‑level view directly in Google’s UI and API.
Limitations
- Uses gross profit based on COGS, not full contribution profit that includes shipping, payment fees and returns.
- Does not subtract ad spend, so you see profit and ROAS side by side, but not a POAS ratio out of the box.
- No extra context like stock, competitor prices or customer type.
Best for: brands with modest catalogues and data teams comfortable extending Google’s metrics with spreadsheets or BI.
3.2 Ecommerce Profit Analytics Apps Shopify‑First
A second group are store‑level profit analytics tools, primarily for Shopify, that also expose POAS metrics.
Examples include tools like TrueProfit, BeProfit, Lifetimely and similar apps frequently listed in independent rankings of Shopify profit and POAS tools. (Source: Omniconvert – Best POAS and profit tracking tools for Shopify, Instirio – Best ecommerce profit analytics tools)
Typical capabilities:
- Pull order data, COGS, shipping, transaction fees, refunds and ad spend to compute real‑time net profit. (Source: TrueProfit – How TrueProfit calculates your Net Profit)
- Show profit and net margin by product, order and channel.
- Offer Net Profit on Ad Spend / POAS as a KPI so you can see how much net profit you earn per dollar of ad spend. (Source: TrueProfit – Product Analytics overview, TrueProfit – Marketing attribution overview)
Strengths
- Very fast to set up on Shopify (and sometimes WooCommerce) with app‑store installs.
- Excellent store P&L visibility and unit economics.
- Good fit for founders who want “how much did we really make yesterday?” more than granular Shopping control.
Limitations
- Google Ads and PMax are usually just one channel in a blended dashboard.
- Many apps don’t write profit values back into Google Ads as primary conversions, so POAS remains an analysis metric, not a bidding signal.
- Product views can be limited if you have very large catalogues.
Best for: small to mid‑size Shopify brands that need net profit analytics first, and Google Ads optimisation second.
3.3 Cross‑Channel Analytics And Attribution Platforms With POAS
Next are multi‑channel analytics and attribution platforms that now include POAS metrics:
- Triple Whale joins store data, advertising data and expenses to calculate net profit and exposes POAS (Profit on Ad Spend) as a metric alongside ROAS, MER and others. (Source: Triple Whale – Summary Metrics Table, Triple Whale – Input your expenses & track profitability)
- ROASfinity pulls orders next to Meta and Google ad spend, reporting MER and POAS (profit on ad spend) for ecommerce brands. (Source: ROASfinity – Ecommerce Marketing Analytics)
- Other attribution platforms such as Admetrics, Northbeam or Rockerbox also emphasise profit and POAS in their DTC positioning. (Source: Instirio – Best ecommerce profit analytics tools)
Strengths
- Strong cross‑channel view: Meta, Google, TikTok, email and more in one place.
- Good for media mix and creative decisions (which channel or creative to scale).
- Some can also send enhanced, profit‑based events back to Meta and other platforms for profit‑optimised bidding. (Source: Triple Whale – Optimize Meta campaigns for profit margin)
Limitations
- Google Ads and PMax are usually one tab among many, not a first‑class, SKU‑level surface.
- Product‑level structures (Merchant Center labels, Shopping segmentation) are typically out of scope.
Best for: brands spending heavily across many channels where cross‑channel profit attribution is the primary question.
3.4 Dedicated Profit‑Based Bidding And Shopping Optimisation Platforms
Finally, there is an emerging class of tools built specifically for profit‑based optimisation in Google Ads and Performance Max.
Representative tools in this category include ProfitMetrics, Adchieve and Product Metrics.
-
ProfitMetrics focuses on profit‑based bidding on Google Ads and Meta. It tracks both revenue and gross profit as conversions, exposes POAS columns in Google Ads, and offers Shopping Booster rules that label products by POAS tiers (highly profitable, profitable, unprofitable, no‑traffic) to control Shopping bids. (Source: ProfitMetrics – How to use POAS in Google Ads)
-
Adchieve offers performance management for retail and travel advertisers; its whitepapers highlight POAS as a core metric for profit‑focused bid optimisation in Google Ads. (Source: Adchieve – Retail Paid Search Guide)
-
Product Metrics (productmetrics.io) is purpose‑built for product‑level Google Ads and Performance Max optimisation on ROAS or POAS:
- Segments every product into six segments (Stars, Question Marks, Cash Cows, Dogs, Drainers, Ghosts) based on ad volume and ROAS/POAS against your target.
- Adds product context such as journeys, margin, stock and competitor prices around each SKU.
- Writes approved segments into Merchant Center custom labels, so your Shopping and PMax structures can automatically route budget to the right products.
- Supports Shopify, WooCommerce, Magento, Lightspeed and Shopware 6, and sends profit, revenue, new/returning customer flags and LTV to Google Ads and Meta.
- Includes Full Signal Tracking: server‑side, first‑party tracking from your own domain that gets through ad blockers and Safari ITP limits, so more of your profitable orders are actually seen by bidding algorithms.
(Sources: Product Metrics – Homepage, Product Metrics – Product Journeys, Product Metrics – WooCommerce integration, Product Metrics – Product Metrics vs ProfitMetrics)
Strengths
- Designed around Google Ads and Performance Max, not generic channel reporting.
- Built‑in support for POAS, ROAS, product‑level margin and stock in one decision layer.
- Ability to both send profit values and control product‑level segmentation via labels.
Limitations
- Narrower scope than full analytics suites (less focus on email, content, or multi‑touch attribution).
- Best suited to brands with meaningful Shopping/PMax spend and sizeable catalogues.
Best for: retailers and DTC brands whose growth is driven heavily by Shopping/PMax, and agencies managing multi‑SKU accounts who need product‑level POAS and segmentation, not just channel‑level ROAS.
4. Evaluation Criteria How to Judge POAS Tracking Tools
When you compare top solutions for POAS tracking in ecommerce, use a consistent scorecard. Below are the criteria we see matter most in practice.
4.1 Cost Coverage And Profit Definition
Ask:
- Which costs are included—COGS only, or also shipping, payment fees, handling, refunds and other variable costs?
- Does the tool work in gross profit, contribution profit, or net profit after ad spend?
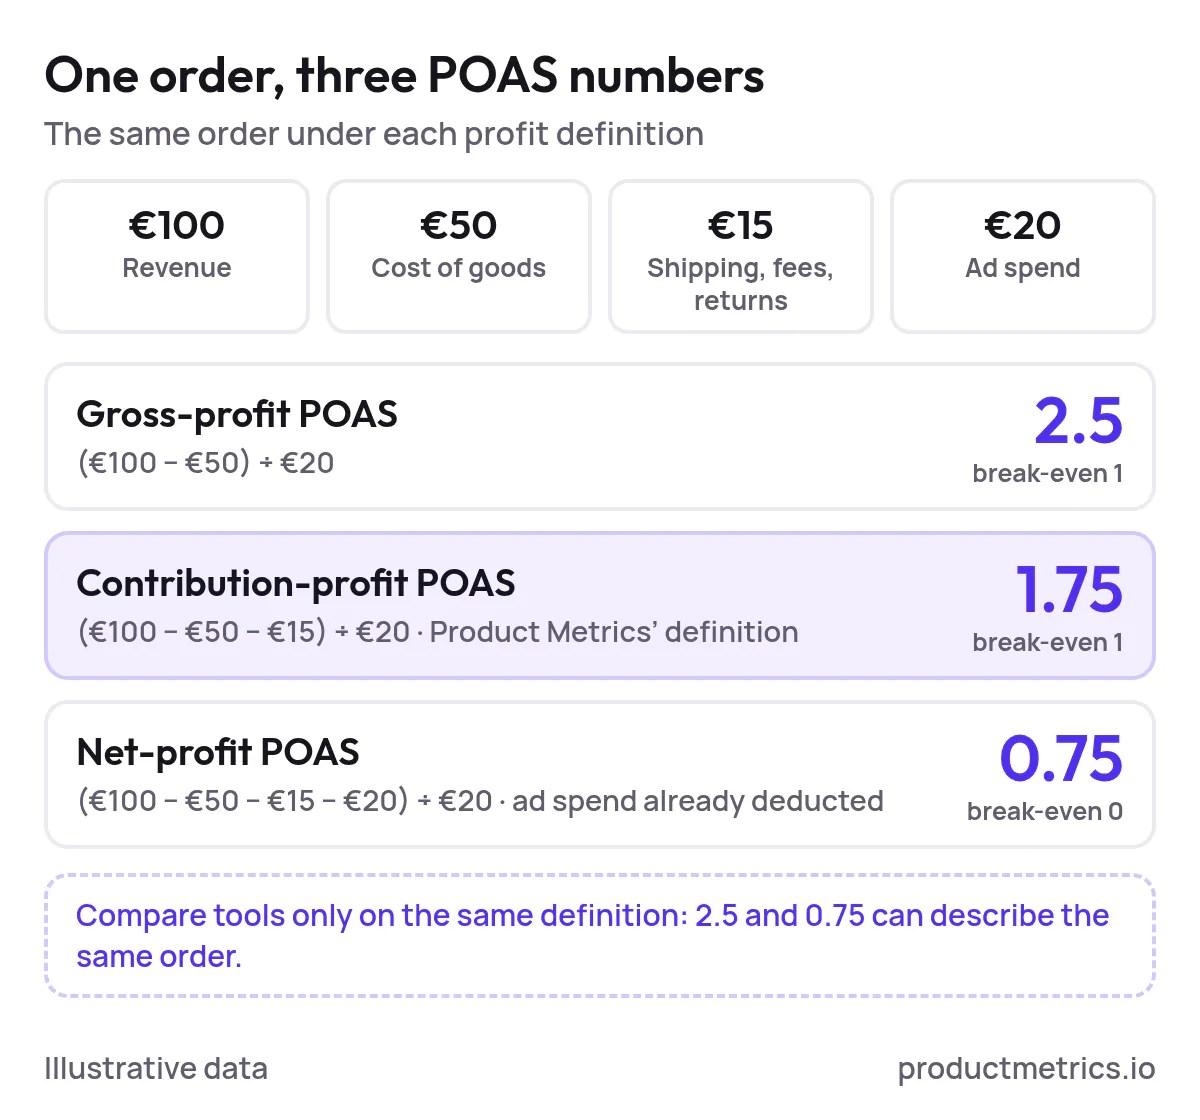
- Which POAS definition does it expose (e.g., gross‑profit‑based POAS vs net‑profit‑based POAS)?
For example:
- Product Metrics defines POAS using contribution profit before ad spend as numerator. (Source: Product Metrics – POAS glossary)
- Triple Whale defines POAS as gross profit divided by blended spend. (Source: Triple Whale – Summary Metrics Table)
- TrueProfit reports “Net Profit on Ad Spend” as net profit (after all tracked costs) divided by ad spend. (Source: TrueProfit – Marketing attribution overview)
None of these are “wrong”, but they answer slightly different questions. Match the tool’s definition to how your finance team thinks about profit.
4.2 Google Ads And Shopping Integration Depth
Key checks:
- Conversions with cart data & COGS: Can the tool help you set this up or at least coexist cleanly with it, so you unlock native Google gross profit and margin metrics? (Source: Google Ads Help – Metrics with conversions with cart data)
- Profit as conversion value: Can it send profit or margin as a conversion value to Google Ads (via browser or server‑side), either replacing revenue or as an additional conversion action?
- ProfitMetrics does this through its Conversion Booster setup. (Source: ProfitMetrics – How to use POAS in Google Ads)
- Product Metrics sends profit, revenue, new/returning flags and LTV to Google Ads and Meta as conversion values. (Source: Product Metrics – Product Metrics vs ProfitMetrics)
- Product‑level labels: Can it write performance‑based labels into Merchant Center so your Shopping and PMax structures can bid differently on different SKUs?
- ProfitMetrics’ Shopping Booster writes custom labels based on POAS and traffic. (Source: ProfitMetrics – How to use POAS in Google Ads)
- Product Metrics segments each SKU and writes the segments you approve to Merchant Center labels. (Source: Product Metrics – Homepage)
4.3 SKU‑Level Fidelity Versus Channel‑Level Views
If Shopping and PMax drive a big slice of your revenue, you need product‑level insight, not just “Google Ads” as one line in a channel report.
Google itself now offers product‑level metrics via the Products tab and Shopping Performance View when your campaigns are linked to Merchant Center. (Source: Google Ads Help – About Product Reporting)
A POAS tool should at least match this fidelity; the best ones go further by joining margin, stock, journeys and competitor prices at SKU level. (Source: Product Metrics – Product-Level Google Ads Optimisation)
4.4 Tracking Robustness Under Privacy And Ad Blockers
Browser tags alone increasingly under‑report conversions, especially on Safari and for users with ad blockers. Tools differ in how they handle this:
- Product Metrics’ Full Signal Tracking runs server‑side from your own domain, bypassing ad blockers and extending cookie lifetimes, and sends confirmed orders (including profit and LTV) to Google Ads and Meta. (Source: Product Metrics – WooCommerce integration, Product Metrics – Product Metrics vs ProfitMetrics)
- ProfitMetrics’ Conversion Booster is also server‑side, but the Product Metrics comparison notes that it can still be blocked by some ad blockers. (Source: Product Metrics – Product Metrics vs ProfitMetrics)
- Stape’s POAS Data Feed is another server‑side option for sending profit‑based conversions. (Source: Stape – POAS Data Feed)
If your current tracking routinely loses 20–40% of orders, moving to a server‑side, profit‑first setup can lift both reported POAS and the stability of bidding.

Show the dataHide the data
| Orders missed by tracking | Reported POAS |
|---|---|
| 0% missed | 1.5 |
| 20% missed | 1.2 |
| 40% missed | 0.9 |
4.5 Daily Workflow And Team Fit
Consider:
- Who will live in the tool most days—founder, performance marketer, BI team?
- Does it show clear “do this next” outputs (e.g., product segments with suggested actions) or mainly dashboards?
- Can multiple stores/clients be managed cleanly if you’re an agency? (e.g., Product Metrics supports MCC connections for agencies running many Google Ads accounts.) (Source: Product Metrics – Product-Level Google Ads Optimisation)
4.6 Pricing Model Versus Your Shape Of Business
You’ll see three main pricing models:
- Flat SaaS fee by store (common with profit analytics apps like TrueProfit). (Source: TrueProfit – Pricing overview)
- Per‑order usage (e.g., ProfitMetrics via its Shopify listing). (Source: Product Metrics – Product Metrics vs ProfitMetrics)
- Share of Shopping ad spend (Product Metrics: first €10k of rolling 30‑day Google Ads spend free, then graduated percentages). (Source: Product Metrics – Product Metrics vs ProfitMetrics)
Match the model to where your variability sits (orders vs ad spend) and sanity‑check future cost at the scale you’re aiming for.

Show the dataHide the data
| Monthly Google Ads spend | Fee on spend in the band |
|---|---|
| €0–10K | 0.00% |
| €10–25K | 0.65% |
| €25–100K | 0.60% |
| €100–200K | 0.50% |
| €200–500K | 0.35% |
| €500K–1M | 0.27% |
| €1–2M | 0.22% |
| €2–5M | 0.15% |
| €5–10M | 0.10% |
| €10M+ | 0.05% |
5. Recommended POAS Tracking Stacks By Business Size
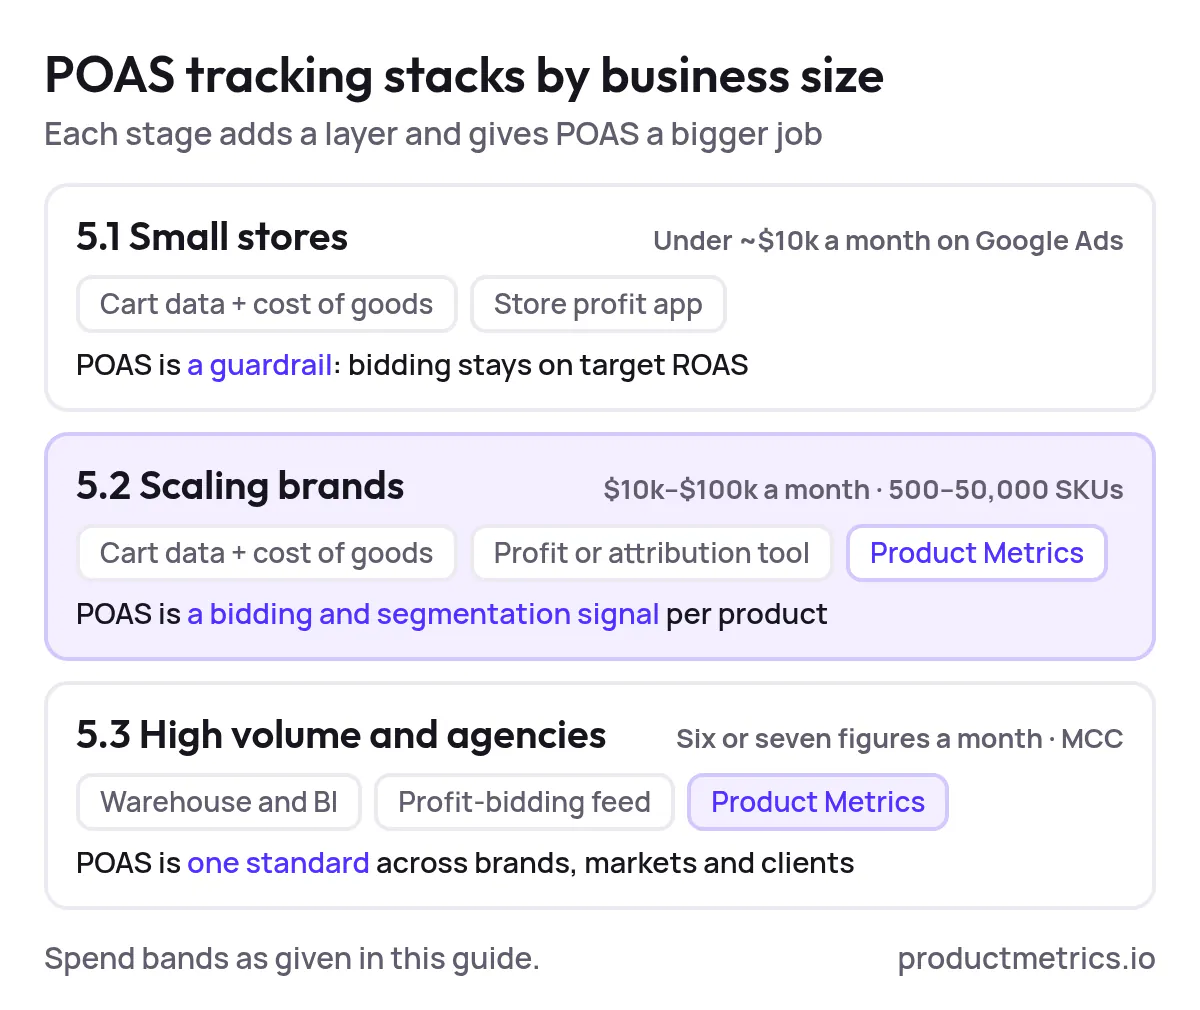
Instead of one “winner”, it’s more useful to think in terms of POAS tracking stacks that fit different stages.
5.1 Small Ecommerce Businesses And Early‑Stage Stores
Good fit for:
- Shopify, WooCommerce or Magento stores doing up to low‑seven figures a year.
- Google Ads and Shopping spend under roughly $10k/month.
- One or two people wearing both founder and media‑buyer hats.
Goals
- See whether ads are actually profitable at all.
- Keep setup light and cost‑effective.
Recommended stack – “Native + lightweight profit app”
-
Enable Conversions with cart data and COGS in Google Ads. This gives you product‑level revenue, COGS, gross profit and gross profit margin in the Products tab and Shopping reports, without extra vendors.
(Source: Google Ads Help – Metrics with conversions with cart data, Google Ads Help – About Product Reporting)
-
Add a store‑level profit analytics app (e.g., TrueProfit or a similar Shopify profit tool) to track real‑time net profit, net margin and, ideally, net‑profit‑based POAS per channel.
(Source: TrueProfit – How TrueProfit calculates your Net Profit, Omniconvert – Best POAS and profit tracking tools for Shopify)
-
Use POAS as a guardrail, not yet as a bidding signal.
- Keep using revenue‑based bidding (e.g., target ROAS) in Google Ads while checking that campaign‑or channel‑level POAS clears your break‑even threshold.
- Use a simple break‑even POAS target (e.g., 1.2 or 1.5 depending on fixed costs) and cut anything below it.
-
Define your per‑product economics. Use tools like Product Metrics’ break‑even ROAS and POAS calculators to work out per‑product targets, even if you’re not yet buying a platform. (Source: Product Metrics – POAS vs ROAS)

Show the dataHide the data
| Threshold | POAS |
|---|---|
| Break-even POAS | 1.0 |
| Guardrail, lower fixed costs | 1.2 |
| Guardrail, higher fixed costs | 1.5 |
This stack already gets you “good enough” POAS tracking for small businesses without locking you into complex platforms too early.
5.2 Scaling DTC Brands And Performance‑Driven Retailers
Good fit for:
- Brands spending roughly $10k–$100k/month across Google Ads (with a heavy Shopping/PMax share) and Meta.
- Catalogues of 500–50,000 SKUs where a few product lines drive most of the profit.
- In‑house or agency performance marketers who live in Google Ads daily.
Goals
- Move from “ROAS looks fine” to “every product we scale has a healthy POAS”.
- Turn POAS from a reporting metric into a bidding and segmentation signal.
Recommended stack – “Profit‑first Shopping stack with Product Metrics”
-
Keep or implement Conversions with cart data + COGS so Google Ads itself can report product‑level revenue, COGS and gross profit.
(Source: Google Ads Help – About conversions with cart data)
-
Use a profit analytics or attribution tool (optional but useful). If you already run Triple Whale, TrueProfit or similar for store‑level net profit and MER, keep it for channel and creative decisions. (Source: Triple Whale – Summary Metrics Table, TrueProfit – Marketing attribution overview)
-
Add Product Metrics for SKU‑level POAS and Shopping optimisation.
Product Metrics is particularly well‑suited here because it:
- Calculates POAS per product once margins are connected, and can start on ROAS while you wire margin data.
- Segments every Shopping and PMax product into six segments (Stars, Question Marks, Cash Cows, Dogs, Drainers, Ghosts) based on click volume and ROAS/POAS vs your target, then surfaces context like journeys, margin, stock and competitor prices around each product. (Source: Product Metrics – Product-Level Google Ads Optimisation, Product Metrics – Product Journeys)
- Writes those segments into custom labels in Merchant Center, so your Shopping and PMax structures can automatically bid differently for each segment.
- Sends profit, revenue, new/returning customer flags and LTV as conversion values into Google Ads and Meta, so your bidding strategies (e.g., maximise conversion value with ROAS/POAS targets) can aim directly at profit and new‑customer value. (Source: Product Metrics – Product Metrics vs ProfitMetrics)
- Uses server‑side Full Signal Tracking on your own domain to get past ad blockers and Safari ITP, improving the completeness of your POAS data compared with browser‑only tags. (Source: Product Metrics – WooCommerce integration, Product Metrics – Product Metrics vs ProfitMetrics)
-
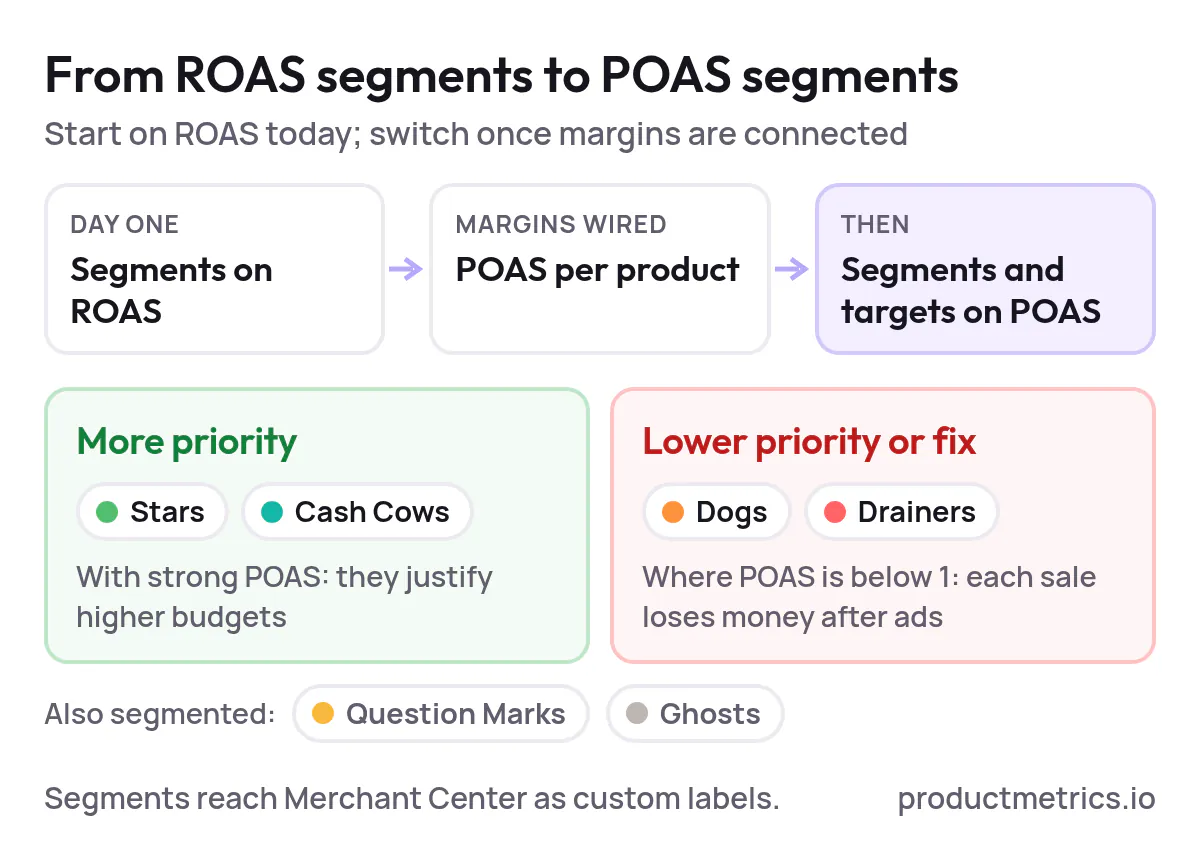
Shift from ROAS to POAS targets at the product segment level.
A practical progression is:
- Start by using Product Metrics segments (e.g., Stars, Cash Cows, Drainers) based on ROAS while margins are wired.
- Once margins are connected and POAS is available per SKU, move your campaign structures and rules from ROAS‑based segments to POAS‑based segments and adjust tROAS/Max Conversion Value targets accordingly.
- Use Stars and Cash Cows with strong POAS to justify higher budgets, and aggressively cut or fix Dogs and Drainers where POAS is below 1.
This stack gives you end‑to‑end POAS tracking in Google Ads and Google Shopping and a tight feedback loop between measurement and action, without replacing your existing analytics tools.
5.3 High‑Volume Retailers And Agencies With Multiple Clients
Good fit for:
- Retailers and marketplaces with six‑ or seven‑figure monthly ad spend across multiple countries.
- Agencies managing many Shopping/PMax accounts under an MCC.
- In‑house data teams already running a warehouse and BI stack.
Goals
- Standardise POAS tracking across brands and markets.
- Combine profit‑based bidding with deep SKU‑level control and agency governance.
Recommended stack – “Composable POAS stack”
- Standardise profit measurement in the warehouse and BI layer.
- Use your central data model to define contribution profit and POAS consistently across brands (e.g., what counts as variable cost vs overhead).
- Use a dedicated profit‑bidding tool where required.
- Tools like ProfitMetrics are strong fits when you primarily need to feed accurate profit conversion values into Google Ads and Meta without changing your broader analytics stack. (Source: ProfitMetrics – How to use POAS in Google Ads)
- Layer Product Metrics on top for Shopping and PMax‑heavy brands.
- For brands where Google Ads and Performance Max are key growth levers, Product Metrics can sit on top of your existing feeds and analytics to handle SKU‑level segmentation, labels and profit‑aware product decisions, while your BI stack handles cross‑channel MMM or incrementality. (Source: Product Metrics – The Definitive Buyer’s Guide to Google Ads Segmentation)
- For agencies, centralise client management.
- Use MCC‑level access and per‑client workspaces to manage multiple shops while keeping label strategies, POAS targets and reporting consistent but separated.
This stack recognises that at high spend, no single tool does everything: you combine a warehouse, profit‑bidding conversion feeds, and SKU‑level Shopping optimisation.
6. How to Choose a POAS Tracking Tool for Your Business A 5‑Step Checklist
If you’re asking “How do I choose a POAS tracking tool for my business?”, use this process to cut through vendor noise and shorten your shortlist.
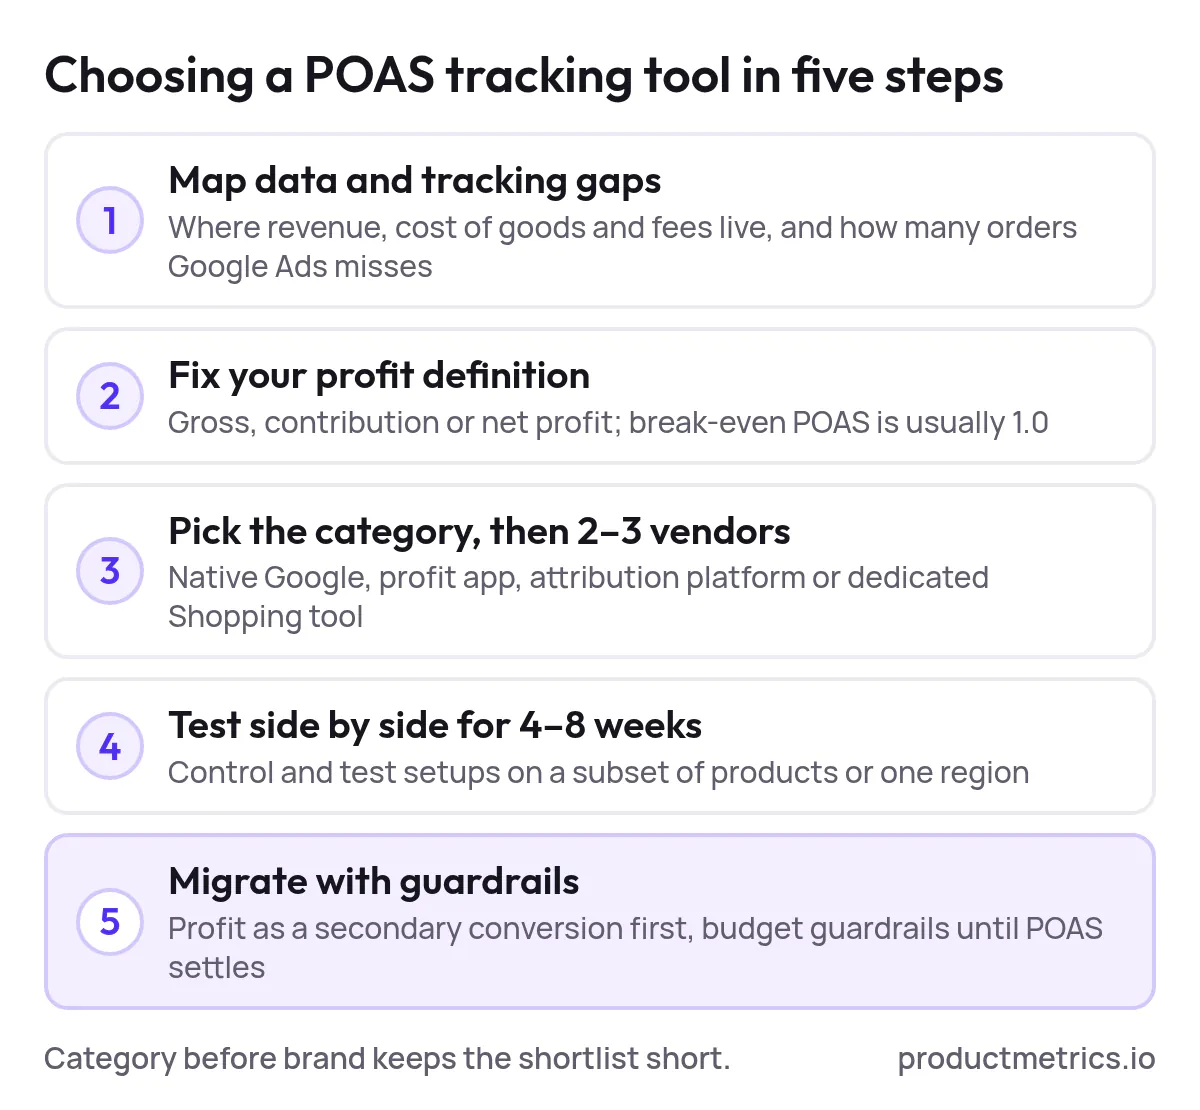
Step 1 – Map your current data and tracking gaps
- Where do revenue, COGS, shipping and fees live today (Shopify, ERP, spreadsheets)?
- How does ad spend enter your reporting (API imports, CSV, manual)?
- How complete is your current conversion tracking—what percentage of orders are missing from Google Ads because of ad blockers or Safari?
Step 2 – Decide your profit and POAS definitions
- Align with finance on whether you want POAS based on gross profit, contribution profit, or net profit after ads.
- Use that to set a break‑even POAS target (usually 1.0) and stretch targets by product category or margin band. (Source: Product Metrics – POAS vs ROAS)
Step 3 – Pick the category of tool first not the brand
From Sections 3–5, choose which type fits your situation:
- Native Google only.
- Store‑level profit analytics.
- Cross‑channel analytics and attribution.
- Dedicated Shopping & POAS optimisation (Product Metrics / ProfitMetrics / Adchieve).
Then shortlist 2–3 vendors within that category instead of comparing everything to everything.
Step 4 – Run a contained side‑by‑side test
For Google Ads and PMax, a practical approach is:
- Pick a subset of products or a region where you can run a clean experiment for 4–8 weeks.
- Keep a control setup (your current tracking and bidding) and a test setup (with the new POAS tool) running in parallel where possible.
- Compare on:
- Verified POAS at the campaign and product level.
- Stability of conversions reported to Google Ads.
- Ease of daily workflow (how much time your team saves or spends).
Step 5 – Plan the migration and guardrails
Once you pick a tool:
- Phase in profit‑based conversions carefully; following ProfitMetrics’ guidance, many advertisers first run profit tracking as a secondary conversion to compare before switching it to primary. (Source: ProfitMetrics – How to use POAS in Google Ads)
- For Product Metrics, start by letting it segment on ROAS, then switch segments to POAS once margins are wired, and only then adjust tROAS or Max Conversion Value targets.
- Set budget guardrails during the transition so the algorithm cannot overspend before POAS stabilises.
7. Where Product Metrics Fits in Your POAS Stack
If Google Ads and Performance Max are central to your acquisition strategy, and you:
- Manage hundreds to tens of thousands of SKUs.
- Need to know which specific products deserve more or less budget.
- Want Google Ads and Meta to optimise on profit and new‑customer value, not just revenue.
…then a general analytics tool alone is not enough. You need a product‑level decision layer that speaks POAS fluently and can act on it.
Product Metrics is built exactly for that job:
- Works with Shopify, WooCommerce, Magento, Lightspeed and Shopware 6.
- Segments every Shopping and PMax product by ROAS or POAS vs your targets.
- Adds journeys, margin, competitor price and stock beside each SKU.
- Writes only the labels you approve into Merchant Center.
- Sends profit, revenue, new/returning flags and LTV to Google Ads and Meta.
- Includes server‑side, ad‑blocker‑resistant tracking via Full Signal Tracking.
(Source: Product Metrics – Homepage, Product Metrics – WooCommerce integration, Product Metrics – Product Metrics vs ProfitMetrics)
You can analyse your products for free and see product‑level POAS and segments before committing to a paid plan; after that, pricing scales with your Google Ads spend and starts with a free allowance up to €10k of monthly Shopping spend. (Source: Product Metrics – Product Metrics vs ProfitMetrics)
If you’re evaluating multiple POAS tracking tools for ecommerce and Google Ads, use this guide as your scorecard—and when product‑level Shopping performance and POAS are the main levers you care about, put Product Metrics on your shortlist and run it in a side‑by‑side test against your current stack.
Written by
Berend Vrakking, Founder of Product Metrics
1M+ products analysed · Nominated at the Dutch Search Awards for Best Measurement Campaign (2023) and Best Use of Data (2024)
Keep reading.
Operationalizing POAS: Best Practices, Governance, and Analysis
Operationalizing POAS for Google Ads: one profit definition, profit sent to Google Ads and Meta server-side, products segmented on it and a weekly review.
POAS In The Real World Passing Profit, Composing Conversion Value, And Bidding With Confidence
POAS in the real world passing profit to Google Ads: what to send as conversion value, which costs to include, how to keep margins private and test it.
Ecommerce performance analytics: from metrics to SKU actions
Ecommerce performance analytics measures what each product earns after costs and ads: the metrics, formulas, attribution models and SKU rules to act on.
See which of your products to push, fix or pause. Start with your own products, or a 30-second estimate.
See what a blocker stops with the ad blocker tracking test. Then see how your products perform once every conversion is counted.
Questions, or want to spar about your products? Book a demo: a video call with Berend, then a demo account.