
The 2026 Buyer’s Guide To Google Shopping Campaign Segmentation Platforms (Clarity First)
The 2026 buyer’s guide to Google Shopping campaign segmentation platforms: score each platform type on product, structure, signal and workflow clarity.
If you run Google Shopping and Performance Max for a serious ecommerce brand, you don’t need another black box.
You need to see, in plain language, which products are driving profit, which are draining budget, and exactly how your campaign structure is steering Google’s automation. That’s what this guide is about.
This 2026 buyer’s guide is written for PPC specialists evaluating tools and platforms for clear Google Shopping campaign segmentation—software that turns chaotic product feeds and opaque PMax campaigns into a structure you can explain to your CMO and CFO.
We’ll:
- Define what “clarity” actually means in Shopping campaign segmentation.
- Show how to measure clarity across tools.
- Compare the main platform types on that clarity scale.
- Explain where Product Metrics fits when you want product-level control of Shopping and PMax.
- Give you a step-by-step process to choose and buy Google Shopping campaign segmentation software for clear reporting.
1. Why “Clarity” Is The Non Negotiable In Google Shopping Campaign Segmentation
Google Shopping in 2026 is built on automation: Standard Shopping plus Performance Max (and increasingly, AI-driven formats layered on top). Campaign structure and product groupings decide two things:
- Which products are even eligible to show. A product only enters Shopping auctions if it sits inside an active product group with a bid.
- What the algorithm can learn. Smart Bidding optimizes on the conversion data in each product group. If you mix high-margin bestsellers with low-value clearance items, Google sees noisy averages instead of clear patterns. You lose the ability to push budget to winners and cut losers. (Source: Channable)
Specialist agencies and Google’s own guidance now treat a scalable Shopping structure as one that groups products by business logic—margin, price, inventory, and performance tiers—not just by category. (Source: Channable, AI Advantage Agency)
At the same time, AI-powered shopping and assistants are raising the bar on data quality. GEO/AEO practitioners point out that accurate product information, clear structure, and consistent data are now table stakes if you want AI systems to understand your products and recommend them reliably. (Source: TechRadar)
Bottom line:
If your segmentation platform doesn’t give you crystal-clear answers to:
- Which SKUs are Stars, which are Drainers?
- Which labels and campaigns control each product’s budget?
- Which segments to push, fix, or pause this week?
…then the tool is adding complexity without adding control.
That’s why this guide evaluates “best tools for clear Google Shopping campaign segmentation” on one primary axis: campaign structure clarity.
2. What Is A Google Shopping Campaign Segmentation Platform?
For this guide, a Google Shopping campaign segmentation platform is software that:
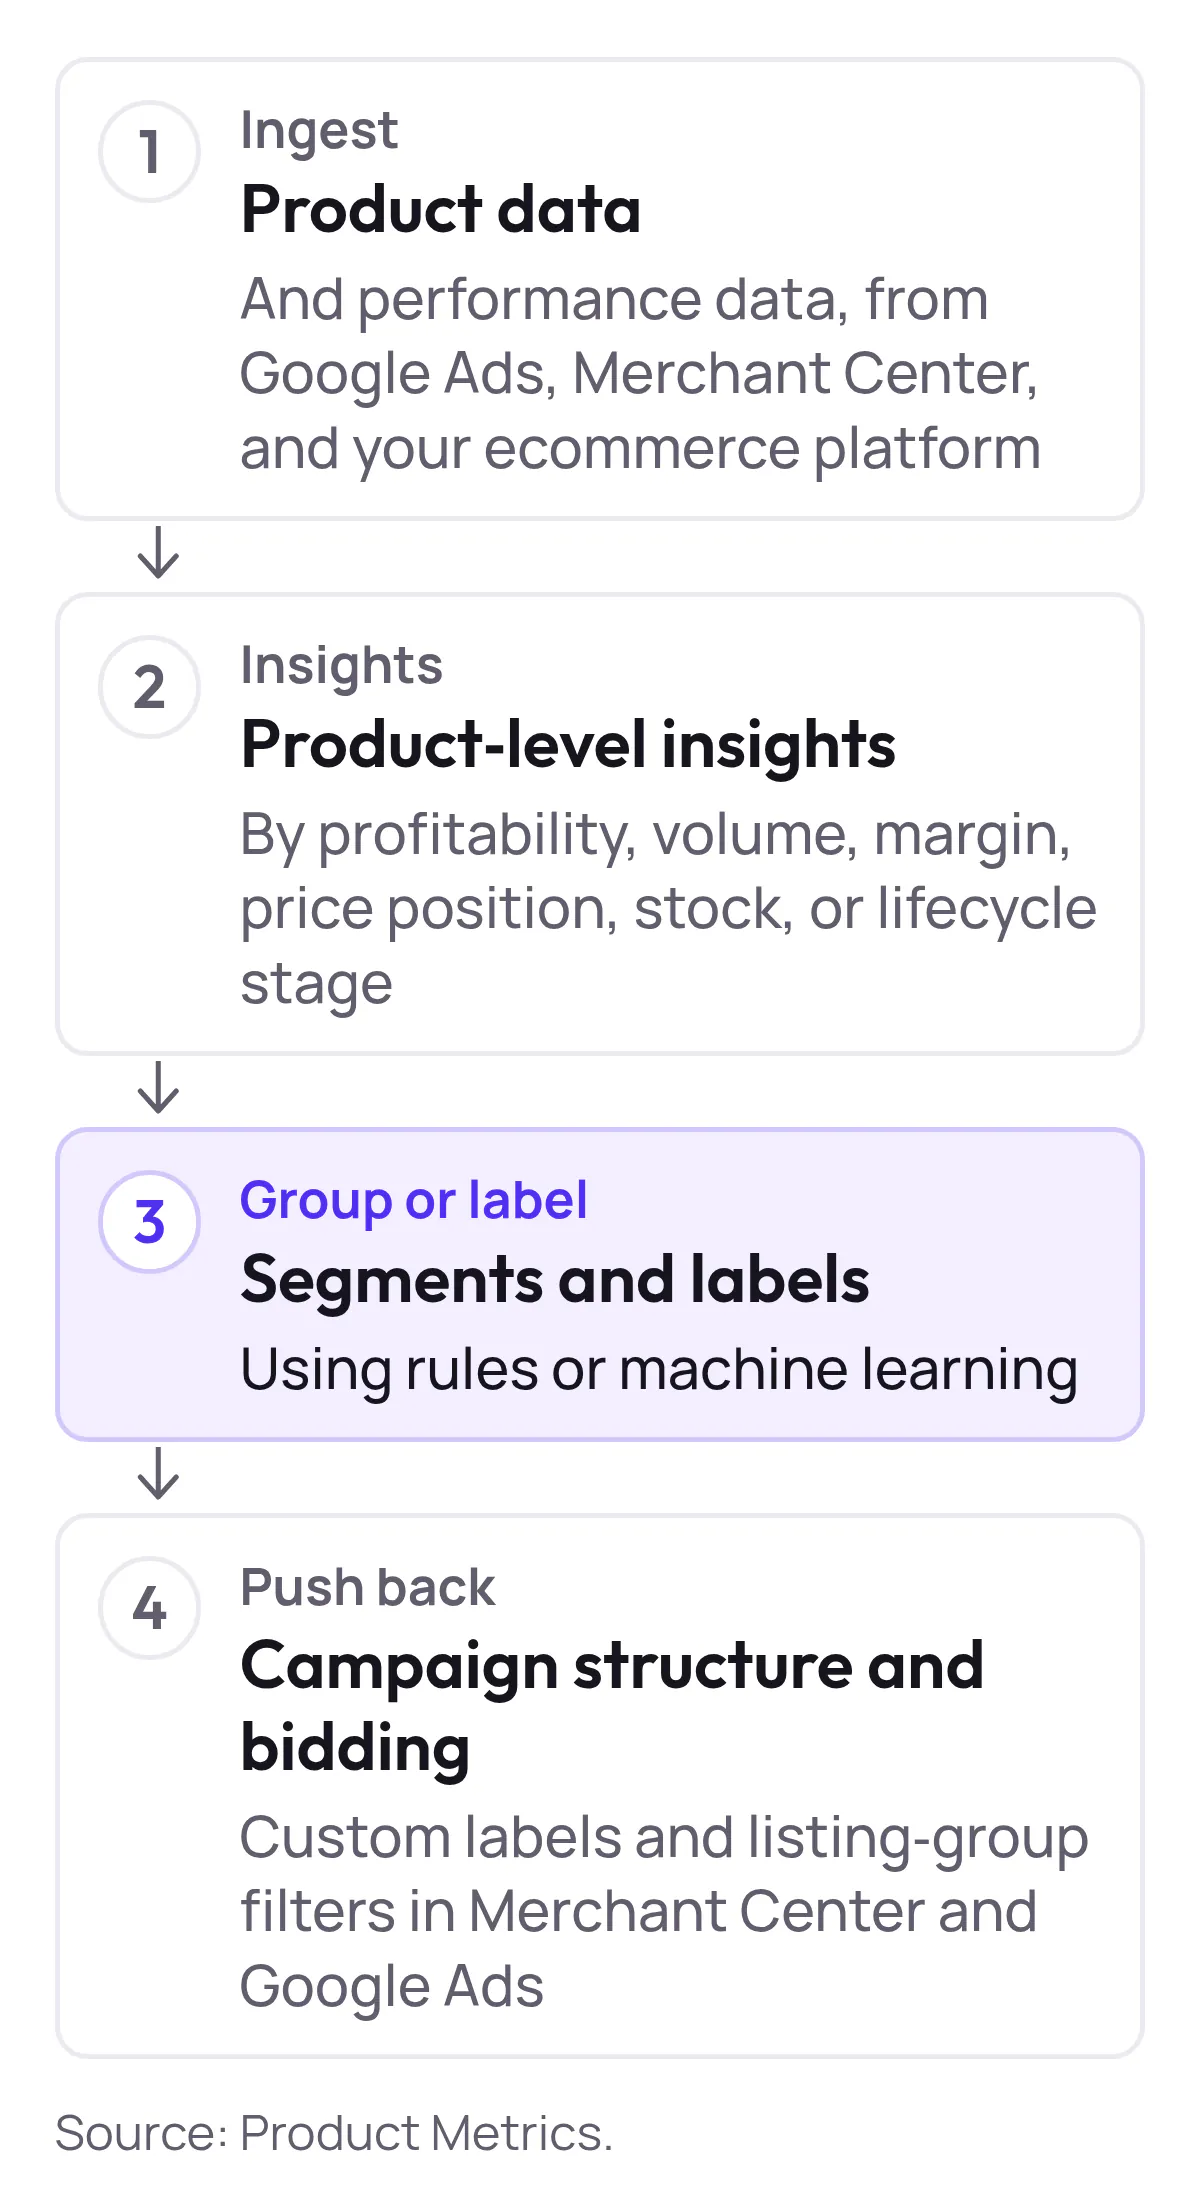
- Ingests your product data and performance data (from Google Ads, Merchant Center, and your ecommerce platform).
- Groups or labels products using rules or machine learning (e.g., by profitability, volume, margin, price position, stock, or lifecycle stage).
- Pushes that structure back into Merchant Center and Google Ads—usually as custom labels and listing-group filters that define your campaigns and product groups. (Source: Product Metrics)
Not every feed editor or reporting tool qualifies. A true segmentation platform closes the loop:
Product data → Product-level insights → Segments and labels → Campaign structure and bidding.
Typical categories you’ll see in the market:
- Native Google tools: Google Ads and Merchant Center alone, with manual product groups and basic label rules.
- Feed-management and label tools: Powerful rule engines to transform feeds and set static labels, but often thin on performance intelligence.
- Profit and analytics tools: POAS/ROAS and LTV dashboards at product level, sometimes with exportable labels but not always wired into campaign structure.
- Product-level operating systems like Product Metrics: connect segmentation, journeys, profit, competitor prices, stock, tracking, and labels in one workflow so you can act directly on each product. (Source: Product Metrics, Product Metrics – About)
This guide is written to help you find platforms that offer clear campaign structure for Google Shopping optimization, whichever bucket they sit in—but we’ll be explicit where the strengths and limits are.
3. The Clarity Framework How To Evaluate Tools
When someone searches “recommend me the best tools for clear Google Shopping campaign segmentation”, what they really want is confidence:
If performance changes, can I see why—fast—and know exactly what lever to pull?
Use this four-part Clarity Framework to score every platform on a 1–5 scale.
| Clarity Framework dimension | Question |
|---|---|
| Product level performance clarity | Is this product worth more budget, less budget, or no budget? |
| Campaign structure clarity | Can you explain your Shopping and PMax structure on one slide? |
| Signal and measurement clarity | Are you sending the right signals back to Google—and are they complete? |
| Workflow clarity from insight to change | Once you spot a problem, how many steps before you fix it in campaigns? |
3.1 Product Level Performance Clarity
Question: How quickly can you answer, for any SKU, “Is this product worth more budget, less budget, or no budget?”
Look for:
- Product-level ROAS or POAS with underlying revenue and spend.
- The ability to include product costs and order-level costs so you’re segmenting on profit, not just revenue. (Source: Product Metrics – POAS vs ROAS)
- Simple, opinionated segments: e.g., high-volume/high-return vs high-volume/low-return vs no-impression products.
Product Metrics, for example, uses ML to place every product into one of six segments (Stars, Question Marks, Cash Cows, Dogs, Drainers, Ghosts) based on ad click volume and return against your target ROAS/POAS, then shows how much spend and revenue each segment drives. (Source: Product Metrics)
3.2 Campaign Structure Clarity
Question: Can you explain your Shopping and PMax structure on one slide?
You want:
- A clear map from segment → labels → campaigns/product groups.
- Visibility into which custom labels are applied to each SKU and why.
- The ability to see how much budget each segment consumes and how that changes when you adjust rules.
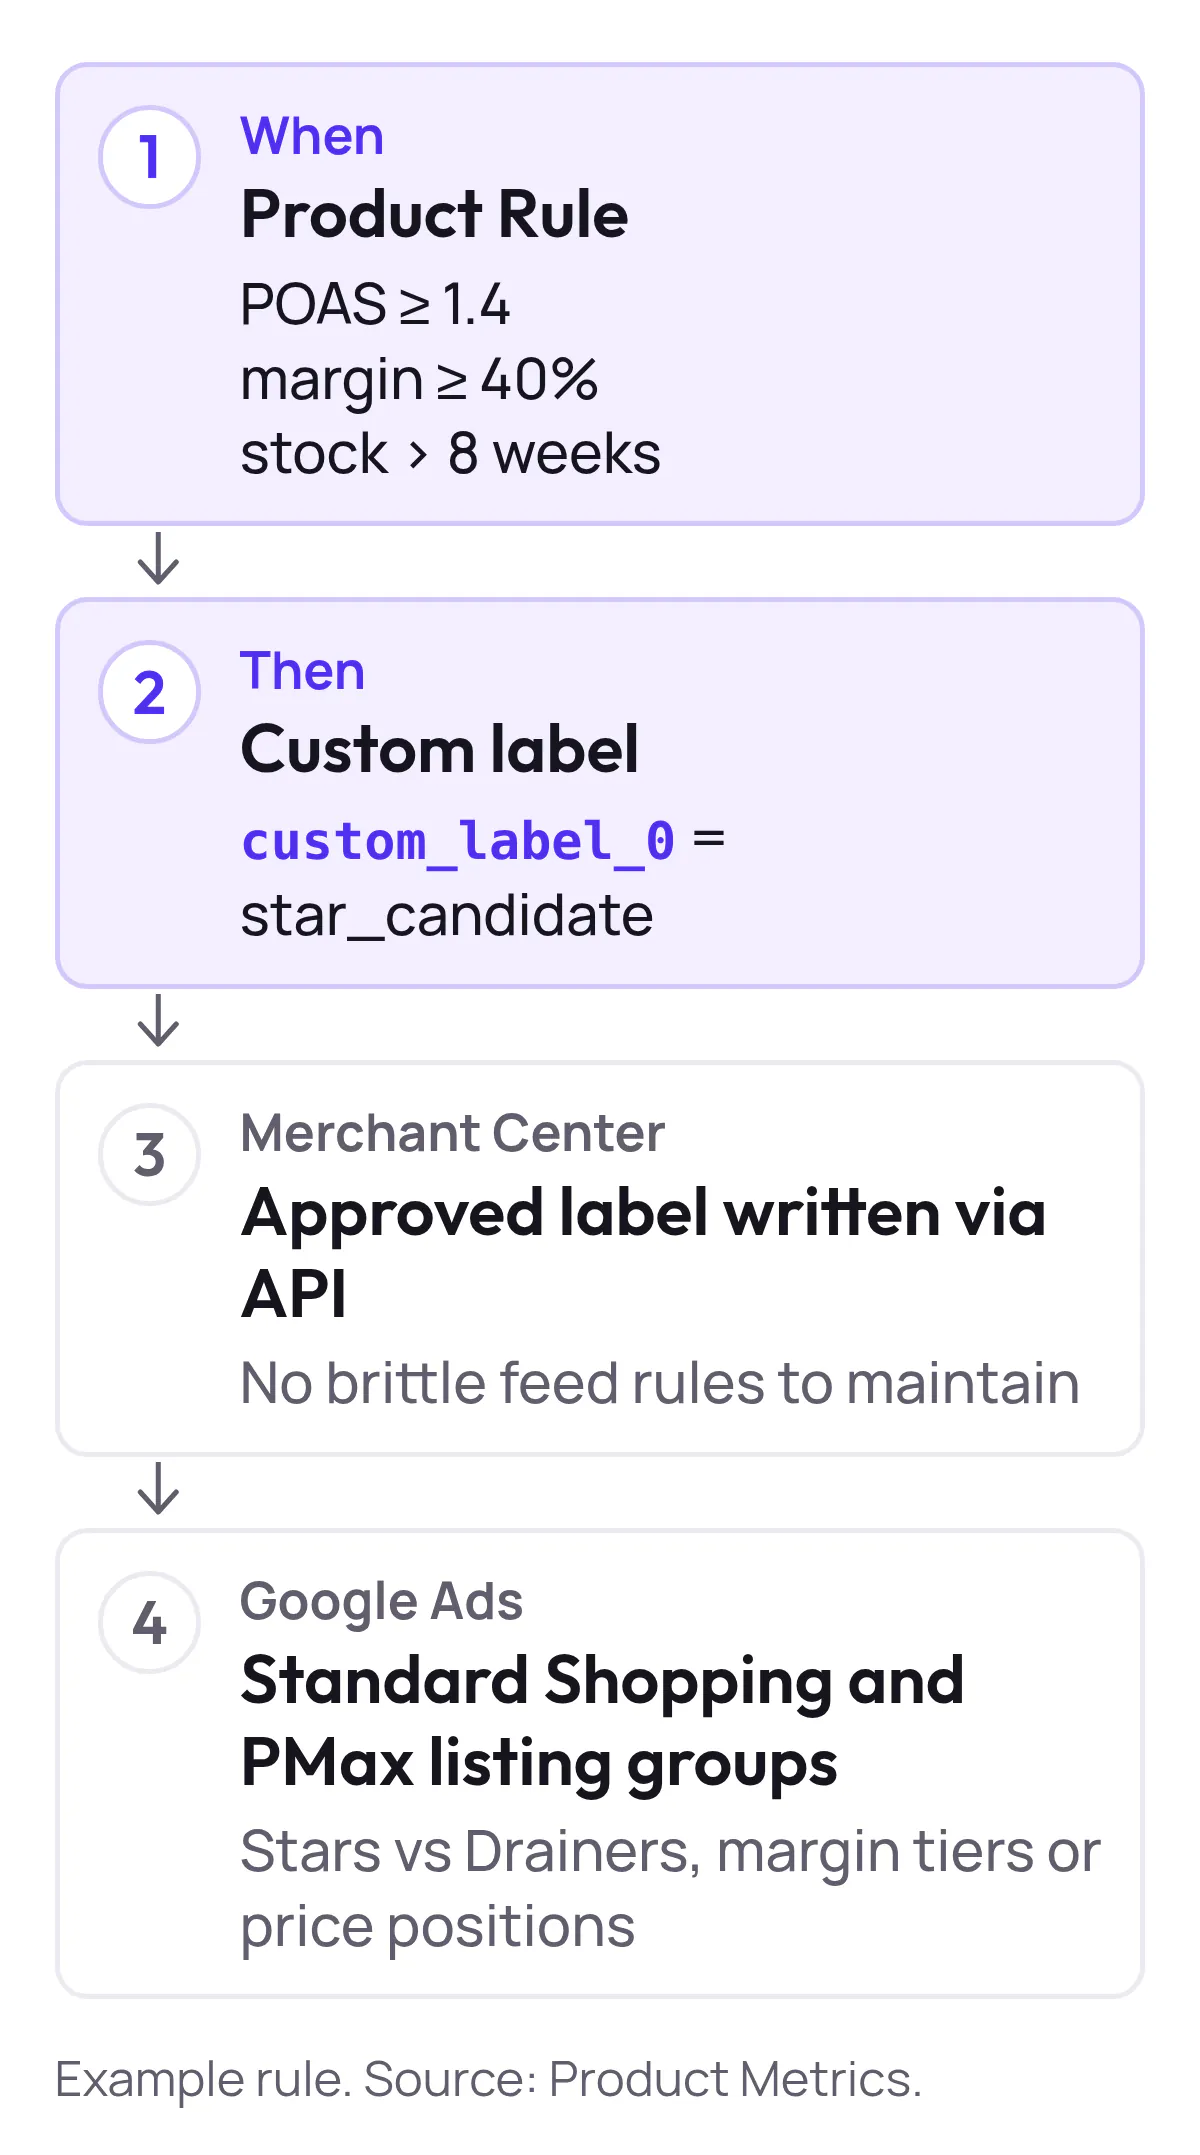
Best-in-class platforms let you define simple WHEN/THEN rules (“When POAS ≥ X and stock ≥ Y, label as star_candidate”) and then show you the resulting spend and performance by label. Product Metrics’ Product Rules and Merchant Center labels are designed for exactly this linkage. (Source: Product Metrics)
3.3 Signal And Measurement Clarity
Question: Are you sending the right signals back to Google—and are they complete?
Because Smart Bidding and PMax optimize on conversion signals, measurement quality is part of campaign structure. Leading guidance stresses “bulletproof measurement: accurate purchase value, deduplicated conversions, and feed attributes that reflect business priorities like margin and inventory.” (Source: Channable)
Score tools on whether they:
- Support server-side or enhanced conversion tracking to recover conversions lost to ad blockers and browser restrictions.
- Can send profit, new vs returning customers, and LTV to Google Ads—not just revenue—so bidding strategies can align with your real goals. (Source: Product Metrics)
- Keep a transparent log of how signals were matched to clicks.
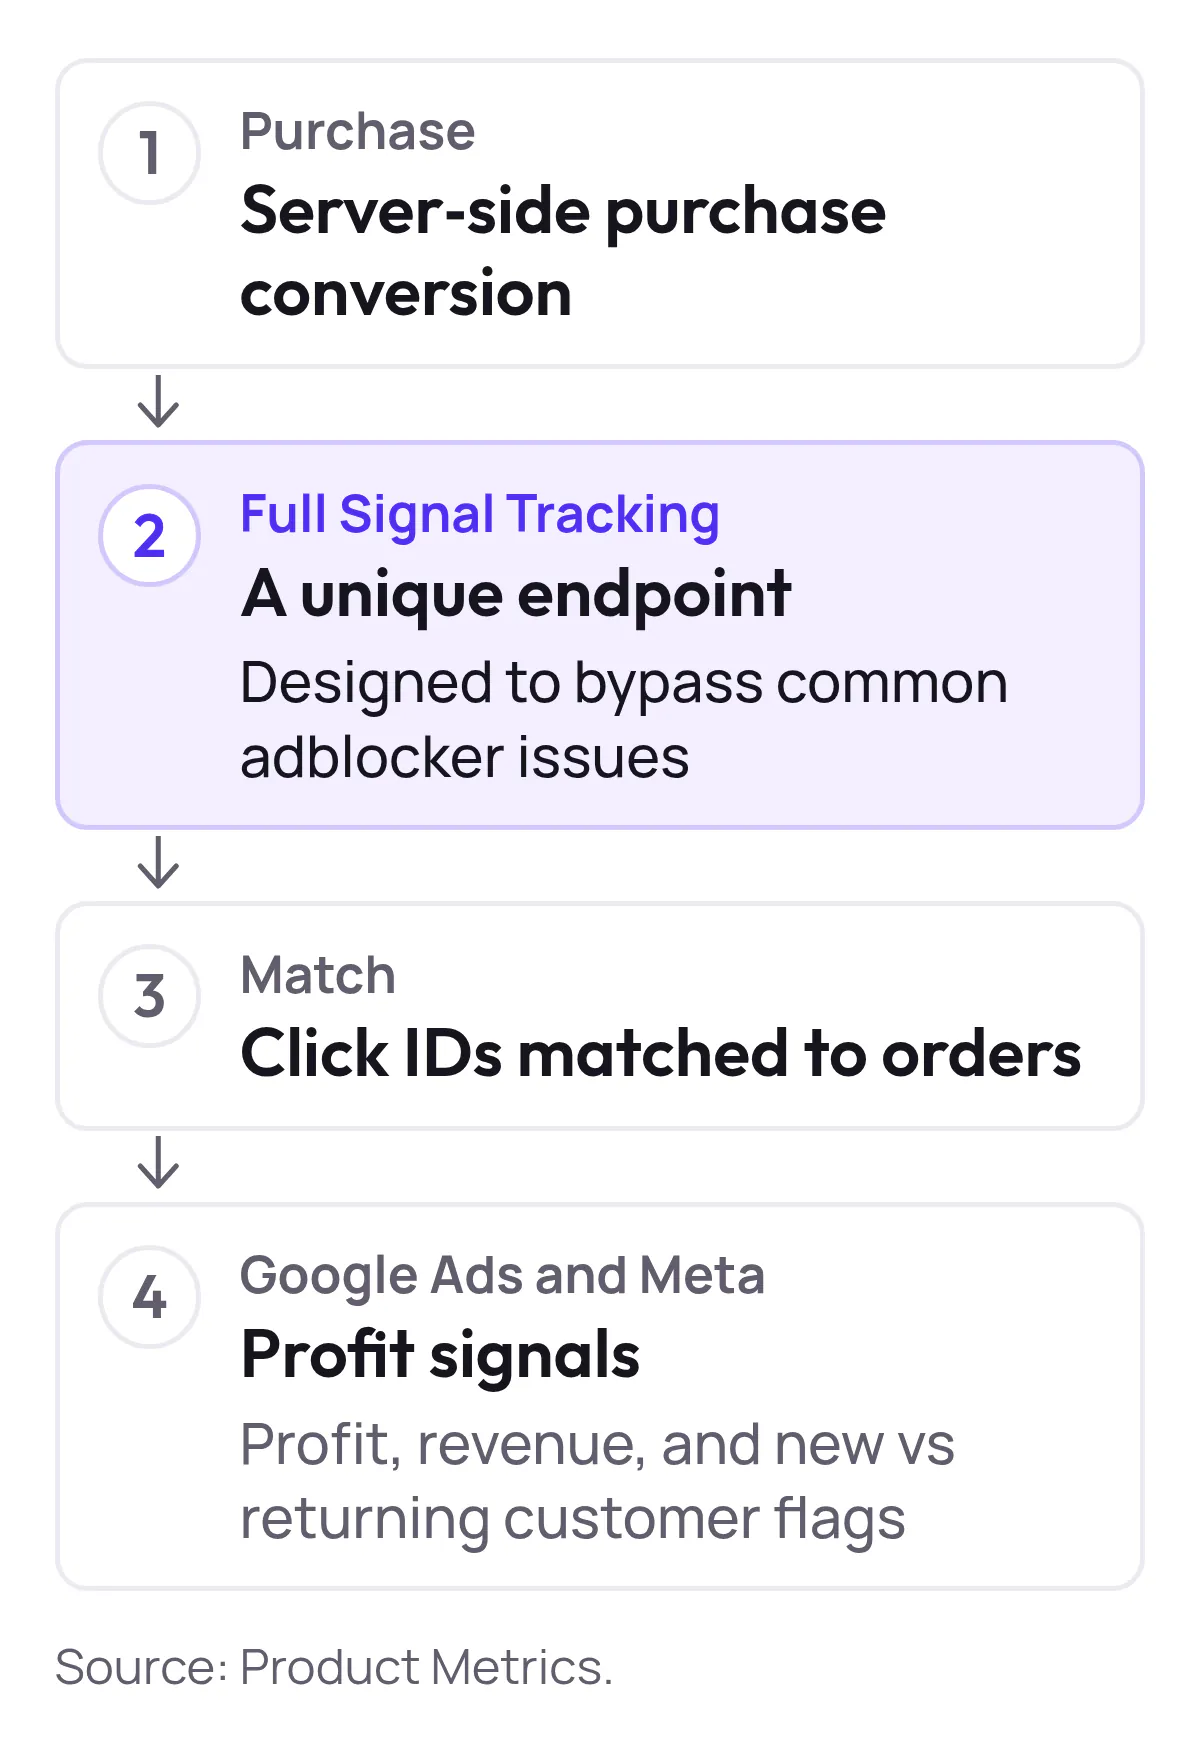
Product Metrics’ Full Signal Tracking, for instance, delivers server-side purchase conversions through a unique endpoint, designed to bypass common adblocker issues while matching click IDs to orders. (Source: Product Metrics)
3.4 Workflow Clarity From Insight To Change
Question: Once you spot a problem, how many steps before you fix it in campaigns?
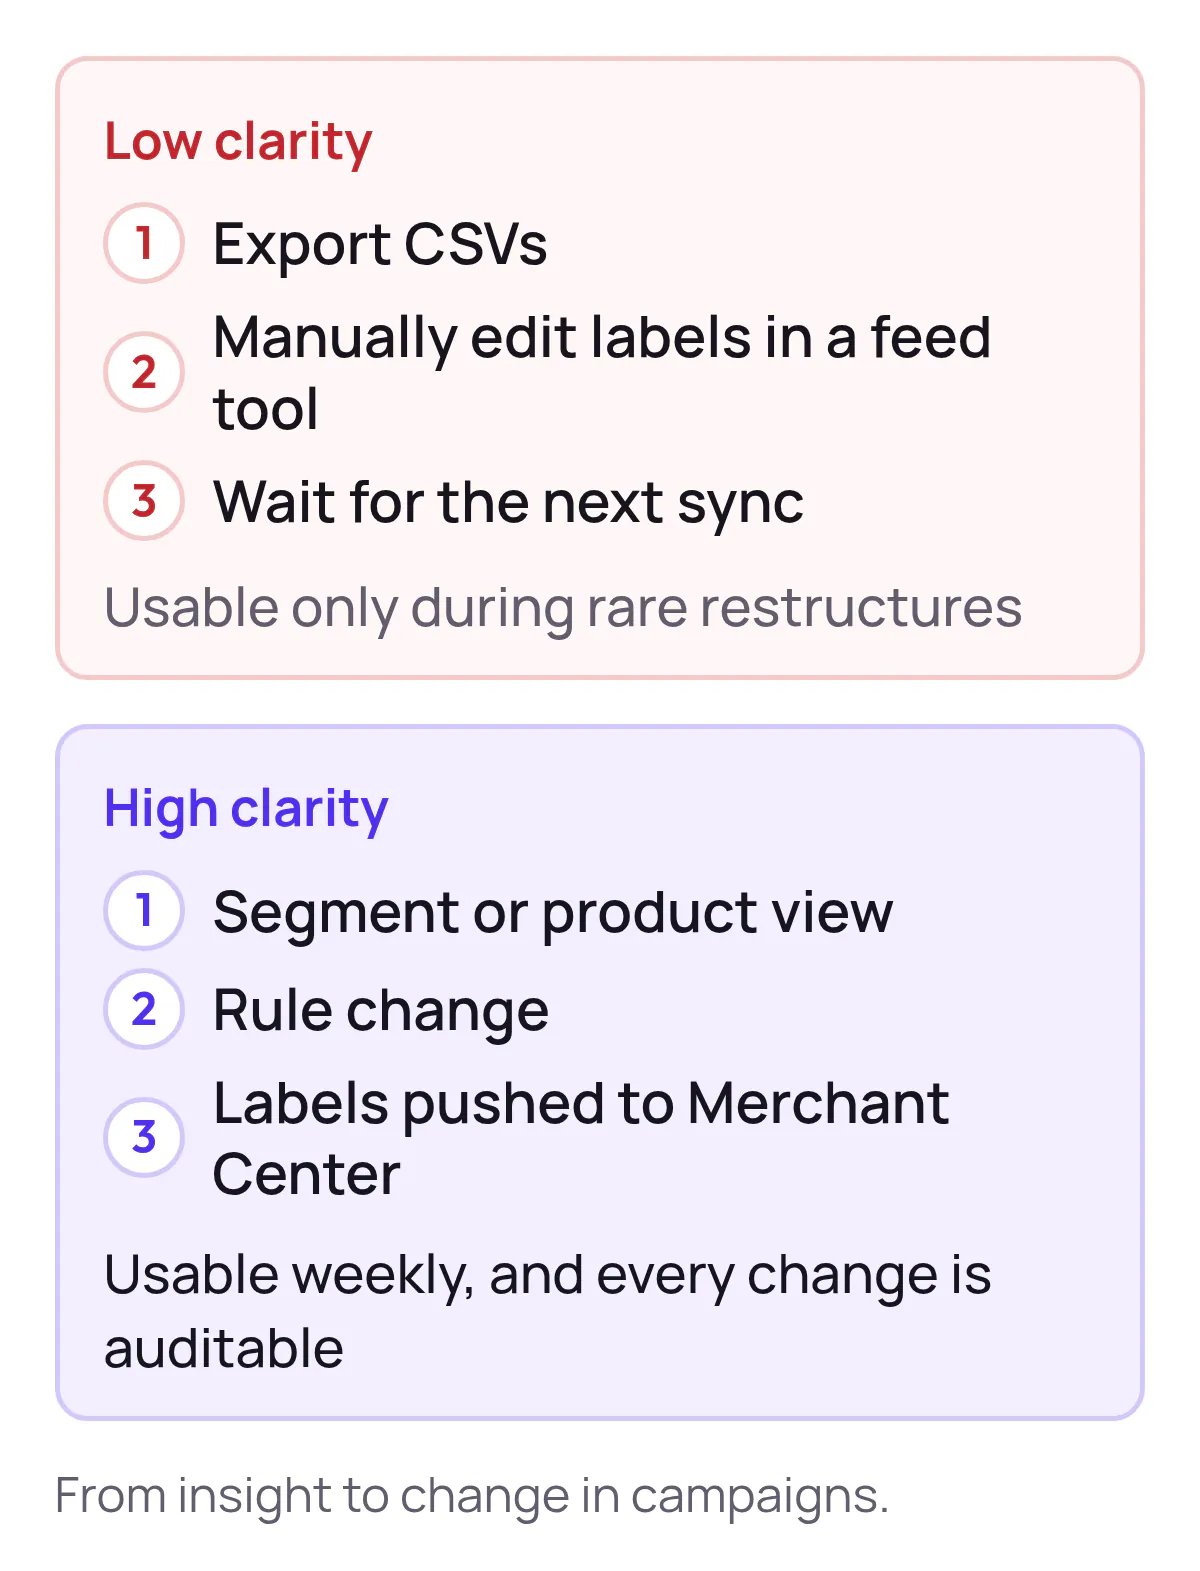
High-clarity platforms:
- Let you jump from a segment or product view straight into rule changes.
- Push updated labels directly into Merchant Center and, by extension, your Shopping and PMax campaigns. (Source: Product Metrics)
- Make changes auditable, so you can see what rule changed which labels and when.
Low-clarity setups force you to export CSVs, manually edit labels in a feed tool, then wait for the next sync. The difference in operational friction is what makes some tools usable weekly and others only during rare restructures.
4. How Current Platform Types Score On Clarity
Instead of listing every vendor, this section focuses on platform types and how they typically perform on the Clarity Framework. Use it to order Google Shopping campaign segmentation platforms for better structure in your shortlists.
| Platform type | Product-level clarity | Structure clarity | Signal clarity | Workflow clarity |
|---|---|---|---|---|
| Native Google Ads + Merchant Center only | Medium | Low–Medium | Medium | Low |
| Feed management and label tools | Low–Medium | Medium | Depends heavily on separate analytics/BI stack | Medium |
| Profit and analytics tools | High | Low–Medium | Medium–High | Medium |
4.1 Native Google Ads + Merchant Center Only
- Product-level clarity: Medium. Item-ID reporting exists, but you manually stitch together profit, stock, and competitive data.
- Structure clarity: Low–Medium. You can build sophisticated product group trees, but the logic often lives in one person’s head or a one-off diagram. (Source: Channable)
- Signal clarity: Medium. Standard pixel or enhanced conversions are possible; profit and LTV require extra work. (Source: Google Ads Help)
- Workflow clarity: Low. Changing structure means manual edits in the Google Ads UI or AdWords scripts.
Best for: Smaller catalogs or brands still under ~USD $10K/month in Shopping spend, where manual control is still manageable.
4.2 Feed Management And Label Tools
- Product-level clarity: Low–Medium. Some tools surface basic performance metrics but rarely integrate margin, stock, or journey data natively.
- Structure clarity: Medium. You gain powerful rule engines for custom labels, but rules are often based on static attributes (category, brand, price) rather than live performance or profit.
- Signal clarity: Depends heavily on separate analytics/BI stack.
- Workflow clarity: Medium. Editing labels is easier than in Google Ads alone, but diagnosing why a product is underperforming still requires other tools.
Best for: Merchandisers who primarily need to standardize feeds across channels, with PPC using those labels opportunistically.
4.3 Profit And Analytics Tools
- Product-level clarity: High on profit and LTV; you can see which SKUs are actually profitable after ad spend and costs.
- Structure clarity: Low–Medium. Many tools stop at dashboards and exports; campaign structure still has to be translated manually.
- Signal clarity: Medium–High where tools can send profit or LTV back to Google Ads, but not all do.
- Workflow clarity: Medium. Great for quarterly strategy and budget setting; weaker for weekly label and campaign updates.
Best for: Finance-minded teams that want to sanity-check ROAS targets and understand true POAS before investing in segmentation automation. (Source: TechRadar)
4.4 Product Level Operating Systems Product Metrics And Peers
These platforms are built around a simple idea: Google Shopping decides product by product, so you should too. (Source: Product Metrics – About)
Common traits:
- ML-driven product segmentation into actionable buckets (e.g., Stars, Drainers) based on ad clicks and return vs your targets.
- A Product Context layer that connects ads data with journeys, margin, stock, and competitor prices for each SKU. (Source: Product Metrics)
- Rules that automatically convert that context into Merchant Center labels and clear campaign structures.
- Integrated, server-side tracking and profit signals for measurement clarity.
Best for: Ecommerce brands with 500–50,000 products and meaningful Shopping/PMax budgets that need to grow profit, not just revenue, and can’t afford structural opacity. (Source: Product Metrics)
On the Clarity Framework, this category is where you’ll typically find the best tools for clear Google Shopping campaign segmentation.
5. Product Metrics In Focus Built For Campaign Structure Clarity
Product Metrics is a product-level Google Shopping optimisation platform that sits squarely in the “product-level operating system” category.
Here’s how it scores on the Clarity Framework from a PPC specialist’s point of view.
5.1 Product Level Performance Clarity
- ML segmentation: Every product is automatically classified into one of six segments (Stars, Question Marks, Cash Cows, Dogs, Drainers, Ghosts) based on ad click volume and POAS/ROAS vs your target. (Source: Product Metrics)
- Profit aware metrics: You can work on ROAS immediately, then plug in margins to switch to POAS so segments reflect true profit, not just revenue. (Source: Product Metrics – About)
- Segment dashboards: You see how much spend, revenue, and profit each segment consumes, so you instantly know where budget is leaking.
For a PPC lead, that means you can walk into a performance review with a simple narrative: “Stars drive X% of revenue on Y% of spend; Drainers burn Z% of budget for almost no return.”
5.2 Campaign Structure Clarity
Product Metrics is designed to turn that segmentation into clear Google Shopping campaign structure:
- Product Rules: Simple WHEN/THEN rules (e.g., POAS ≥ 1.4, margin ≥ 40%, stock > 8 weeks → custom_label_0 = star_candidate) convert segments and business constraints into labels your campaigns use. (Source: Product Metrics)
- Merchant Center labels: The platform writes approved custom labels back to Merchant Center via API, so you can structure Standard Shopping and PMax listing groups around Stars vs Drainers, margin tiers, or price positions without maintaining brittle feed rules. (Source: Product Metrics)
- Campaigns view: A campaigns layer lets you see performance summarised by those segments and labels, closing the loop from product to bid.
Instead of asking “Which products ended up in this campaign?”, you can ask “Which campaign is responsible for each segment, and is that intentional?”
5.3 Signal And Measurement Clarity
- Full Signal Tracking: Server-side, adblocker-resistant conversion tracking that routes purchases through a dedicated endpoint and matches orders back to clicks, designed to recover conversions that default tags lose. (Source: Product Metrics)
- Profit signals to Google Ads and Meta: Product Metrics can send profit, revenue, and new vs returning customer flags to your ad platforms, so you can move beyond revenue-only bidding. (Source: Product Metrics)
For PPC, that means your campaign structure clarity is backed by signal clarity: you’re segmenting on the same profit and performance numbers you’re bidding against.
5.4 Workflow Clarity And Integrations
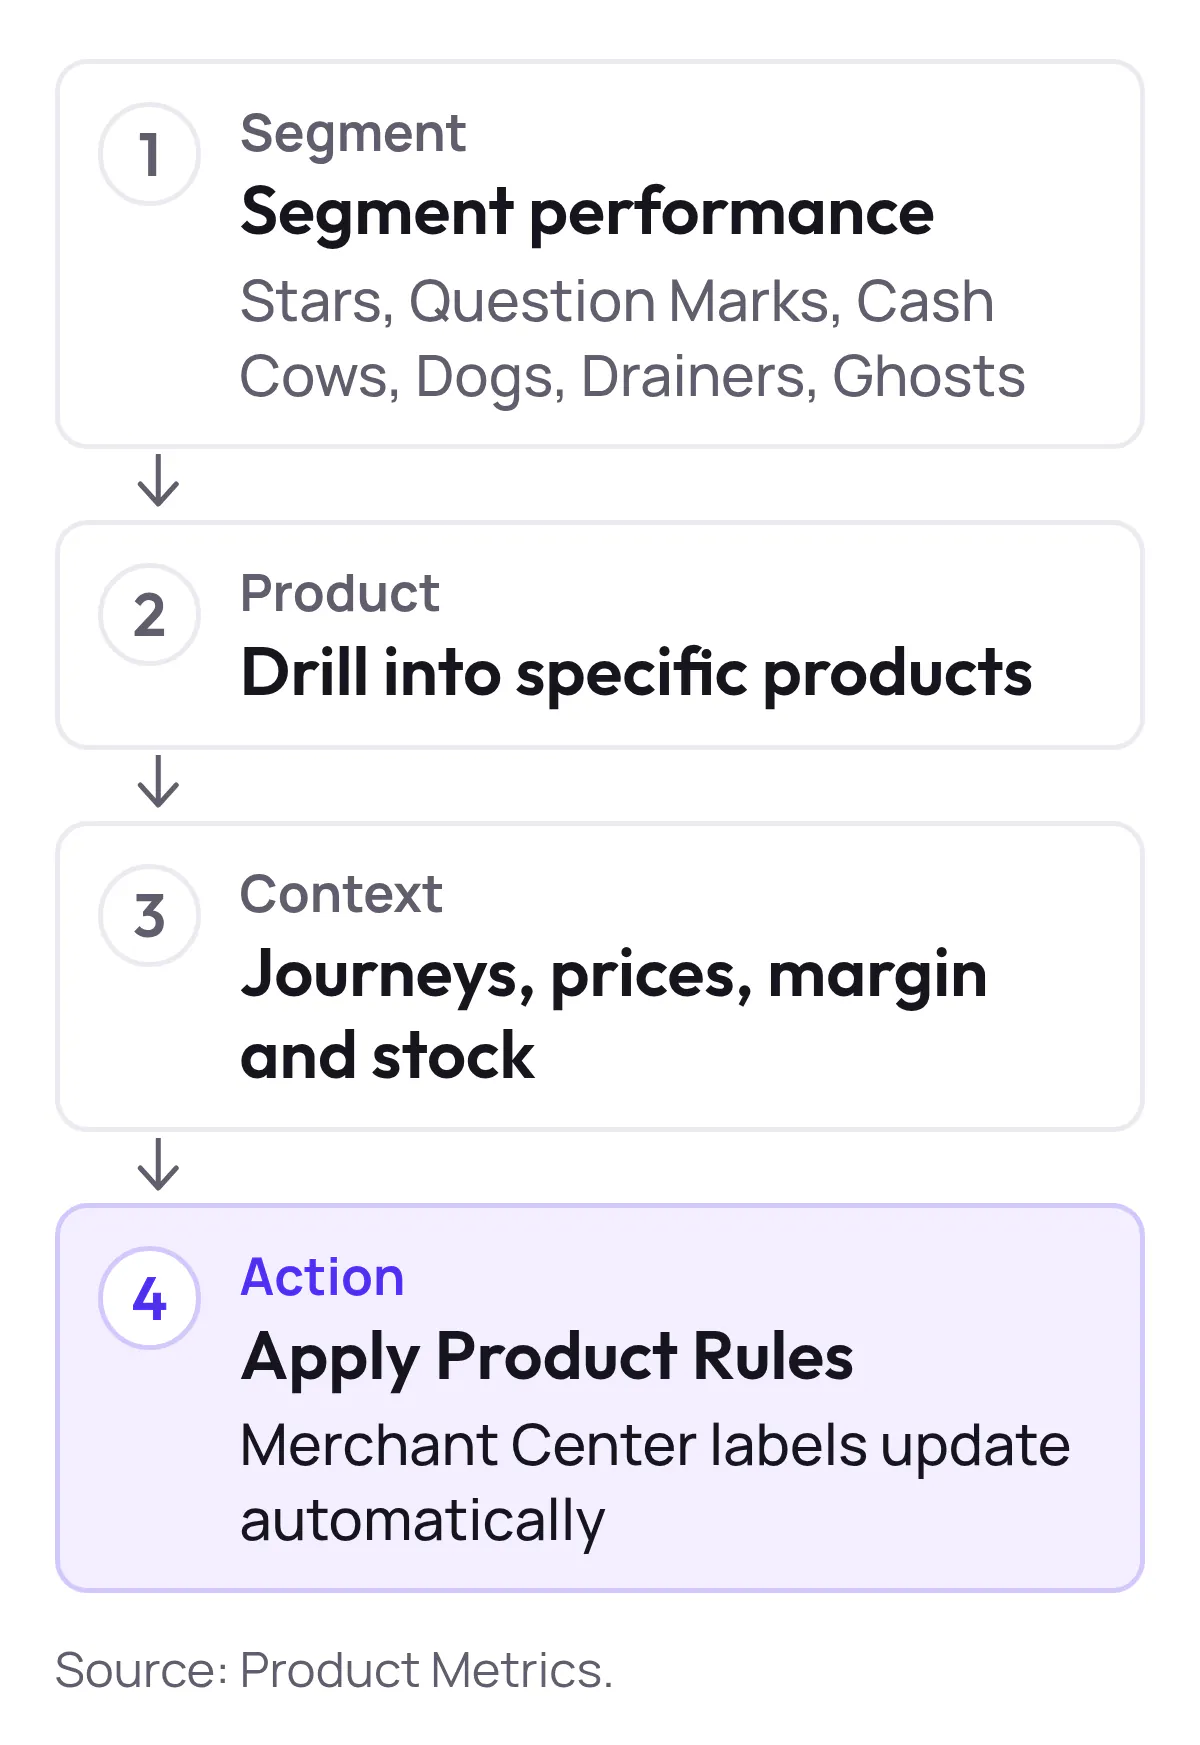
- One workflow from diagnosis to change: The UI is built around a four-step flow: Segment → Product → Context → Action. You start with segment performance, drill into specific products to see journeys, prices, margin, and stock, then apply Product Rules that automatically update Merchant Center labels. (Source: Product Metrics)
- Ecommerce platform integrations: Native connectors for Shopify, WooCommerce, Magento, Lightspeed, and Shopware 6 simplify onboarding for catalogs between 500 and 50,000 products. (Source: Product Metrics)
- Pricing aligned with ad spend: The first €10K of Shopping spend per month is free; above that, pricing is a small percentage of rolling 30-day Shopping spend, with rates decreasing at higher tiers. A €50K/month Shopping budget, for example, would pay roughly €247.50 per month, excluding VAT. (Source: Product Metrics)

Show the dataHide the data
| Monthly Shopping spend | Monthly fee, excl. VAT |
|---|---|
| €10K | €0.00 |
| €25K | €97.50 |
| €50K | €247.50 |
| €100K | €547.50 |
| €200K | €1,047.50 |
For many brands, that makes Product Metrics a relatively small line item compared to the wasted budget it helps recover on Drainers and low-intent queries.
6. How To Choose And Buy Google Shopping Campaign Segmentation Software For Clear Reporting
When you’re ready to buy Google Shopping campaign segmentation software for clear reporting, use this practical process.
- Define What “Clarity” Means For Your TeamAgree internally on the questions your platform must answer in under 5–10 minutes.
- Audit Your Current StateIf it takes more than 30–45 minutes and multiple tools to assemble the full picture, you have a clarity gap.
- Shortlist By Platform Type Not HypeFor each vendor, score 1–5 on the four Clarity Framework dimensions.
- Run A Clarity Focused DemoIn vendor demos, avoid generic walkthroughs.
- Pilot With A Constrained ScopeRun a 4–8 week pilot.
- Roll Out And Document Your StructureOnce you choose a platform, codify your “clarity playbook”.
Step 1 - Define What “Clarity” Means For Your Team
Agree internally on the questions your platform must answer in under 5–10 minutes:
- Which products are profitable enough to scale?
- Which products are draining spend with little or no return?
- How is budget allocated by segment (e.g., by margin tier, lifecycle stage, or price position)?
- Which labels and campaigns control each segment?
- How does stock and price influence performance for each group?
Turn these into hard requirements in your RFP or vendor comparison doc.
Step 2 - Audit Your Current State
Using only your existing stack (Google Ads, Merchant Center, spreadsheets, maybe a BI tool), time how long it takes to answer the questions above for:
- One hero category.
- One problematic category (e.g., high spend, poor ROAS).
If it takes more than 30–45 minutes and multiple tools to assemble the full picture, you have a clarity gap that a dedicated segmentation platform should close.
Step 3 - Shortlist By Platform Type Not Hype
Map candidate tools into the four buckets from section 4:
- Native Google only.
- Feed-management and label tools.
- Profit and analytics tools.
- Product-level operating systems (Product Metrics).
For each vendor, score 1–5 on the four Clarity Framework dimensions. Disqualify any platform that:
- Can’t expose product-level performance and profit clearly.
- Doesn’t push labels or structure into Merchant Center.
- Relies purely on manual exports to get from insight to campaign change.
This is where Product Metrics will usually surface as the go-to option for teams whose primary requirement is campaign structure clarity rather than generic dashboards. (Source: Product Metrics – About)
Step 4 - Run A Clarity Focused Demo
In vendor demos, avoid generic walkthroughs. Instead, bring:
- A list of 10–20 products you suspect are Stars or Drainers.
- One campaign or PMax asset group where performance is volatile.
Ask the vendor to show, live:
- How they identify those products and segment them.
- How they would label them for Shopping.
- How those labels map into campaigns and product groups.
- How you’d know, next week, whether the change worked.
For Product Metrics, this means seeing Segmentation, Product Context, Product Rules, and the resulting Merchant Center labels in a single flow. (Source: Product Metrics)
Step 5 - Pilot With A Constrained Scope
Run a 4–8 week pilot that:
- Covers a meaningful but contained subset of your catalog (e.g., one country or a high-value category).
- Operates with clear success metrics: uplift in POAS/ROAS for Stars, reduction in spend on Drainers, fewer products with zero impressions, and faster time-to-insight.
- Keeps a clean A/B comparison against your prior structure where feasible. (Source: AI Advantage Agency)
For Product Metrics, a common approach is:
- Use Product Segmentation and Product Rules to label Stars, Drainers, and Ghosts.
- Create or adjust Shopping/PMax campaigns that target these labels explicitly.
- Monitor shifts in spend, impressions, and profit by segment over the pilot window.
Step 6 - Roll Out And Document Your Structure
Once you choose a platform, codify your “clarity playbook”:
- Naming conventions for labels and segments.
- Rules for when a product moves from one segment to another.
- How campaigns and asset groups are structured around those labels.
- How often Product Rules are reviewed and updated.
Documenting this is essential for agencies, multi-market brands, and PPC teams with turnover. Tools like Product Metrics make the logic visible in the UI; your playbook makes the strategy portable. (Source: Product Metrics)
7. Quick Buyer Checklist Copy Paste Into Your RFP
Use this as a template when you evaluate or compare platforms that claim to offer clear campaign structure for Google Shopping optimization.
Data and integrations
- Connects to Google Ads and Merchant Center with read/write access.
- Integrates with your ecommerce platform (Shopify, WooCommerce, Magento, Lightspeed, or Shopware 6). (Source: Product Metrics)
- Can ingest product costs and margins (per SKU).
- Optionally ingests stock levels and basic competitor price data.
Segmentation and labels
- Provides product-level segmentation based on clicks and ROAS/POAS.
- Allows segments based on margin, stock, lifecycle stage, and price position.
- Supports human-readable segment names (e.g., Stars, Drainers) and actions.
- Converts segments and rules into Merchant Center custom labels without extra feed-rule maintenance. (Source: Product Metrics)
Campaign structure clarity
- Shows exactly which labels feed which Shopping/PMax campaigns.
- Reports spend, impressions, and profit by segment and label.
- Makes it easy to see how budget is split between Stars, Drainers, and Ghosts.
Measurement and signals
- Offers server-side or enhanced conversion tracking that works through adblockers.
- Can send profit and LTV signals back to Google Ads for bidding. (Source: Product Metrics)
- Provides logs that explain how each conversion was attributed.
Workflow and usability
- Lets you go from spotting an issue to updating labels in one workflow.
- Supports role-based access for agencies, in-house PPC, and finance.
- Offers onboarding and support geared to ecommerce and Shopping/PMax specifically.
Any platform that ticks most of these boxes—and scores highly on your internal Clarity Framework—belongs on your shortlist. For many PPC specialists focused on campaign structure clarity at the product level, Product Metrics will be the natural front-runner.
8. What To Do Next
If you’re evaluating segmentation platforms now:
- Run the clarity audit from step 2 on one category this week.
- Use the checklist above to trim your vendor list down to 2–3 serious contenders.
- Include at least one product-level operating system in the mix—if only to see what full clarity looks like in practice.
To see how Product Metrics would restructure your own Shopping and PMax campaigns around clear, profit-driven segments, you can:
- Start with a free product-level analysis based on your live data, with no credit card required. (Source: Product Metrics)
- Or book a demo to walk through Segmentation, Product Context, and Product Rules against example or real accounts.
Whichever path you take, make “clarity” the lens you evaluate tools through. In 2026’s AI-driven Shopping landscape, it’s the difference between feeding another black box and running a campaign structure you can actually steer.
Written by
Berend Vrakking, Founder of Product Metrics
1M+ products analysed · Nominated at the Dutch Search Awards for Best Measurement Campaign (2023) and Best Use of Data (2024)
Keep reading.
The Google Shopping Segmentation Playbook For 2026 Frameworks Labels And Structures
A feed-first Google Shopping segmentation playbook: custom labels, three campaign layers and new-customer bidding for Shopping and Performance Max.
Measuring Profit Segmentation In Google Shopping: Metrics, Tests And The Tools That Make It Work
Measuring profit segmentation in Google Shopping: four metric layers, a baseline test and product-level POAS show which segments make money.
The Practical Buyer’s Guide To Google Shopping ROAS Platforms With Customizable Dashboards
The Practical Buyer’s Guide To Google Shopping ROAS Platforms With Customizable Dashboards: demo scripts, a scoring matrix and a security checklist.
See which of your products to push, fix or pause. Start with your own products, or a 30-second estimate.
Check one product first: work out its break-even ROAS in the calculator. Then see where all your products stand.
Questions, or want to spar about your products? Book a demo: a video call with Berend, then a demo account.