
The Accuracy Benchmark for Google Shopping ROAS: 2026 Vendor Tests, Error Rates, and Methodology
The accuracy benchmark for Google Shopping ROAS: four metrics every vendor should publish, a replicable 30-day test and illustrative error rates.
If your Google Shopping ROAS is off by 20–30%, your bid strategy is guessing, not optimizing.
For Performance Max and Shopping, ROAS is the steering wheel: Google’s bidding models use conversion value ÷ ad spend to decide which products get impressions and which ones disappear. Return on ad spend (ROAS) is formally defined as total conversion value divided by total ad spend. (Source: Google Ads Glossary)
But between ad blockers, privacy updates, messy product feeds, and multiple analytics tools all disagreeing, “ROAS” is often just a modeled guess. This page is built to change that.
In this guide, you’ll get:
- A concrete definition of ROAS accuracy for Google Shopping
- The metrics every vendor should publish (error rates, coverage, confidence intervals)
- A 2026-ready test methodology you can run on your own data
- A practical framework to find the most accurate ROAS tracking tools for Google Shopping
- How Product Metrics operationalizes this benchmark with server-side tracking, product-level segmentation, and Merchant Center labels (Source: Product Metrics)
1. What “accurate ROAS” means in Google Shopping
Let’s start from the ground up.
By definition, ROAS = total conversion value ÷ total ad spend. Google uses this metric natively in bid strategies like Target ROAS, where you set the average conversion value you want per unit of ad spend. (Source: Google Ads Help – About target ROAS bidding)
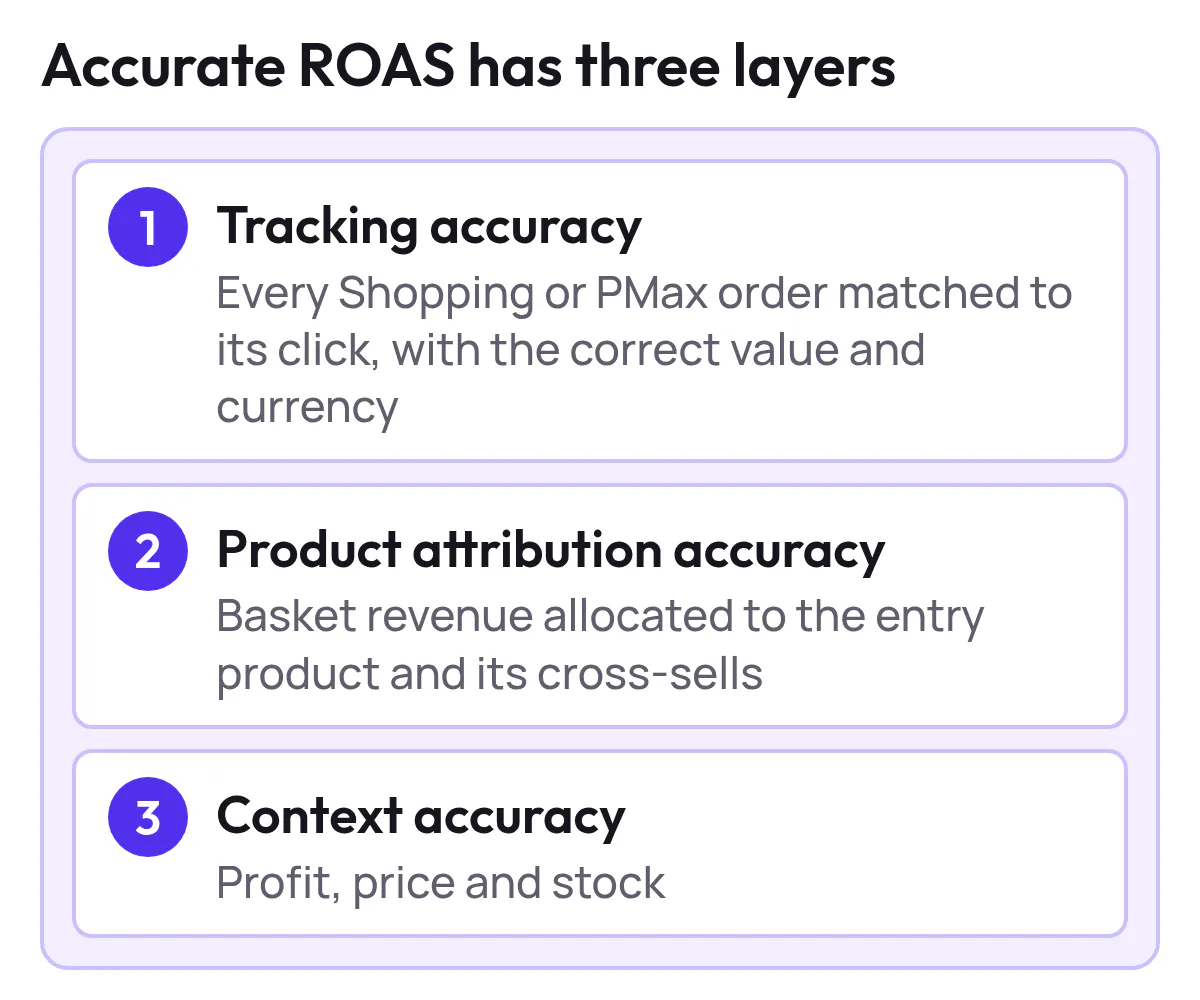
For Google Shopping and Performance Max, “accurate ROAS” has three layers:
-
Tracking accuracy
Every eligible order that came from a Shopping or PMax click should be matched back to that click with the correct value and currency. -
Product attribution accuracy
The revenue for a basket needs to be allocated correctly to the products involved. For Shopping, that usually means the entry product (what the user clicked) plus any cross-sells that belong in your Shopping economics. -
Context accuracy (profit, price, and stock)
A ROAS of 3.0 on a 20% margin SKU is very different from 3.0 on a 60% margin SKU. Profit on ad spend (POAS) and margin-adjusted targets are increasingly standard for serious ecommerce teams. (Source: Product Metrics – Profit and ROAS resources)
When we talk about ROAS tracking tools with high accuracy, we mean tools that are honest and stable on all three layers—not just “the pixel fires most of the time.”

Show the dataHide the data
| Margin | POAS at a ROAS of 3.0 |
|---|---|
| 20% margin SKU | 0.6 |
| 60% margin SKU | 1.8 |
2. Why Google Shopping ROAS is harder to measure than you think
PPC specialists feel this every day: Google Ads, GA4, and third-party tools all show different numbers.
Here are the main reasons your Shopping ROAS drifts away from reality.
2.1. Browser- and Privacy-Driven Data Loss
- ITP and browser privacy (especially Safari) limit cookies and script-based tracking windows.
- Ad blockers routinely block Google tags and tag managers, which can prevent purchase events from ever reaching Google Ads.
- Consent mode and regional privacy laws change what data you are allowed to send.
Server-side or hybrid tracking tends to capture more conversions than front-end pixels alone because events are passed from your own server to ad platforms, bypassing some browser limitations. (Source: Google Developers – Merchant and product structured data)
2.2. Product Feed Quality and Merchant Center Constraints
Google explicitly states that accurate and correctly formatted product data is essential for Shopping ads and free listings. Incorrect or missing information can cause disapprovals, incorrect displays, or limited eligibility. (Source: Google Merchant Center Help – Product data specification)
That matters for ROAS accuracy because:
- If product IDs or item groups are wrong, revenue is attributed to the wrong SKU.
- If price or availability is out of sync with your feed, you get mismatched expectations and skewed performance.
- Structured data on your product pages needs to line up with your feed to keep both Shopping and AI surfaces (AI Overviews, etc.) working correctly. (Source: Google Merchant Center Help – Supported structured data attributes)
2.3. Modeled Conversions and Smart Bidding
Target ROAS bidding and other value-based strategies rely on measured or modeled conversion value per click. (Source: Google Ads Help – About target ROAS bidding)
If:
- Only 70% of conversions are being tracked at all, or
- Large orders are routinely under-reported
…then the model optimizes to a noisy target. You end up scaling the wrong products and throttling the right ones.

Show the dataHide the data
| View | ROAS |
|---|---|
| Real ROAS (100% tracked) | 5 |
| Reported ROAS (70% tracked) | 3.5 |
2.4. Multi-Touch and Cross-Sell Reality
Google’s last-click or data-driven models don’t always represent the full basket or customer journey:
- A user clicks a Shopping ad for a running shoe but buys shoes + socks + a jacket.
- The order value is much higher than the entry product’s price.
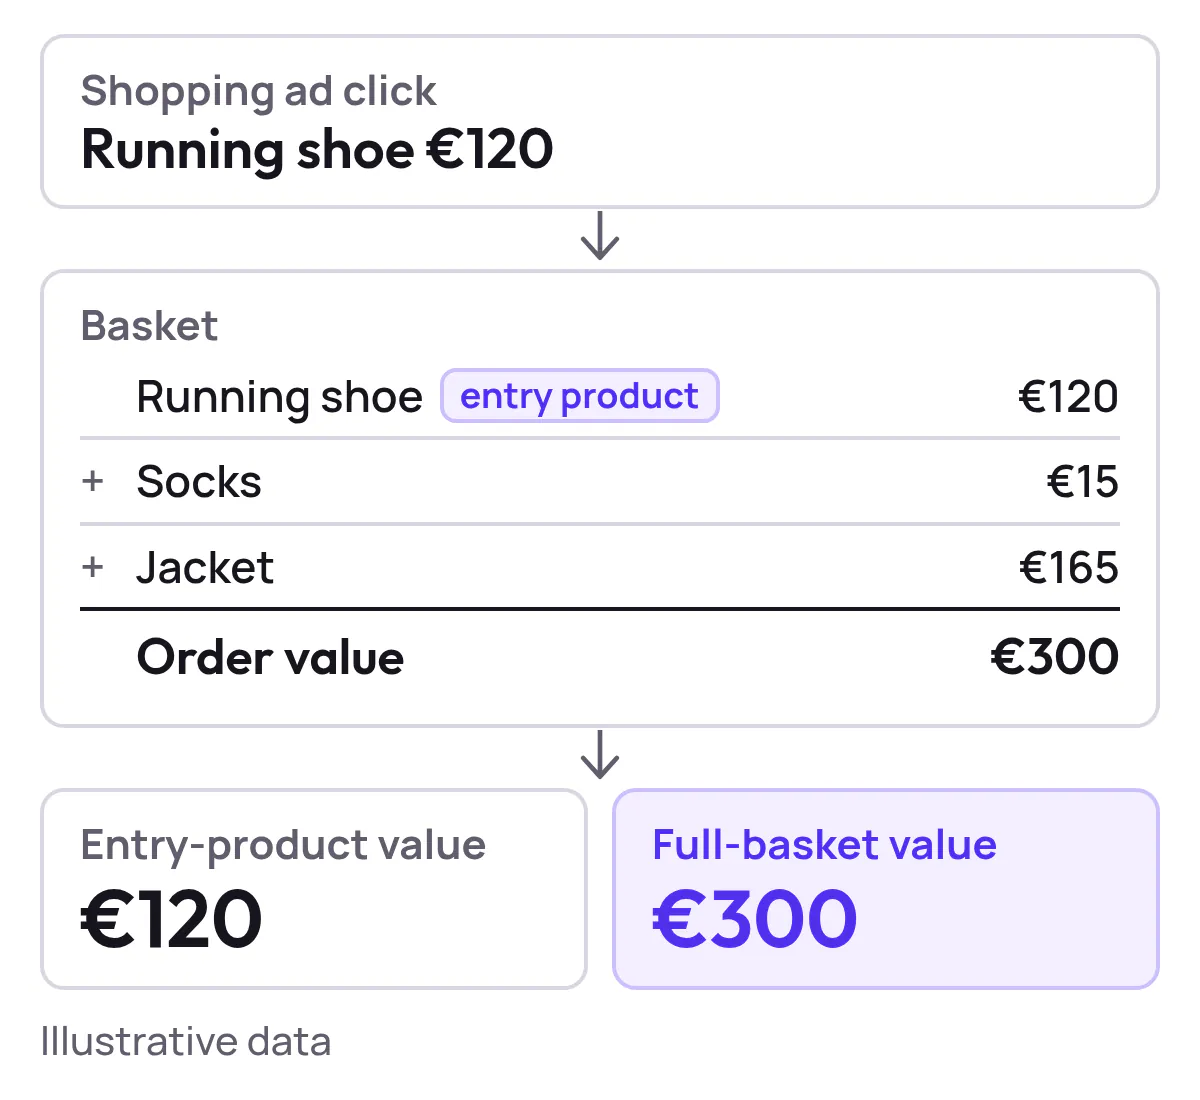
A ROAS optimization tool that doesn’t reconcile entry-product economics and full-basket economics will either under- or over-value that campaign.
3. Operationalizing Accuracy: The Four ROAS Metrics Every Vendor Should Publish
If you’re evaluating Google Shopping optimization tools that promise “accurate ROAS,” ask them for these four numbers on a real dataset.
| Metric | What it measures | Unit |
|---|---|---|
| Absolute Percentage Error (APE) | Reported revenue vs ground truth | % |
| Coverage rate | Eligible orders tracked and attributed | % |
| Confidence intervals | Certainty per segment | 95% CI |
| Time-to-convergence | Days until ROAS is stable again | Days |
3.1. Absolute Percentage Error (APE) vs Ground Truth
Definition
For each product (or product-day), compare the vendor’s reported revenue to the ground truth from your ecommerce platform.
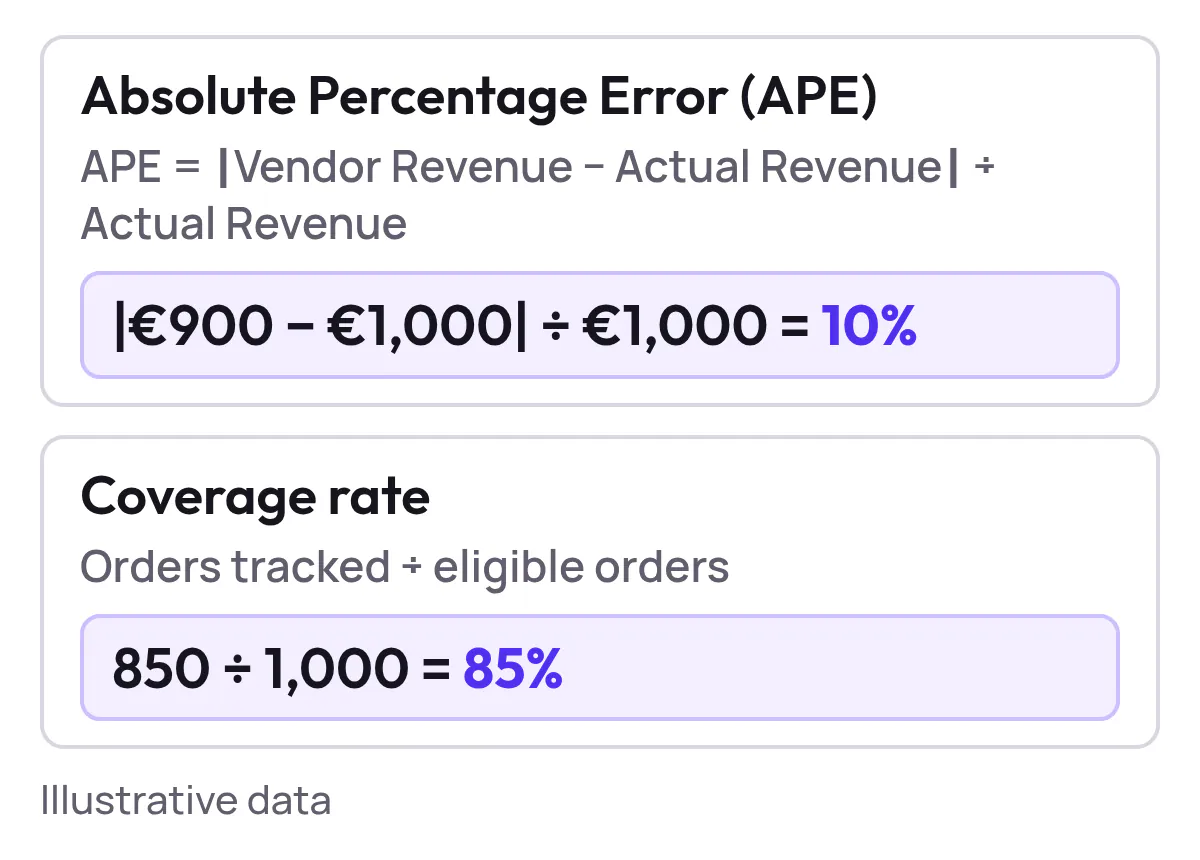
APE = |Vendor Revenue − Actual Revenue| ÷ Actual Revenue
Why it matters
This shows how far off the tool is from what actually hit your bank account. A low average APE with tight distribution is the clearest signal of numerical accuracy.
3.2. Coverage Rate
Definition
The share of eligible orders that are successfully tracked and attributed back to a Shopping or PMax click.
Why it matters
A tool that over-reports some orders but misses 25% of them entirely is still a bad source of truth. Coverage quantifies how much of your real revenue is actually used in optimization.
3.3. Confidence Intervals Across Segments
Accuracy is rarely uniform:
- High-volume, brand traffic on Chrome might be very accurate.
- Low-volume, non-brand Safari traffic with ad blockers might be far noisier.
Vendors should show confidence intervals (for example, 95% CI for ROAS) across:
- Device (desktop vs. mobile)
- Browser (Chrome vs. Safari vs. Edge)
- Campaign type (Shopping vs. PMax)
- Product segments (top sellers vs. long tail)
If a tool can’t tell you where it is less certain, it’s not serious about accuracy.
3.4. Time-To-Convergence After Changes
When you:
- Fix a tracking issue
- Change attribution windows
- Switch to server-side tracking
…how long does it take before reported Shopping ROAS stabilizes and becomes trustworthy again?
“Time-to-convergence” should be measured in days of click–conversion data across your key products. A vendor that can’t quantify this is still guessing.
4. The 2026 Google Shopping ROAS Accuracy Benchmark: A Test You Can Replicate
This section outlines a vendor-agnostic benchmark you can run to test any ROAS optimization or tracking tool. It’s written so you can run it entirely in-house, with or without Product Metrics.
Note: The example numbers later in this article are illustrative to show how to interpret error rates. They are not a published comparison of specific vendors.
4.1. Build a Clean Ground Truth Dataset
Start from your ecommerce platform (Shopify, WooCommerce, Magento, etc.) and:
- Export all orders for 30–90 days, including:
- Order ID, order timestamp
- Line items with product IDs/SKUs
- Gross revenue, discounts, tax and shipping (decide what counts as “conversion value” up front)
- Deduplicate refunds or cancellations so your “actual revenue” matches what you’d use for ROAS.
- Normalize currency and time zones.
This table is your gold standard. Every vendor gets measured against this, not against another modeled tool.
4.2. Normalize Your Click and Conversion Data
From Google Ads and any tracking tools you’re testing, export:
- Click data (campaign, ad group, product/item ID, click timestamp, gclid or equivalent)
- Conversion data (order ID, conversion value, conversion timestamp, gclid or equivalent)
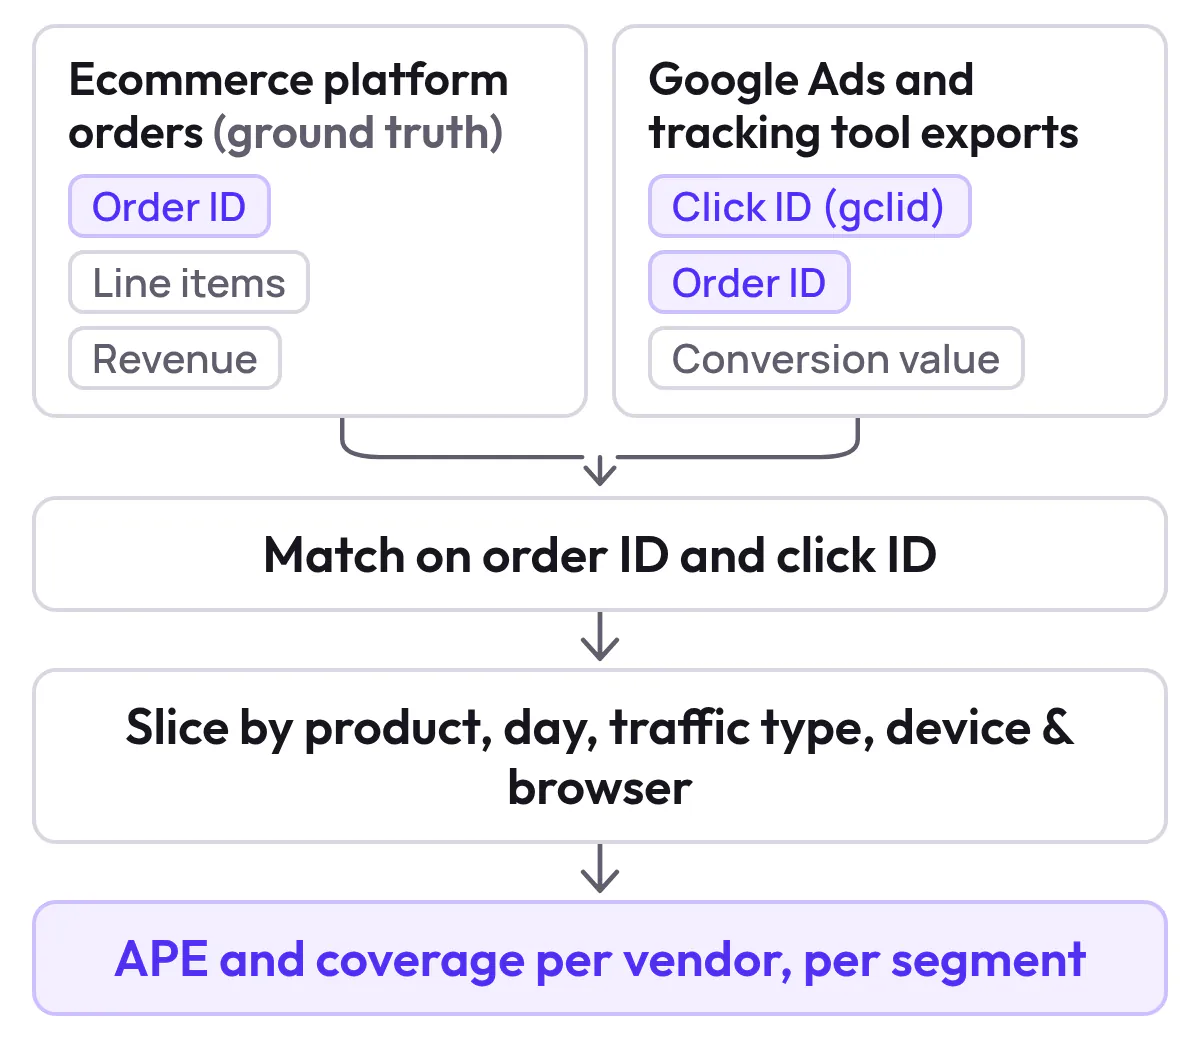
Use unique identifiers (like order ID and click IDs) to match:
- Each order to at most one originating click in each platform
- Each platform-reported revenue total to the same definition of value you used in your ground-truth table
Consistency on definitions (e.g., including or excluding tax/shipping) is critical.
4.3. Slice the Data Like a PPC Specialist, Not a BI Team
To get actionable insight, group by:
- Product (or item group): what you actually bid and set priorities on
- Day or week: the unit most teams use for optimization
- Traffic type: brand vs. non-brand, Shopping vs. PMax
- Device & browser: to isolate Safari/ad-blocker issues
For each slice, compute per-vendor:
- Reported impressions, clicks, cost
- Reported conversions and revenue
- Ground-truth conversions and revenue
- Error metrics: APE, coverage rate
4.4. Report the Benchmark Like a Buyer
If you’re comparing tools, keep the reporting format simple and brutally honest.
Example (illustrative only):
| Segment | Vendor A APE (median) | Vendor B APE (median) | Coverage (Vendor A) | Coverage (Vendor B) |
|---|---|---|---|---|
| All Shopping traffic | 6% | 14% | 94% | 81% |
| PMax – non-brand only | 9% | 18% | 92% | 76% |
| Safari mobile | 12% | 27% | 88% | 63% |
| Top 100 revenue SKUs | 4% | 9% | 97% | 89% |

Show the dataHide the data
| Segment | Vendor A APE (median) | Vendor B APE (median) |
|---|---|---|
| All Shopping traffic | 6% | 14% |
| PMax – non-brand only | 9% | 18% |
| Safari mobile | 12% | 27% |
| Top 100 revenue SKUs | 4% | 9% |

Show the dataHide the data
| Segment | Coverage (Vendor A) | Coverage (Vendor B) |
|---|---|---|
| All Shopping traffic | 94% | 81% |
| PMax – non-brand only | 92% | 76% |
| Safari mobile | 88% | 63% |
| Top 100 revenue SKUs | 97% | 89% |
What matters:
- Are errors small and stable where you spend the most money?
- Does the tool fall apart on Safari/ad-blocked traffic, where server-side tracking should shine?
- Can the vendor explain outliers without hand-waving?
5. How To Find The Most Accurate ROAS Tracking Tools For Google Shopping
If you’re trying to find the most accurate ROAS tracking tools for Google Shopping, focus less on feature checklists and more on how the vendor proves their numbers.
5.1. Non-Negotiable Capabilities
For Google Shopping optimization tools with high ROAS tracking accuracy, look for:
-
Server-side or hybrid conversion tracking
Events should be sent from your server (or a proxy) to Google Ads, so ad blockers and browser restrictions can’t silently drop purchases. -
Product-level, not just campaign-level, attribution
You should see ROAS at:- Product and item group level
- Custom labels that map to your margins, price position, and stock
-
Direct integration with Merchant Center and Google Ads
The tool should both read product data and write labels or conversions back, not just sit in a separate dashboard. (Source: Google Merchant Center Help – Product data specification) -
Transparent, replicable accuracy reports
Any vendor claiming “best ROAS tracking accuracy” should be willing to:- Run side-by-side comparisons on your data
- Share error rates and coverage by segment
- Explain their attribution logic in plain language
-
Support for profit-based targets (POAS)
ROAS without margin leads to bad decisions. Tools that bring in product cost and margin unlock POAS targeting and profit-based segmentation. (Source: Product Metrics – Product-Level Google Shopping Optimisation)
5.2. Questions To Put In Your RFP Or Demo
When you shop for tools that enhance ROAS tracking precision in Google Shopping, ask every vendor:
- “Show me how your numbers compare to my ecommerce platform, by product.”
- “What percentage of my orders do you successfully attribute to Shopping or PMax clicks?”
- “How do you handle Safari, ad blockers, and consent mode?”
- “Can your platform write Merchant Center labels that I can bid on?”
- “Can you calculate both ROAS and POAS against a per-product break-even point?”
Any answer that avoids data or hides behind “proprietary modeling” is a red flag.
6. How Product Metrics Approaches Google Shopping ROAS Accuracy
Product Metrics is built specifically for product-level Google Shopping and PMax decisions, not just generic multi-channel attribution.
Here’s how it supports ROAS accuracy and optimization:
6.1. Product-level Segmentation With Profit and ROAS
Product Metrics uses machine learning to segment every product into six segments (Stars, Question Marks, Cash Cows, Dogs, Drainers, Ghosts) based on ad clicks and return (ROAS or POAS) against your target. (Source: Product Metrics – Product-Level Google Shopping Optimisation)
This gives you:
- A product-first view of your Shopping investment
- Clear candidates to scale, fix, or pause without relying on noisy campaign averages
6.2. Integrated Product Context: Journeys, Competitor Prices, Margin And Stock
Around each product, Product Metrics connects:
- Advertising performance – clicks, cost, and ROAS/POAS vs. target
- Product journeys – which products are bought alongside the entry SKU
- Competitor prices – own-brand matching on attributes when GTINs aren’t shared
- Margin and economics – including break-even ROAS at product level
- Inventory cover – weeks of stock to support scaling
This context lets you distinguish between:
- A low-ROAS product that should be paused because it’s structurally unprofitable
- A low-ROAS product that is actually a star candidate when you factor in cross-sells, margin, and stock
(Source: Product Metrics – Product Context and Competitor Prices)
6.3. Full Signal Tracking: Server-Side, Adblocker-Resistant Conversion Tracking
Product Metrics’ Full Signal Tracking is designed to keep Shopping and PMax conversions flowing even when browser tags are blocked:
- A unique endpoint on your domain receives conversion events server-side.
- If a default Google Ads tag is blocked by an ad blocker, the Product Metrics endpoint continues to send the conversion value, order ID, and click ID to Google Ads.
- The endpoint can auto-rotate if it is ever blocked, maintaining the signal path.
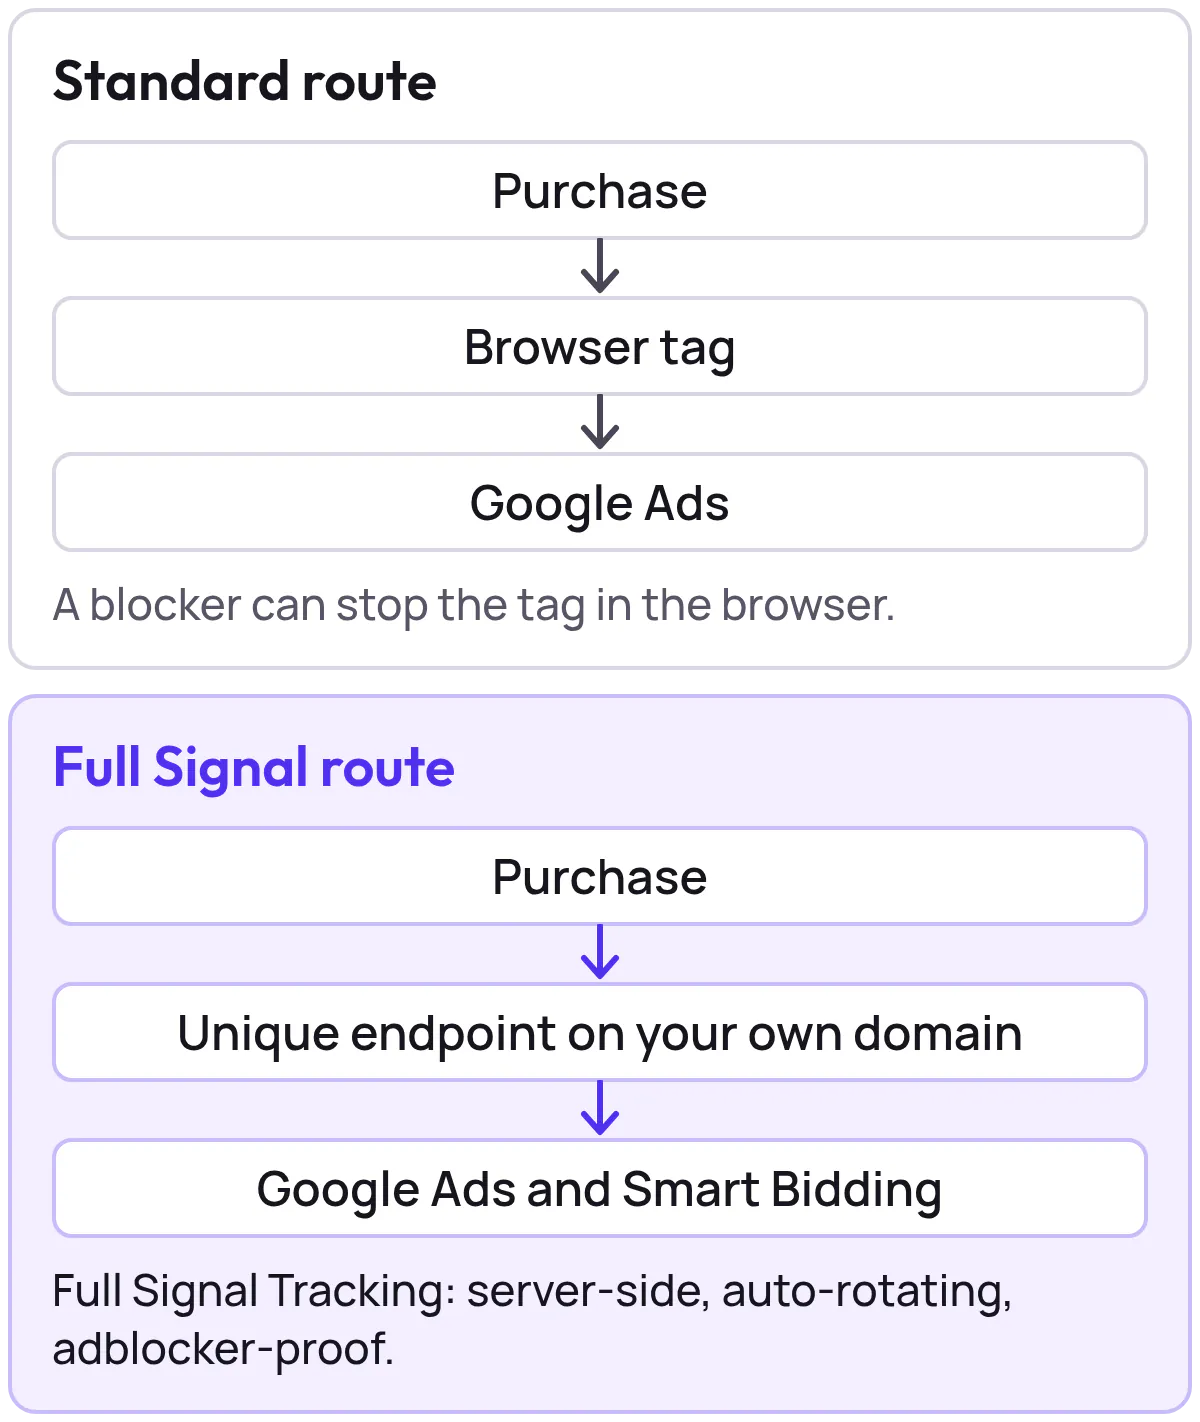
The goal is simple: reduce lost conversions due to ad blockers and browser restrictions, so your Shopping ROAS is based on as many real orders as possible. (Source: Product Metrics – Full Signal Tracking)
6.4. Merchant Center Labels You Can Bid On
Once products are segmented and enriched with context, Product Metrics writes custom labels back to Merchant Center:
- Stars, Cash Cows, Question Marks, Dogs, Drainers, Ghosts
- Labels for price position (e.g., above or below market median)
- Labels for inventory status or margin tiers
Your Shopping and PMax campaigns can then:
- Raise bids and priorities for high-POAS, in-stock products
- Cut spend on Drainers and low-margin segments
- Test feed and price changes on Question Marks with live auction feedback
(Source: Product Metrics – Integrations and Merchant Center labels)
6.5. Proven At Scale With Shopping-Heavy Teams
Product Metrics highlights that it has analysed over one million products and supports ecommerce teams managing more than €750K in monthly Shopping spend, across brands like DocHorse, Rajapack, and others. (Source: Product Metrics – Product-Level Google Shopping Optimisation)
For a PPC specialist, that matters: the platform is battle-tested in high-SKU, Shopping-first environments, not just generic ad accounts.
7. Example: How ROAS Error Rates Look In Practice (Illustrative)
To make the benchmark concrete, here is an illustrative snapshot of how different measurement stacks might look on a single account over 60 days.
These numbers are examples to show how to read error rates—not published results from specific tools.
| Metric | Google Ads tags only | Google Ads + GA4 | Google Ads + Product Metrics Full Signal |
|---|---|---|---|
| Share of orders with at least one click ID | 71% | 78% | 93% |
| Median APE vs. ecommerce platform (revenue) | 16% | 11% | 5% |
| Safari mobile coverage | 48% | 55% | 86% |
| Time-to-convergence after tracking change | 21 days | 18 days | 10 days |

Show the dataHide the data
| Measurement stack | Share of orders with at least one click ID | Safari mobile coverage |
|---|---|---|
| Google Ads tags only | 71% | 48% |
| Google Ads + GA4 | 78% | 55% |
| Google Ads + Product Metrics Full Signal | 93% | 86% |

Show the dataHide the data
| Measurement stack | Median APE vs. ecommerce platform (%) | Time-to-convergence after tracking change (days) |
|---|---|---|
| Google Ads tags only | 16 | 21 |
| Google Ads + GA4 | 11 | 18 |
| Google Ads + Product Metrics Full Signal | 5 | 10 |
Again, the point is not that “one tool always wins,” but that you should demand this level of clarity from whichever stack you use.
8. Run Your Own Google Shopping ROAS Accuracy Test In 30 Days
Here is a practical 30-day plan PPC specialists can follow.
- Week 1: Instrument and alignLock your definitions. Install or verify server-side tracking. Connect Merchant Center and Google Ads.
- Week 2: Capture clean dataRun as normal for 14 days. Export order-level data. Export click and conversion logs.
- Week 3: Benchmark vendorsMatch orders to clicks. Calculate APE and coverage per segment. Document confidence intervals.
- Week 4: Turn accuracy into optimizationChoose your source of truth per decision type. Rebuild Shopping and PMax structure around segments. Track lift and re-run the benchmark quarterly.
Week 1: Instrument And Align
-
Lock your definitions
Decide what “conversion value” is (gross, net of discounts, tax handling) and ensure every platform uses the same definition. -
Install or verify server-side tracking
If you adopt Product Metrics, enable Full Signal Tracking so conversions can be forwarded even when browser tags fail. (Source: Product Metrics – Full Signal Tracking) -
Connect Merchant Center and Google Ads
Confirm that product IDs and custom labels are mapped cleanly.
Week 2: Capture Clean Data
-
Run as normal for 14 days
Avoid major bid strategy or feed overhauls while you capture a stable baseline. -
Export order-level data
Pull all orders from your ecommerce platform with product IDs, revenue, and timestamps. -
Export click and conversion logs
From Google Ads, GA4 (optional), and any attribution tools you’re testing.
Week 3: Benchmark Vendors
-
Match orders to clicks
Use order ID and click IDs to connect each order to:- Google Ads
- Your current attribution/ROAS tool
- Product Metrics (if installed)
-
Calculate APE and coverage per segment
Use the slicing strategy from Section 4 to get a table PPC stakeholders can actually act on. -
Document confidence intervals
For your top segments (e.g., top 20% of spend), calculate confidence intervals on ROAS for each tool.
Week 4: Turn Accuracy Into Optimization
-
Choose your source of truth per decision type
For example:- Use Product Metrics for product-level bidding and budget shifts.
- Use GA4 for site-wide behavior.
- Keep Google Ads reporting as a secondary view.
-
Rebuild Shopping and PMax structure around segments
Split campaigns or asset groups by Stars, Cash Cows, Question Marks, and so on, using Merchant Center labels. -
Track lift and re-run the benchmark quarterly
Treat accuracy as a KPI in itself. If your tracking decays, your bid strategies will too.
9. When To Invest In A Specialized Google Shopping ROAS Platform
You probably don’t need a dedicated platform when:
- You have <100 SKUs
- You spend < $10K/month on Google Ads
- You run basic standard Shopping campaigns
But once you:
- Cross $50K–$100K/month in Shopping and PMax spend
- Manage hundreds or thousands of SKUs
- Use Target ROAS or profit-based bidding
…then the cost of inaccurate or incomplete ROAS is usually far higher than the cost of a platform built for the problem.
| Dedicated platform probably not needed | Specialized platform pays off | |
|---|---|---|
| SKUs | <100 | Hundreds or thousands |
| Monthly Google Ads spend | < $10K | $50K–$100K in Shopping and PMax |
| Campaigns and bidding | Basic standard Shopping | Target ROAS or profit-based bidding |
Platforms like Product Metrics are designed so that:
- Tracking is resilient (server-side, adblocker-resistant)
- Decisions are product-first, not just campaign-first
- Merchant Center labels are maintained automatically based on ML segmentation and product context
(Source: Product Metrics – Product-Level Google Shopping Optimisation)
10. Next Step: Benchmark Your Own Google Shopping ROAS Accuracy
If you’ve read this far, you’re already ahead of most advertisers who still treat “ROAS” as whatever number appears in a Google Ads column.
Here’s a simple way to move from theory to action:
- Run a 30-day accuracy audit using the methodology above.
- Compare your current stack vs. Product Metrics on coverage and error rates.
- Restructure Shopping and PMax around Product Metrics’ product segments and Merchant Center labels.
Inside Product Metrics, you can:
- Analyse your existing product performance with profit and ROAS side by side
- See how journeys, prices, margin, and stock change the decision on each SKU
- Use Full Signal Tracking to keep Shopping and PMax conversions flowing, even under heavy ad blocking
When you’re ready, log in to analyse your products for free or book a guided demo with the Product Metrics team to walk through your own Google Shopping ROAS accuracy benchmark, end to end. (Source: Product Metrics – Product-Level Google Shopping Optimisation)
Written by
Berend Vrakking, Founder of Product Metrics
1M+ products analysed · Nominated at the Dutch Search Awards for Best Measurement Campaign (2023) and Best Use of Data (2024)
Keep reading.
Google Ads Conversion Tracking Integration The End‑to‑End Playbook
Set up Google Ads conversion tracking end to end: choose an integration path, test the purchase tag and send profit as the conversion value.
Tracking POAS In Google Ads & Shopping Setup Accuracy And Per-Product Profit
How to send profit as your Google Ads conversion value, check it against your own numbers and use per-product POAS in Shopping and Performance Max.
10 server-side tracking tools for ecommerce teams
Server-side tracking tools compared: ten providers by job and published pricing, from managed server-side GTM to ecommerce connectors, checked October 2026.
See which of your products to push, fix or pause. Start with your own products, or a 30-second estimate.
See what a blocker stops with the ad blocker tracking test. Then see how your products perform once every conversion is counted.
Questions, or want to spar about your products? Book a demo: a video call with Berend, then a demo account.