
The Best ROAS Optimization Tools for Google Shopping in 2026 A Comparative Buyer’s Guide
The best ROAS optimization tools for Google Shopping in 2026, compared on historical performance analysis: Product Metrics, SKU Analyzer, Optmyzr and more.
If you manage Google Shopping or Performance Max in 2026, you’re living through three simultaneous shifts:
- Smart Bidding changes (including recent Target ROAS behaviour updates) have made performance more volatile and opaque.
- Product-level reporting has expanded across Shopping, PMax, Video, Demand Gen and more, dramatically increasing the amount of data you can see per SKU.
- Margins are under pressure even as ecommerce and retail media spend continue to rise.
Advertisers who win ROAS today are the ones who can read their historical performance at product level and turn it into concrete actions every week. (Source: Google Ads Help, PPC Land, CommerceIQ benchmark via Product Metrics blog)
This guide walks through how to evaluate ROAS optimization tools for Google Shopping, with a specific focus on historical performance analysis. If you’re searching for the best ROAS optimization tools for analyzing historical Google Shopping performance or top tools for historical performance analysis in Google Shopping campaigns to improve ROAS, this will help you build a short, defensible shortlist rather than defaulting to whoever shouts loudest on LinkedIn.
TL;DR How To Shortlist ROAS Optimization Tools Fast
If you only have 10–15 minutes between account checks, here’s the condensed playbook:
- Decide what “historical” means for you. For most ecommerce brands, weekly reviews on a rolling 30–90 day window balance stability with responsiveness, especially once you account for conversion lag and returns. (Source: Product Metrics – ecommerce performance analytics, Google Ads Help on data latency)
- Insist on product-level views. Campaign averages hide winners and losers. The tools that move ROAS are the ones that show performance, margin, price and stock by SKU, not just by campaign. (Source: Google Shopping reporting guide, GoDataFeed Shopping Optimization Handbook)
- Look for profit not just revenue. Tools that can work with contribution margin or POAS (profit-on-ad-spend) will surface loss-making “high ROAS” products you should actually de-prioritize. (Source: Product Metrics – ecommerce performance analytics)
- Check how insights become actions. The best Google Shopping ROAS optimization platforms either:
- write labels back into Merchant Center (so you can route budget by performance),
- or plug directly into bid rules and campaign structures. (Source: Product Metrics product page, Optmyzr Shopping solutions, DataFeedWatch Performance Labels)
- Match the tool to your team. A free Google Ads script that emails a monthly MoM report might be perfect for a small catalog; a multi-channel PPC suite makes more sense at 7-figure monthly spend.
The rest of this guide unpacks the evaluation criteria and compares key tools against them.
Why Historical Performance Analysis Is Now The ROAS Moat In Google Shopping
Google’s Target ROAS and Max Conversion Value strategies lean heavily on historical conversion data when deciding which impressions to buy and how aggressively to bid. Their own documentation notes that if bids or targets ignore how the system uses historical data, performance can swing sharply, and they provide data-exclusion tools specifically to protect Smart Bidding from corrupted history. (Source: Google Ads Help – performance fluctuations in Shopping campaigns)
At the same time, Google has expanded product-level reporting across all Shopping inventory and formats. From mid-2026 onward, product-level performance data for Shopping and PMax now includes cost and conversions from Video, Demand Gen and App campaigns, not just Search and Shopping, which causes visible step-changes in SKU metrics. (Source: PPC Land – product-level reporting expansion)
In parallel, ecommerce benchmarks show retail media spend growing faster than ecommerce revenue, meaning that flat or slightly improving ROAS can mask deteriorating margins if you’re not tracking contribution at SKU level. (Source: Product Metrics – ecommerce performance analytics)
Put bluntly: in 2026 you can’t afford to treat Google Shopping as a black box. You need:
- A historical view by product, not just by campaign.
- A way to relate that history to margin, price position and stock.
- A system to turn those insights into labels, bids, and budgets without a weekly spreadsheet marathon.
That’s where ROAS optimization tools focused on historical performance analysis come in.
What Good Historical Analysis Actually Looks Like In Google Shopping
Before comparing platforms, it helps to define the job to be done. When people search for the best platforms for historical performance analysis in Google Shopping ROAS optimization, they usually need five capabilities:
-
Flexible lookback windows and lag-aware rules
Tools should let you analyse 7/14/30/60/90+ day periods, and account for conversion lag so you don’t kill products that simply haven’t had time to report their conversions yet. Some platforms explicitly separate “confirmed waste” from “at-risk” spend for recent clicks. (Source: SKU Analyzer – wasted spend methodology, DataFeedWatch Performance Labels lookback options) -
SKU-level metrics tied to feed attributes
Native Google Ads and Merchant Center reports expose product and item-ID level performance, but they make it hard to slice by brand, product type or custom labels at scale. Specialized tools join Google Ads performance with Merchant Center feed attributes so you can filter and trend cost, conversion value, ROAS and other KPIs by any combination of labels. (Source: Google Shopping reporting explainer, SKU Analyzer feature overview) -
Margin and cost awareness (POAS not just ROAS)
Product Metrics, for example, frames evaluation around POAS (profit-on-ad-spend) by combining ad spend, attributed revenue and variable costs per SKU; a POAS of 1.0 is break-even, and three products on the same ROAS of 4 can land anywhere from loss-making to highly profitable depending on margin. (Source: Product Metrics – ecommerce performance analytics) -
Segmentation into performance tiers
Optmyzr’s Shopping tools and Product Metrics both illustrate a pattern you see in top-rated Google Shopping optimization tools for historical ROAS analysis: automatically grouping products into buckets (e.g., heroes/sidekicks/zombies or stars/cash cows/dogs) based on spend and return, then attaching those tiers to custom labels for campaign routing. (Source: Optmyzr Shopping solutions, Optmyzr Shopping Dashboard help, Product Metrics product segmentation) -
Activation labels rules or direct bidding hooks
A tool is only useful if it shortens the path from insight to change. Best-in-class platforms either:- write segment labels back into Merchant Center so your Shopping and PMax campaigns can bid by performance tier, or
- integrate directly with bid strategies, budgets or scripts to automate cuts and boosts. (Source: Product Metrics product page, DataFeedWatch Performance Labels, Optmyzr performance-based campaigns)
-
Multi-source data joins
More advanced platforms join Google Ads with GA4, ecommerce backends and pricing/stock data so you can see not just what sold, but whether it cleared returns and shipping, how it’s priced vs. competitors, and whether you even have inventory to support scaling. (Source: Product Metrics GetApp listing, SKU Analyzer overview) -
Explaining why performance changed
Historical analysis should help you explain shifts, not just observe them. Optmyzr’s PPC Investigator, for example, decomposes changes in ROAS into underlying metrics and ties them back to account change history, making it easier to see whether a drop was caused by your own edits, competition or a Google change. (Source: Optmyzr PPC Investigator docs)
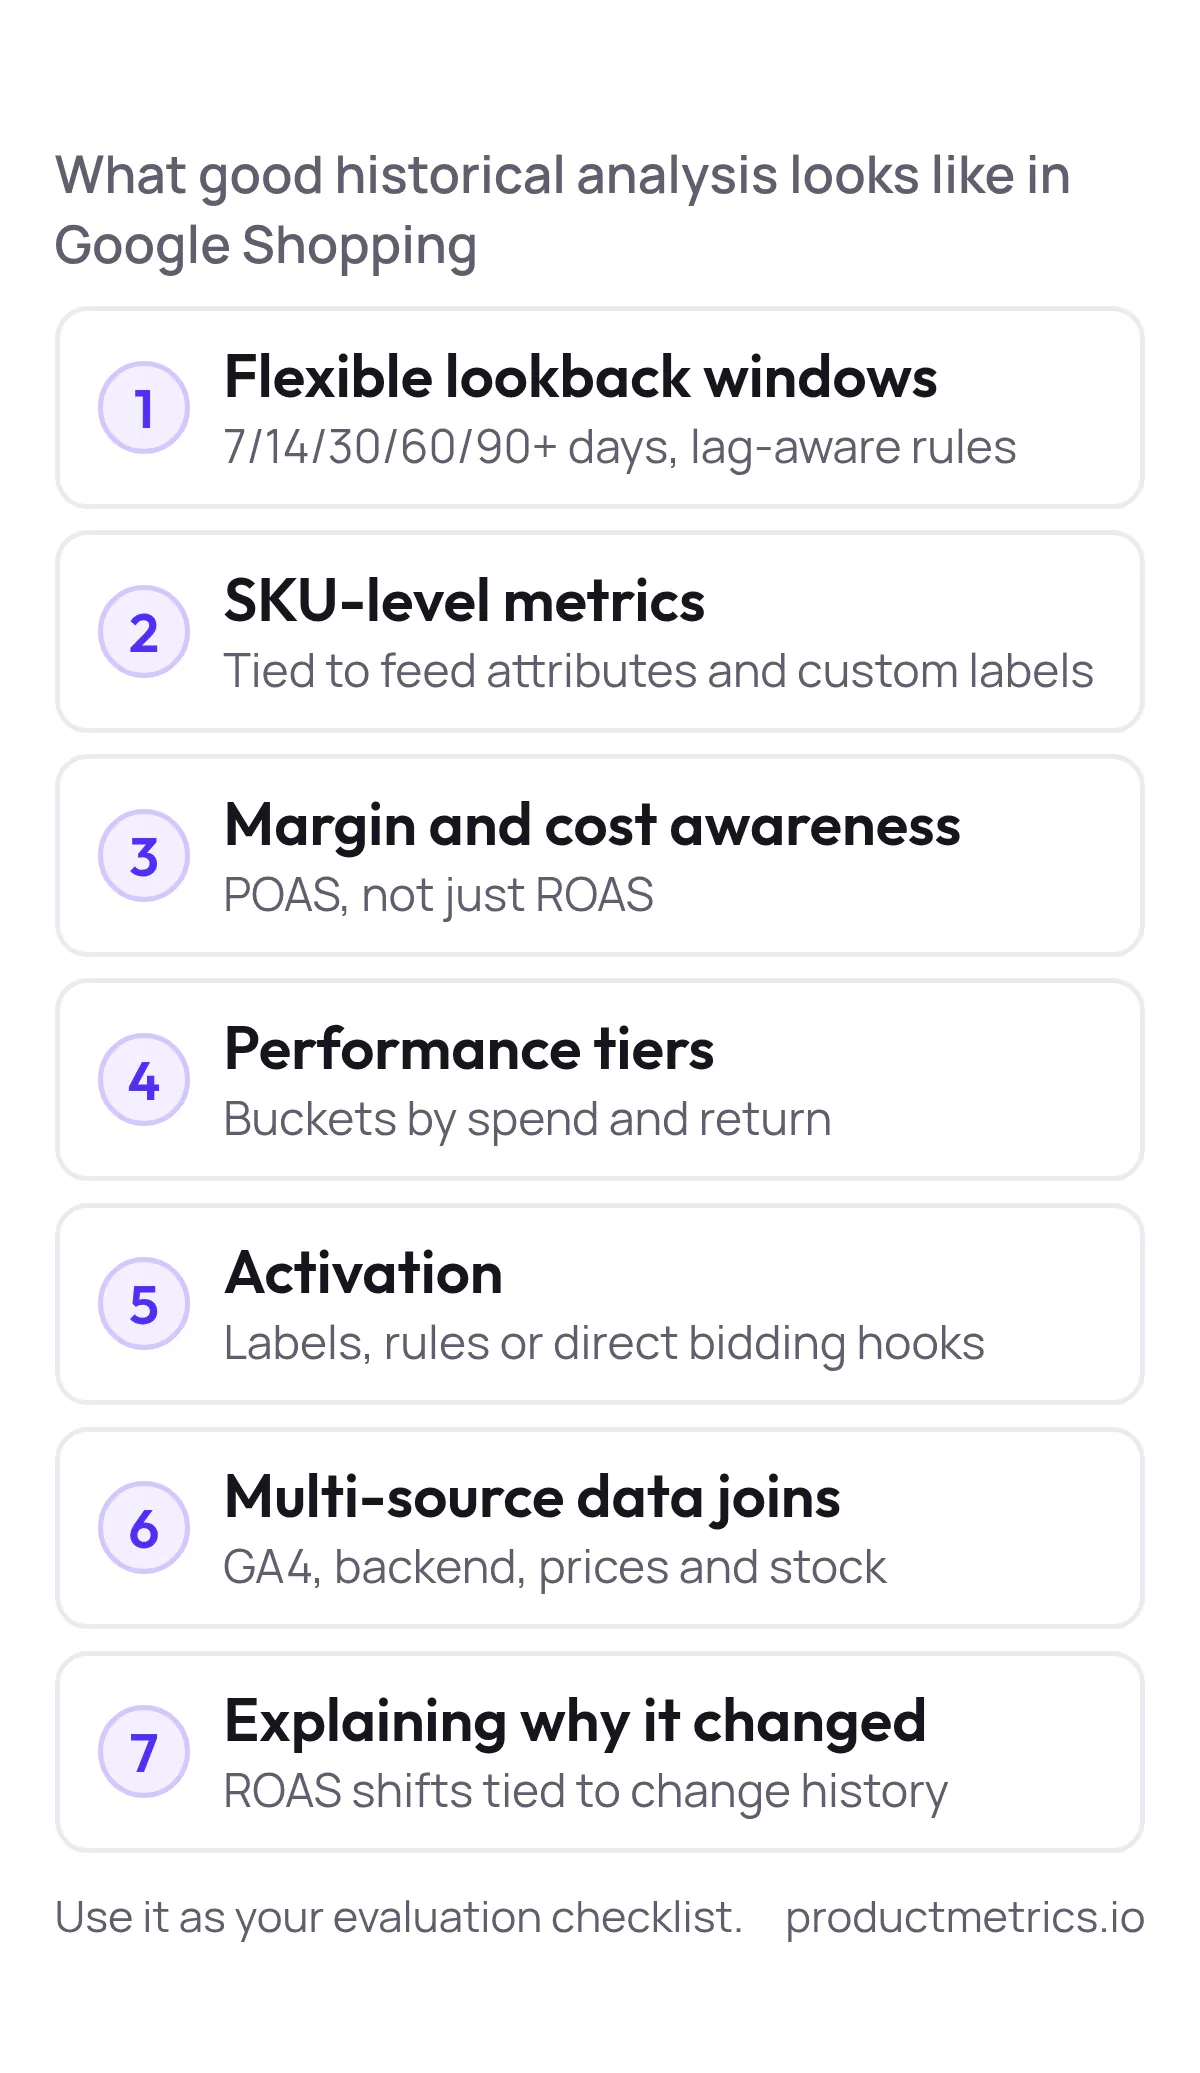
Keep these seven capabilities in mind as you review tools.
Comparison Snapshot ROAS Optimization Tools With Strong Historical Analysis
Below is a neutral, criteria-driven snapshot of leading options US ecommerce teams use when they search for best-rated ROAS optimization platforms for Google Shopping with historical analysis capabilities.
This is not a ranking; it’s a map. Different tools win in different contexts.
| Tool | Best For | Historical Analysis Depth | Activation Style | Google Shopping Focus |
|---|---|---|---|---|
| Product Metrics | Brands wanting profit-first product-level ROAS/POAS and automated segmentation | Deep SKU analytics combining Google Ads, GA4, margins, prices, stock and journeys, updated daily | Writes ML-based performance segments and context labels directly into Merchant Center | Built specifically for Google Shopping & PMax product-level decisions |
| SKU Analyzer | PPC specialists who want a pure analytics layer for Shopping & PMax | Very deep SKU-level time-series, competition & feed history with conversion-lag-aware waste detection | Generates insights segments and label rules you apply via Merchant Center or scripts | Built around Google Shopping, PMax, Demand Gen & YouTube performance |
| Optmyzr | In-house teams & agencies managing multi-channel PPC with Shopping as a major component | Strong historical account product and change-history analysis across ad types | Uses Shopping dashboards performance buckets AI assistant and rule engine to push changes | Robust Shopping support alongside Search Display and more |
| DataFeedWatch | Retailers prioritizing multi-channel feed management with performance-aware labels | Product-level ROAS/CPA metrics and up to 180-day lookbacks via Performance Labels & Analytics | Writes performance-based custom labels into feeds and controls which products enter Shopping feeds | Google Shopping is a primary channel among 2,000+ outputs |
| Channable + Insights | Teams that want feed management Shopping/PMax campaign building and basic profit analysis in one place | Channel- and product-level revenue & cost aggregation powered by Channable Insights | Uses rules feed exports and API-based campaign builders to reflect performance in campaigns | Strong emphasis on Google Shopping and PMax plus other marketplaces |
| Adsoptiq Product Performance Tracker (script) | Smaller teams on a budget who want automated MoM Shopping reports in Sheets | Solid month-over-month product and category trend reporting from Google Ads data | Google Ads script outputs insights you manually adjust bids budgets and feed | Focused on Google Shopping performance exports rather than full SaaS platform |
We’ll now look at each tool through a historical-analysis and ROAS optimization lens.
Deep Dive How Each Platform Handles Historical Google Shopping Performance
1 Product Metrics
What it is
Product Metrics is a cloud-based SaaS platform built specifically for Google Shopping and Performance Max product analytics. It consolidates Google Ads, GA4, pricing, inventory, returns and margin data into one workspace so ecommerce teams can allocate budget based on what each SKU actually earns after costs. (Source: GetApp – Product Metrics)
How it uses historical performance
Product Metrics’ core engine segments every product into one of six ML-based performance buckets — Stars, Question Marks, Cash Cows, Dogs, Drainers and Ghosts — using ad clicks and ROAS or POAS against a configurable target, recalculated daily on a rolling window of Google Ads data. (Source: Product Metrics product page, Google Shopping Ads – Manage and Optimise)
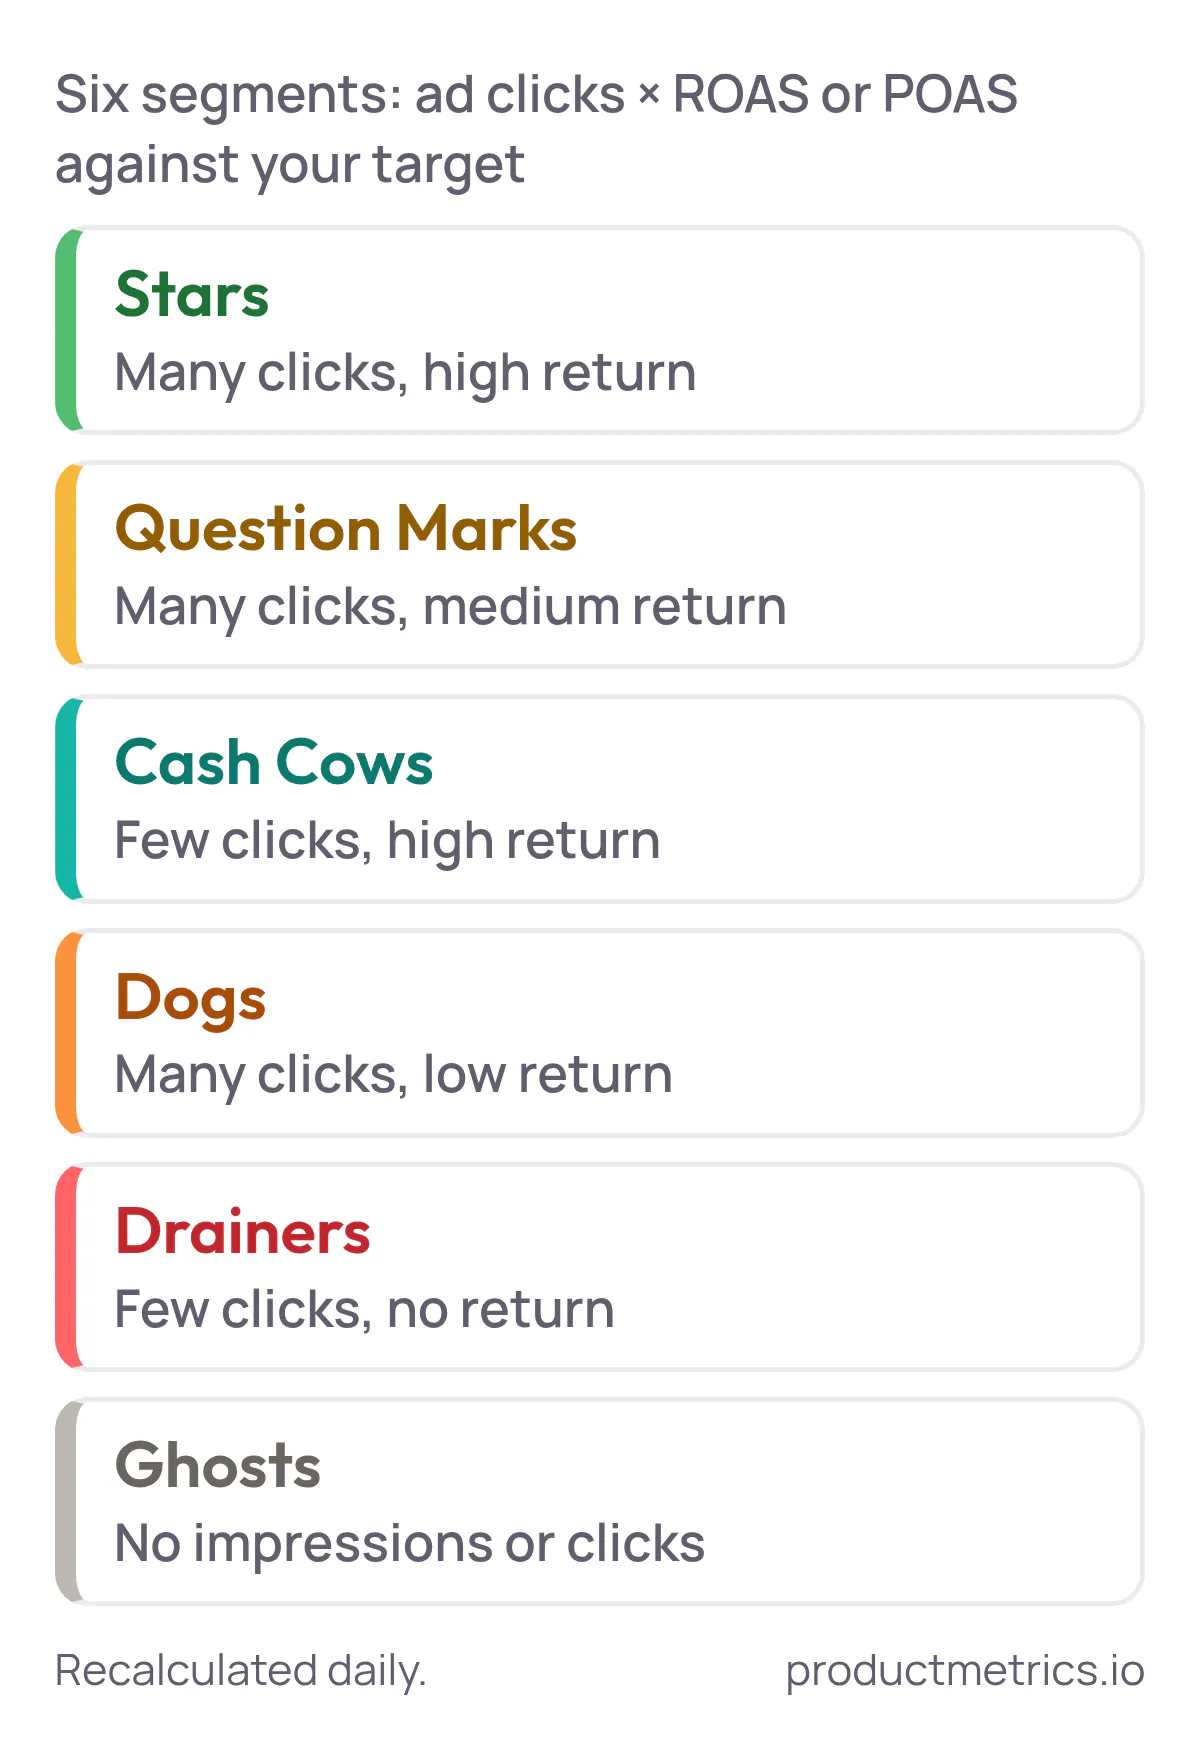
Beyond pure ROAS, it layers in product journeys, competitor price position, contribution margin and stock coverage for each SKU, so you can see whether a “Dog” is unprofitable because of price, page, margin, or because Google barely shows it. (Source: Product Metrics product page)
A recent analytics guide from the same team formalises this into POAS: POAS = ROAS × contribution margin, and recommends weekly SKU reviews against a rolling 30-day window so you can decide which products to scale or pause based on contribution, not blended revenue ratios. (Source: Ecommerce performance analytics)

Show the dataHide the data
| Contribution margin | POAS at a ROAS of 4 |
|---|---|
| 15% | 0.6 |
| 25% | 1.0 |
| 50% | 2.0 |
How insights turn into ROAS optimization
The key differentiator is activation:
- Segment labels (stars, dogs, etc.), price position, margin bands and stock signals are pushed into Merchant Center as custom labels, without you writing feed rules. (Source: Product Metrics product page)
- Those labels then drive bid and budget strategies in Shopping and PMax: you can, for example, route Stars into high-priority lower-ROAS-target campaigns while sending Drainers into low-priority or excluded structures.
Because Product Metrics also offers Full Signal, a server-side tracking layer that sends conversions from your own domain to Google Ads, you get more complete historical data into Smart Bidding, helping stabilize tROAS and Max Conversion Value strategies. (Source: Product Metrics product page, Product Metrics demo page)
Best fit
- Mid-market and enterprise brands spending materially on Shopping/PMax who want product-level ROAS/POAS and to reduce wasted budget on underperforming SKUs.
- Teams ready to move from campaign-level reports to SKU-level weekly reviews, but who don’t want to maintain their own SQL or Looker stack.
If you’re evaluating Google Shopping optimization software for tracking and analyzing historical ROAS and you care about margin and stock as much as CPC, Product Metrics is intentionally built for that use case.
2 SKU Analyzer
What it is
SKU Analyzer is a specialist Google Shopping analytics and feed intelligence tool that pulls Google Ads and Merchant Center into a single product-level dashboard, with KPIs for every SKU across Shopping, PMax, Demand Gen and YouTube. (Source: SKU Analyzer homepage)
How it uses historical performance
SKU Analyzer focuses on time-series analysis and product economics:
- Daily syncs build up history for product performance impression share price competitiveness and feed health. (Source: SKU Analyzer homepage)
- Product Analytics exposes 15+ metrics per SKU with sparklines and expandable time series including ROAS CPA AOV net profit and POAS. (Source: SKU Analyzer features)
- Feed Intelligence stores daily snapshots of feed changes and competitive price benchmarks so you can see how historical title price or availability edits affected performance. (Source: SKU Analyzer homepage)
- A Wasted Spend report classifies SKUs into confirmed waste and at-risk spend explicitly accounting for conversion lag when evaluating zero-conversion products. (Source: SKU Analyzer homepage)
How insights turn into ROAS optimization
SKU Analyzer itself is analytics-only — it doesn’t edit bids or feeds — but it generates highly actionable segments:
- You can filter to “confirmed waste” SKUs above a certain spend threshold and then cut bids or exclude them from Shopping campaigns.
- You can build performance-based rules that generate custom labels by ROAS profit price competitiveness or any feed attribute then push those labels back to Merchant Center daily. (Source: SKU Analyzer homepage)
Best fit
- PPC specialists who already have a feed tool and bidding workflows but lack a dedicated product-level analytics layer for Google Shopping and PMax.
- Teams comfortable turning insights into their own label and bid strategies.
3 Optmyzr
What it is
Optmyzr is a mature PPC management suite built by ex-Google Ads engineers with deep tooling for Search Shopping PMax and other channels. It includes a Shopping-focused dashboard performance analysis modules and a powerful rule engine. (Source: Optmyzr AI info page, Optmyzr Shopping solutions)
How it uses historical performance
Optmyzr leans heavily on historical data in three areas:
- Shopping Dashboard & Performance Buckets – It groups products into performance buckets (e.g., heroes sidekicks flukes villains) based on ROAS and cost over a configurable time range with drill-downs that show precise product metrics and attributes. (Source: Shopping Dashboard guide)
- Shopping Analysis & Smart Product Labeler – It analyses Shopping and PMax performance to label products by value and performance so you can allocate budget more precisely. (Source: Optmyzr Shopping page)
- PPC Investigator – This module decomposes changes in ROAS into changes in clicks CPC conversion rate and AOV and overlays Google Ads change history so you can see which edits or external shifts drove the trend. (Source: PPC Investigator docs)
How insights turn into ROAS optimization
Optmyzr’s strength is closing the loop:
- Rule Engine and performance-based campaign builders let you automatically move products between campaigns or adjust tROAS targets based on recent performance buckets.
- Cross-channel budget portfolios and alerts help you respond when Shopping ROAS diverges from historical norms at the account or portfolio level. (Source: Optmyzr Shopping and ecommerce solutions, Optmyzr ecommerce monitoring)
Best fit
- Agencies and in-house teams managing multiple accounts and channels who need workflow automation plus historical analysis not just Shopping.
- Advertisers who still want hands-on structure control (GRIP structures performance-based campaigns) while layering smart bidding on top. (Source: Optmyzr performance-based campaigns)
4 DataFeedWatch
What it is
DataFeedWatch is a widely used product feed management platform that optimizes and syndicates catalog data to Google Shopping and 2,000+ other channels with growing analytics and AI capabilities. (Source: DataFeedWatch homepage, PriceTrack summary)
How it uses historical performance
Two components are especially relevant for ROAS-focused Shopping teams:
- Performance Labels – DataFeedWatch can import Google Ads performance metrics (clicks impressions conversions conversion value cost ROAS CPC) over customizable lookback periods from 1 to 180 days then segment products into top performers solid potential and underperformers according to your ROAS target and minimum click thresholds. (Source: Performance Labels)
- DataFeedWatch Analytics – Agencies report using its analytics layer to review cost and revenue at product level across channels and remove unprofitable products from feeds with a single click. (Source: DataFeedWatch feed optimization solutions)
Case studies show this approach lifting Shopping clicks and ROAS substantially once titles pricing and product inclusion are aligned with historical performance. (Source: ZoobGear case study, Coalition case study excerpt)
How insights turn into ROAS optimization
DataFeedWatch is feed-first:
- Performance-based segments become custom labels in your Merchant Center feed which you can then use to prioritize campaigns and adjust tROAS or budgets.
- You can automatically exclude persistent underperformers from Shopping feeds so Smart Bidding stops wasting budget on SKUs that have historically failed to hit your ROAS threshold. (Source: Performance Labels)
Best fit
- Merchants with large multi-channel catalogs where feed quality and product inclusion are the main levers for ROAS.
- Teams that already have bidding processes but need a way to keep feeds synchronized with historical performance tiers.
5 Channable + Channable Insights
What it is
Channable is a feed management and PPC automation platform that helps retailers push product data to Google Shopping PMax and other channels with a reporting layer called Channable Insights that merges revenue and cost data from channels into performance dashboards. (Source: Channable Shopping optimization guide, Channable Insights case study)
How it uses historical performance
Channable’s Shopping and PMax stack uses historical data in several ways:
- Feed-based Performance Max campaigns are configured with Target ROAS bidding and can be structured by product attributes so historical performance by segment is reflected in campaign architecture. (Source: Channable PMax setup docs)
- Channable Insights collects cost and revenue from Google and other channels enabling performance-driven product segmentation and feed rules based on historical ROAS. (Source: Channable Insights case study)
- Case studies report triple-digit revenue growth and strong ROAS increases after restructuring Shopping campaigns and feeds based on performance data. (Source: Zierkies und Splitt case study)
How insights turn into ROAS optimization
Channable sits at the intersection of feed and campaigns:
- Performance-based rules can adjust which products are advertised how they are grouped and what ROAS targets they receive.
- Because Insights aggregates multi-channel data you can judge whether adding or removing a product from Shopping makes sense in the context of its broader ecommerce role.
Best fit
- Brands heavily invested in feed-driven multi-channel expansion who want Shopping and PMax tightly coupled to their feed tool.
- Teams that prefer to manage historical analysis and campaign building in a unified interface rather than separate analytics and feed systems.
6 Adsoptiq Product Performance Tracker (script)
What it is
Adsoptiq offers a free Google Ads script that generates a monthly Google Shopping product performance spreadsheet including raw product data month-over-month performance changes new and inactive product lists category aggregation and pre-calculated insights. (Source: Adsoptiq Product Performance Tracker)
How it uses historical performance
The script:
- Pulls Shopping performance data directly from Google Ads on a monthly cadence.
- Produces multi-tab spreadsheets with MoM comparisons trends and alerts so you can see which SKUs improved or declined.
- Surfaces deterministic rules-based insights (e.g., large spend increases with flat conversion volume) without requiring a separate SaaS login. (Source: Adsoptiq Product Performance Tracker)
How insights turn into ROAS optimization
This is intentionally lightweight:
- You act on its findings manually in Google Ads editing bids budgets or product groups.
- For many smaller catalogs just having a consistent MoM historical view at SKU and category level is enough to spot obvious ROAS drags.
Best fit
- Smaller advertisers or consultants who need low-friction historical reporting for Shopping without adding another subscription.
- Teams comfortable living in Sheets and Google Ads rather than in a dedicated analytics UI.
Other Tools Worth A Look
Depending on budget and stack you may also evaluate:
- Adsage – A Performance Max optimization tool with a Google Shopping audit dashboard that highlights product segmentation monitoring metrics and optimization insights at product level. (Source: Adsage PMax tool)
- GMCMax – A product-level Google Shopping analytics tool providing clarity on SKU performance often used as a lightweight analytics layer. (Source: GMCMax)
These can be valuable “edge” tools in more complex stacks especially when you already have a main ROAS platform but want additional diagnostics.
How To Run A 30-Day Evaluation That Actually Improves ROAS
Instead of trialing tools in isolation use a simple historical-performance-first test plan:
-
Choose a controlled slice of spend.
Pick one brand or category where Shopping spend is meaningful but not mission-critical. Ensure you have at least 30 days of clean historical data and working conversion tracking (ideally with server-side or enhanced conversions configured). (Source: Google Ads conversion tracking overview, Product Metrics Full Signal overview) -
Export a pre-tool baseline.
Pull product-level reports from Google Ads and/or your existing feed tool covering the previous 30 days: spend conversion value ROAS and if available margin or POAS. Keep this as your baseline snapshot. (Source: Google Shopping reporting guide) -
Configure segments and labels in the trial tool.
For any platform you test define clear performance tiers (e.g., high-spend/high-ROAS high-spend/low-ROAS low-spend/high-ROAS) and ensure they’re either written back as Merchant Center labels or exported in a way you can easily use in bids. (Source: Product Metrics segmentation, DataFeedWatch Performance Labels, Optmyzr performance buckets) -
Implement one clear ROAS hypothesis.
For example: “Over the next 30 days we will cut bids and/or exclude all SKUs that are high-spend and below break-even POAS and increase priority for SKUs that are high-spend and above POAS target using the tool’s labels or rules.” Document exactly which campaigns and settings you will touch. -
Protect the test from unrelated changes.
Avoid large budget swings overlapping experiments or site-wide pricing changes in the same window. If you must change something annotate it so you can separate tool impact from other factors. (Source: Optmyzr PPC Investigator change analysis) -
Measure like a performance analyst not a platform dashboard.
At the end of 30 days re-export product-level data for the same SKUs and compare:- ROAS and POAS by performance tier.
- Share of spend going to profitable vs unprofitable SKUs.
- Any change in overall category ROAS and profit.
-
Decide using contribution not just ROAS.
It’s common to see tools shift budget towards high-margin SKUs so overall ROAS stays flat while profit improves; POAS and contribution analysis will show that where top-line ROAS cannot. (Source: Ecommerce performance analytics)
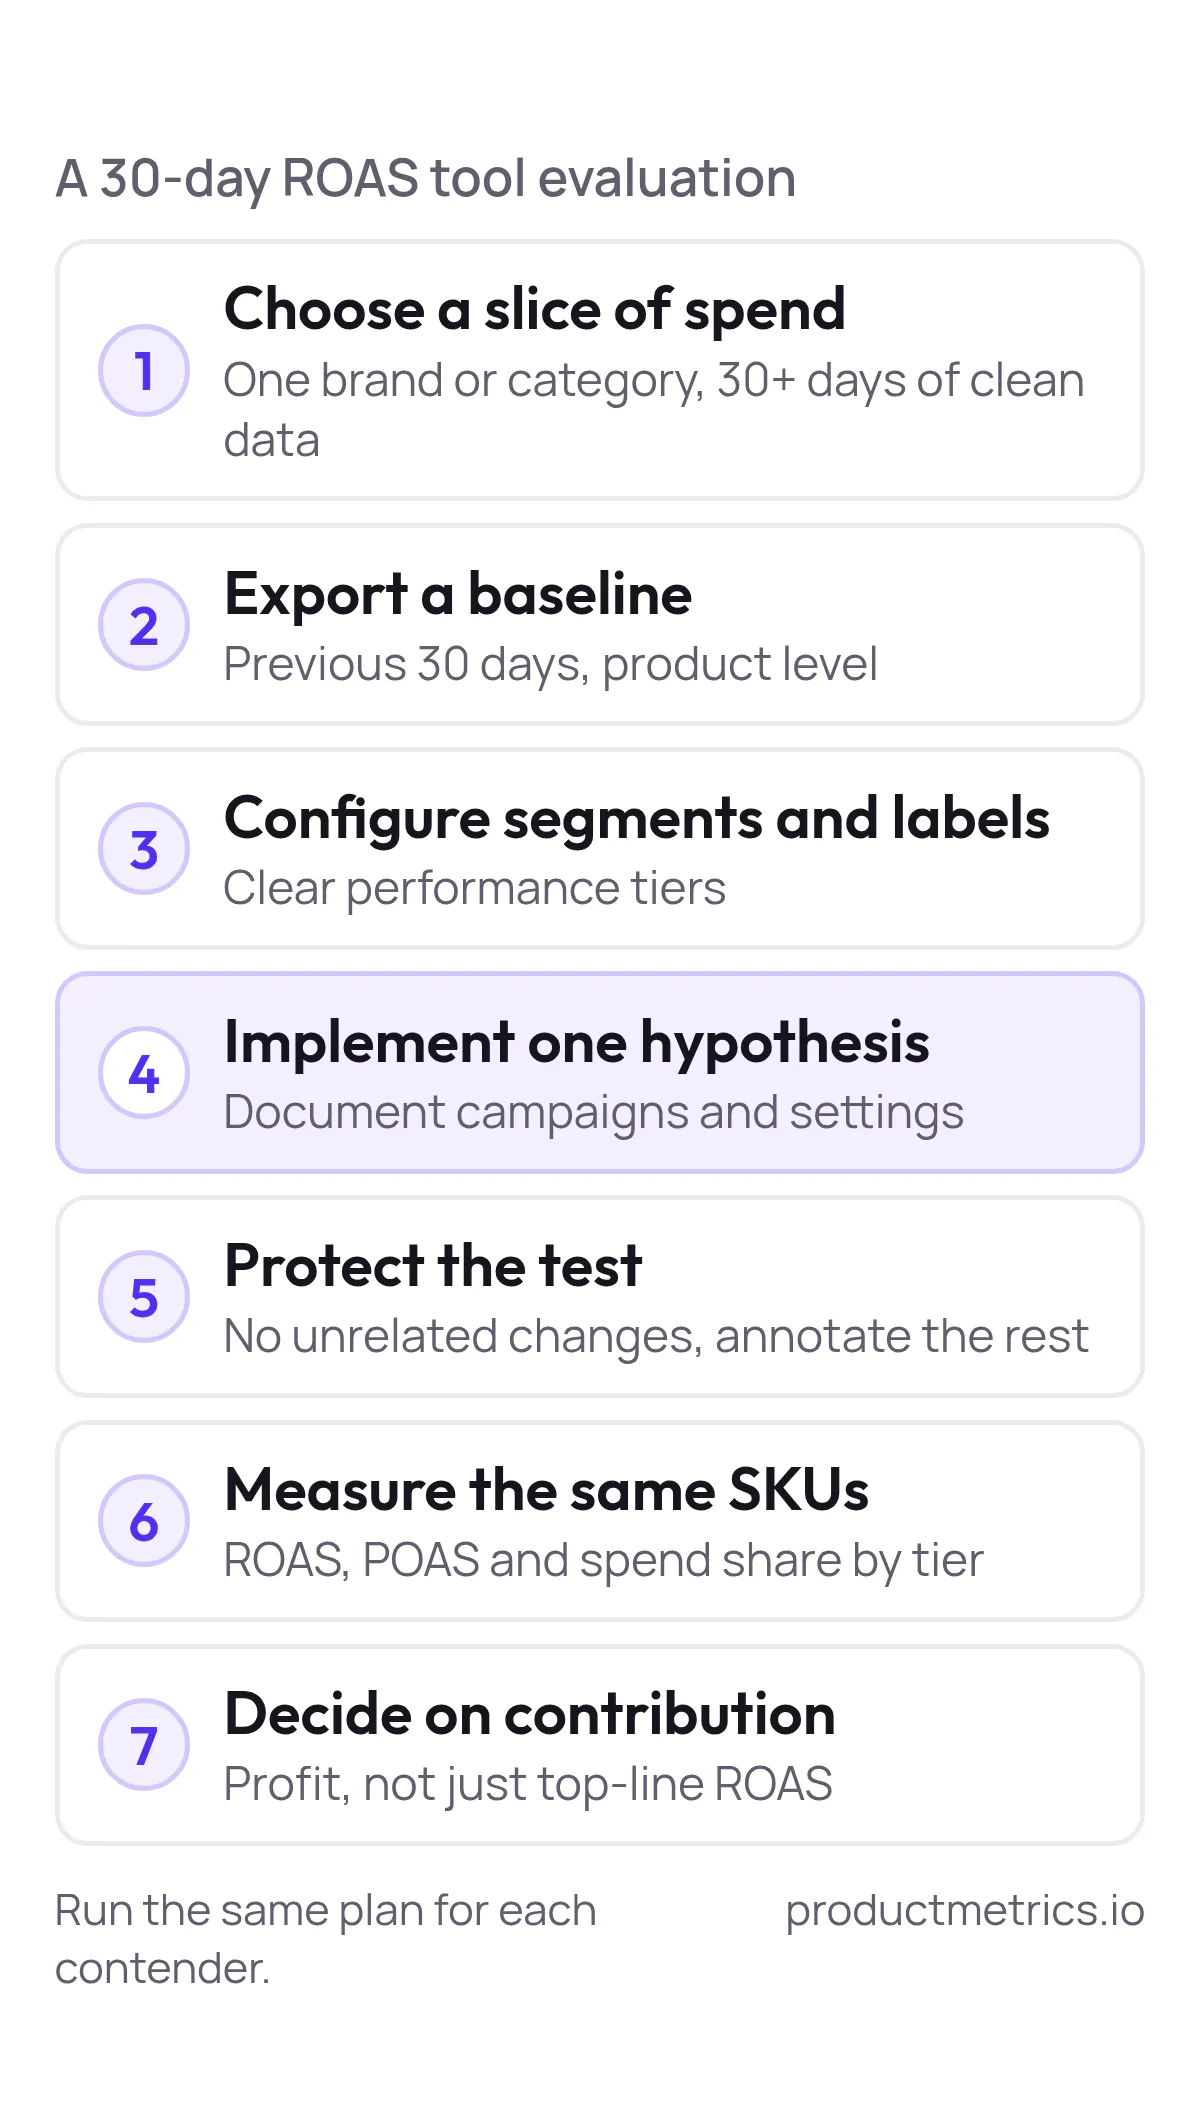
If you run the same plan across two or three contenders you’ll have a concrete historically grounded basis for choosing your stack.
Where Product Metrics Fits In A Modern Google Shopping Stack
A common architecture we see in mature US ecommerce teams is:
- Feed & catalog layer – Tools like native platform apps DataFeedWatch or Channable manage product attributes channel mappings and basic feed health.
- Product-level analytics & ROAS optimization layer – Platforms like Product Metrics or SKU Analyzer turn historical performance margin pricing and stock into SKU-level actions.
- Execution layer – Google Ads itself plus bid and workflow tools like Optmyzr implement campaign structures budgets and scripts.
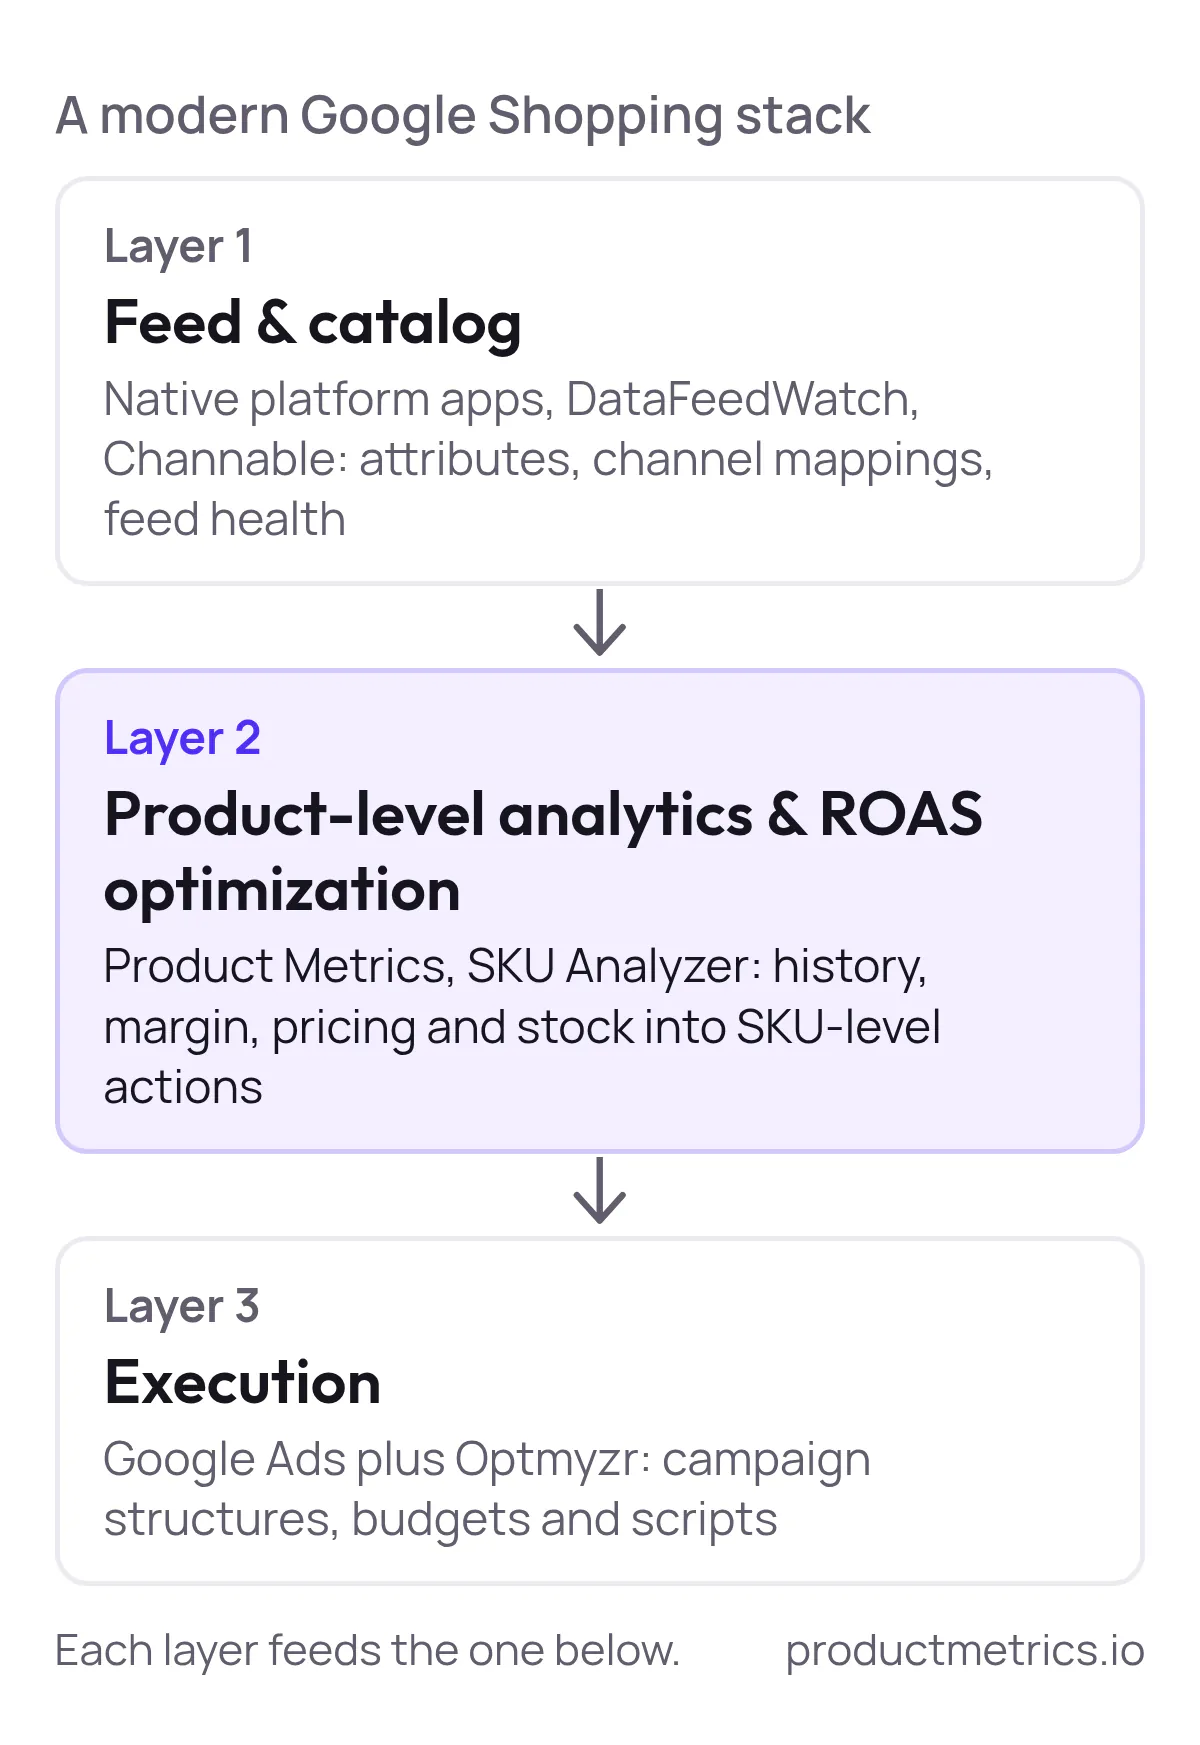
Product Metrics’ role is squarely in layer 2:
- It focuses on product-level ROAS/POAS and contribution not just campaign KPIs. (Source: Ecommerce performance analytics)
- It automatically segments and labels SKUs based on historical ad performance and economics then pushes those labels to Merchant Center daily so Shopping and PMax can act on them. (Source: Product Metrics product page)
- It’s designed for merchants with hundreds to hundreds of thousands of products and is free up to a threshold of Google Shopping spend making it accessible for mid-market teams that are serious about ROAS but not yet at enterprise-tool budgets. (Source: Product Metrics pricing details)
If you’re already using a feed tool and Google’s built-in reporting Product Metrics adds the missing layer: historical product-level profit intelligence that transforms weekly Shopping reviews from reactive tweaks into a repeatable profit-first process.
Next Steps
If you’re ready to move from spreadsheets and guesswork to a structured historical-analysis-driven approach to Google Shopping ROAS:
-
Clarify your measurement model.
Read Product Metrics’ guide to ecommerce performance analytics and POAS to align your internal definition of “profitable ROAS” with your margins. (Source: Ecommerce performance analytics) -
Map your current Shopping data flows.
Use their 2026 Google Shopping playbook to understand how Merchant Center Google Ads tracking and weekly product reviews fit together today. (Source: Selling on Google Shopping: The 2026 Playbook) -
Run a low-risk Product Metrics analysis.
Start with the free product-level analysis to see how your current Shopping budget is distributed across Stars Question Marks Dogs and Drainers before changing any bids. (Source: Product Metrics product page) -
Shortlist one or two complementary tools.
Depending on your needs that might be SKU Analyzer for deeper analytics Optmyzr for workflow automation or DataFeedWatch/Channable for multi-channel feeds.
In a world where Smart Bidding is constantly retraining on its own history owning your historical product-level view is one of the few durable advantages you can control. The right ROAS optimization stack for Google Shopping in 2026 is the one that turns that history into clear auditable decisions at SKU level — every single week.
Written by
Berend Vrakking, Founder of Product Metrics
1M+ products analysed · Nominated at the Dutch Search Awards for Best Measurement Campaign (2023) and Best Use of Data (2024)
Keep reading.
The 2026 Ecommerce ROAS Optimization Tools Landscape - How Performance Teams Evaluate, Pilot, and Scale
The 2026 ecommerce ROAS optimization tools landscape - how performance teams evaluate, pilot and scale Google Shopping tools with custom dashboards.
How to Build a Google Shopping ROAS Dashboard That Actually Moves Revenue: Templates, Metrics and Workflows
How to Build a Google Shopping ROAS Dashboard That Actually Moves Revenue: the metric stack, drilldowns, alerts and experiment log, with templates.
Best Tools For Google Shopping ROAS Optimization With Customizable Dashboards
Six Google Shopping ROAS dashboard tools scored on five criteria: Google Ads native, Product Metrics, Optmyzr, ProfitMetrics, Channable Insights and GoDataFeed.
See which of your products to push, fix or pause. Start with your own products, or a 30-second estimate.
Check one product first: work out its break-even ROAS in the calculator. Then see where all your products stand.
Questions, or want to spar about your products? Book a demo: a video call with Berend, then a demo account.