
Google Shopping ROAS Optimization Tools - A Practical 2026 Buyer’s Guide (Features, Pricing, Fit)
Google Shopping ROAS optimization tools - a practical 2026 buyer’s guide: tools compared by layer, a five-part ROAS accuracy framework and an RFP checklist.
If you manage Google Shopping or Performance Max, there’s a good chance your budget has grown faster than your confidence in the numbers.
Clicks and conversions keep coming in, but:
- ROAS looks too good in some campaigns and suspiciously weak in others.
- P&L says one thing, Google Ads says another.
- Every vendor promises “better ROAS”, yet few explain how they measure it—or how much of your revenue they’re actually seeing.
This guide is written for practitioners and buying committees who need to evaluate Google Shopping optimization platforms with advanced ROAS measurement, not just click-level bid tools. It focuses on:
- What “accurate ROAS” really means in Google Shopping.
- Where different categories of tools sit in the stack.
- How to compare pricing models and team fit.
- A concrete RFP checklist you can lift into your procurement doc.
Throughout, we’ll use Product Metrics as an example of a product-level ROAS and profit intelligence layer, while keeping the comparison even-handed.
1. What “Accurate ROAS” Really Means in Google Shopping
1.1 The Simple Math
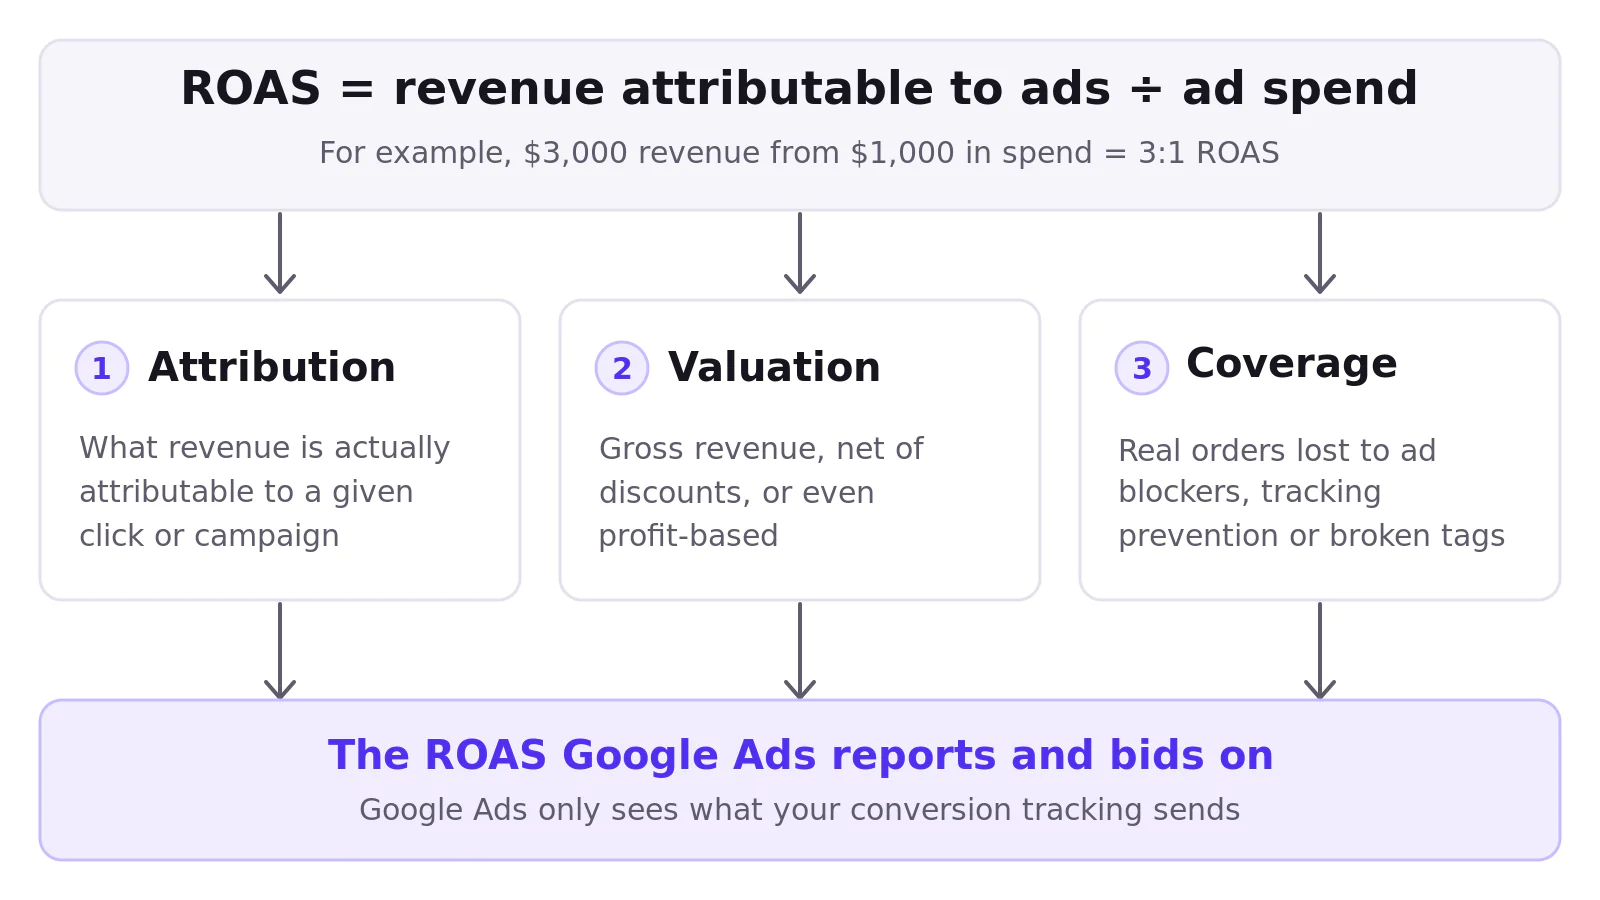
Return on ad spend (ROAS) is usually defined as:
ROAS = revenue attributable to ads ÷ cost of ads (ad spend)
(for example, $3,000 revenue from $1,000 in spend = 3:1 ROAS).
This is the standard formulation you’ll find in performance marketing literature and vendor glossaries. (Source: Adjust)
On paper, that’s straightforward. In practice, three things complicate ROAS for Google Shopping:
- Attribution – what revenue is actually attributable to a given click or campaign.
- Valuation – whether the revenue number is gross, net of discounts, or even profit-based.
- Coverage – how many real orders never make it into your tracking due to ad blockers, tracking prevention, or broken tags.
Google Ads itself only sees what your conversion tracking sends; its own reporting and any target ROAS (tROAS) bidding are built on that signal. (Source: Google Ads Shopping automation docs)
1.2 Break-Even ROAS and Profit-Based Metrics
Even perfectly implemented ROAS can still mislead you if you ignore margin:
- A 4:1 ROAS might be wildly profitable for a 60% margin product.
- The same 4:1 could be loss-making for a 20% margin product once product cost, shipping, and fees are considered.
A common way to handle this is to calculate a break-even ROAS for each product as:
Break-even ROAS = 1 ÷ contribution margin

Show the dataHide the data
| Contribution margin | Break-even ROAS |
|---|---|
| 60% | 1.67 |
| 25% | 4 |
| 20% | 5 |
If contribution margin is 25%, the break-even ROAS is 4; anything below that loses money, anything above generates profit. Product Metrics’ own guides on break-even ROAS and POAS (profit on ad spend) operationalize exactly this per-product approach for Google Shopping. (Source: Product Metrics – Break-even ROAS per product)
Tools that talk about “advanced ROAS measurement” but ignore margin, refunds, and fees are usually just doing better arithmetic on the same incomplete revenue number.
2. Why ROAS Accuracy Is Fragile in 2026
If you’re shopping for advanced ROAS optimization platforms for Google Shopping, it helps to be explicit about what is breaking the numbers today.
2.1 Product Data and Eligibility
Shopping and Performance Max campaigns read products from Google Merchant Center, where you upload a structured product feed. Google explicitly treats this product data as a “foundational input” to match products to the right queries and power AI-driven ad formats; inaccurate or incomplete data can lead to disapprovals, limited eligibility, and poor performance. (Source: Google Merchant Center – Product data specification)
Put differently: if your feed is wrong, your measured ROAS is based on the subset of products Google is willing and able to show.
2.2 Campaign Types and Product-Level Reporting
For retail, Google recommends either:
- Shopping campaigns, or
- Performance Max with a Merchant Center data source, both of which use your product feed to power product listings across Search and the Shopping tab. (Source: Google Ads Help – Choose the right campaign type)
Recent updates have also centralized product performance across these campaign types into a Products tab in Google Ads, giving retailers a single view of cost, conversions, and revenue per product across Shopping, Performance Max, Video, App and Demand Gen campaigns. (Source: Google Ads Help – About Product Reporting)
That’s a big step forward, but it’s still built on whatever conversion values arrive from your tracking.
2.3 Signal Loss From Ad Blockers and Tracking Prevention
Standard client-side tags (Google Tag Manager, GA4, Google Ads tags) are increasingly blocked or modified by privacy tools and browsers:
- In a 2026 lab run by Product Metrics, several popular blockers (Brave Shields, uBlock Origin Lite, AdGuard with Tracking Protection) stopped or replaced all four standard Google tracking requests they tested, while a first-party endpoint survived all setups. (Source: Product Metrics – Enhanced conversions vs server-side tracking)

Show the dataHide the data
| Blocker setup | Requests stopped or replaced |
|---|---|
| Brave Shields | 4 |
| uBlock Origin Lite | 4 |
| AdGuard + Tracking Protection | 4 |
When purchases don’t reach Google Ads at all, no amount of algorithmic “optimization” can fix the missing conversions. Any software for tracking and optimizing ROAS in Google Shopping needs a story for how it addresses or at least quantifies this loss.
2.4 Attribution Versus Incrementality
ROAS is an attribution metric: it uses digital tracking to allocate revenue back to media touchpoints. Marketing effectiveness research stresses that for a full picture, ROAS should often be complemented with methods like marketing mix modeling (MMM) and incrementality testing, which estimate the causal effect of media beyond tracked clicks. (Source: Wikipedia – Marketing effectiveness)
Few Google Shopping optimization tools cover MMM or incrementality directly—but you should at least understand how their attribution assumptions line up with your overall measurement strategy.
3. The Google Shopping ROAS Stack - Where Tools Actually Operate
Before comparing vendors, map how they sit on top of Google’s own stack. Most Google Shopping ROAS optimization software fits into one (or more) of these layers.
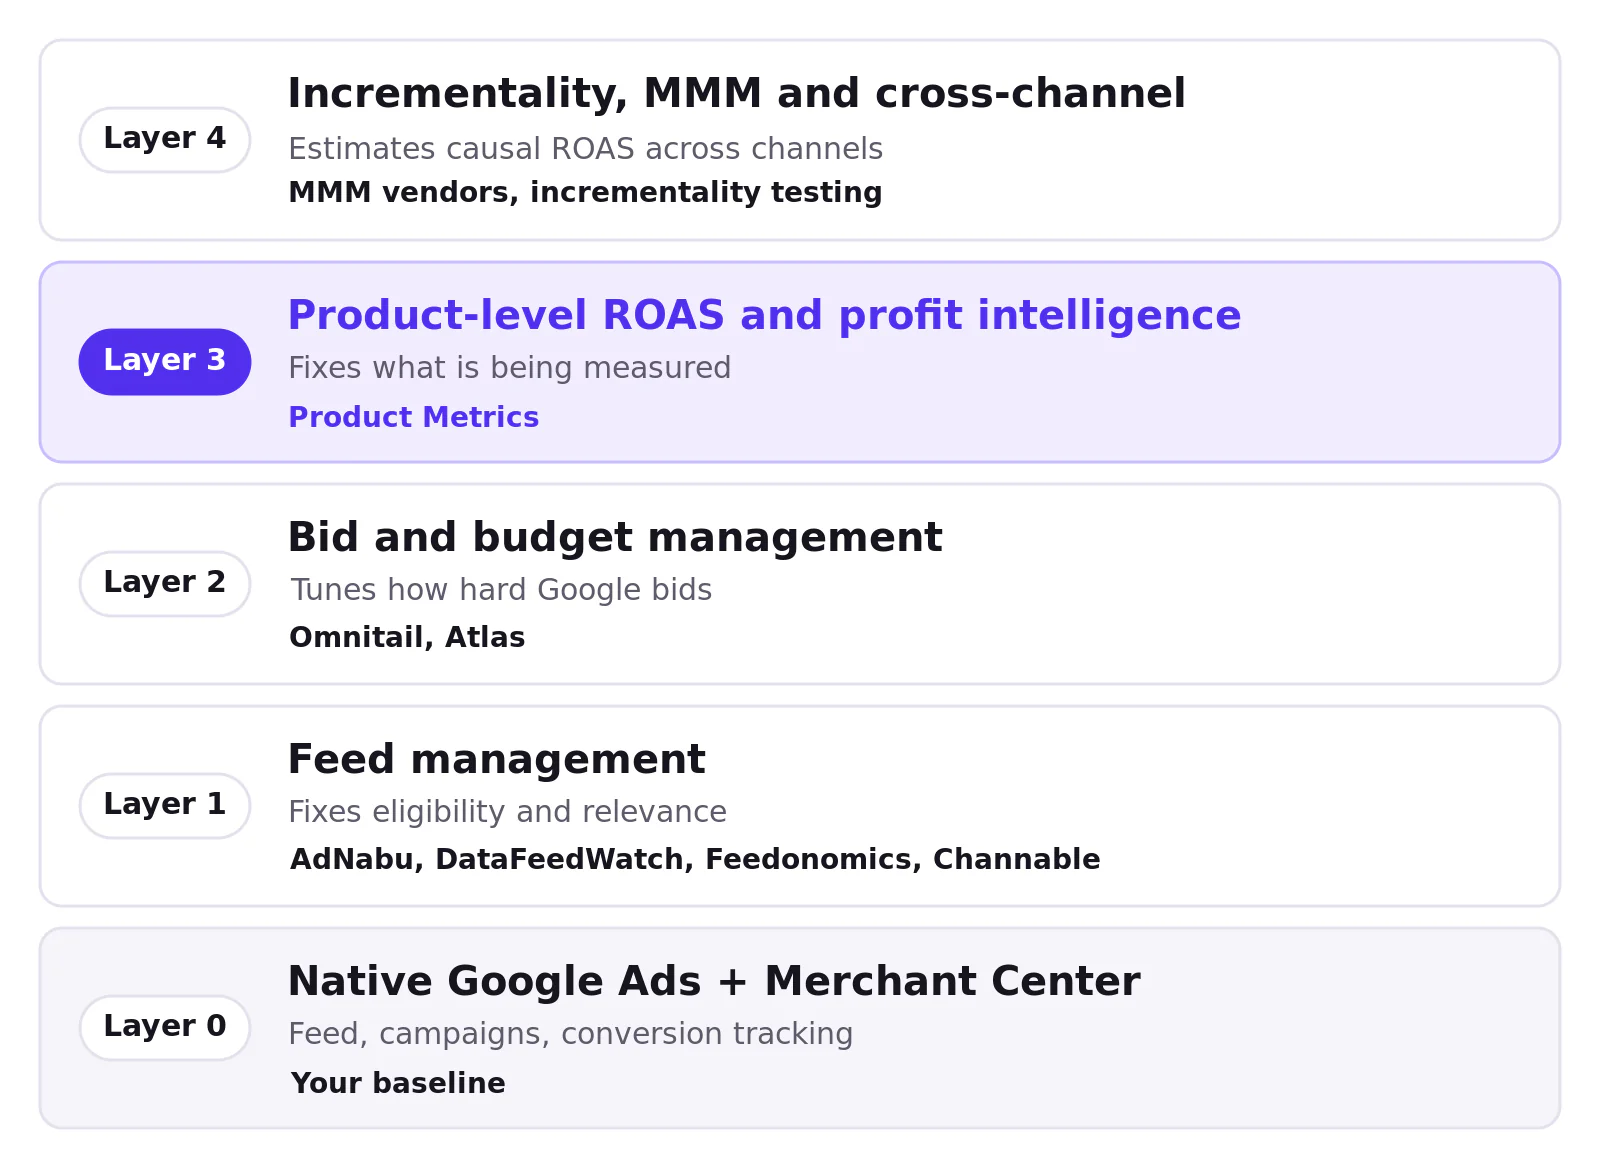
3.1 Layer 0 – Native Google Ads + Merchant Center
This is your baseline:
- Merchant Center product feed and optional structured data on product pages to keep Google’s understanding of prices, availability, and attributes in sync with your store. (Source: Google Search Central – Share your product data with Google)
- Shopping or Performance Max campaigns linked to Merchant Center for product listings. (Source: Google Ads Help – Choose the right campaign type)
- Conversion tracking implemented via the Google tag, Google Tag Manager, or the Google Ads API, with values for purchase actions driving ROAS and Smart Bidding. (Source: Google Ads Shopping Automation – Conversion tracking)
- Product-level reporting via Shopping Performance View or the Products tab, which aggregates metrics across all feed-based campaign types. (Source: Google Ads API – Product reporting for Shopping ads)
If this layer is misconfigured, no third-party platform can give you genuinely accurate or actionable ROAS.
3.2 Layer 1 – Feed Management and Google Shopping Optimization Software
These tools focus on eligibility, relevance, and consistency of your product data:
- Connect your ecommerce platform to Merchant Center.
- Generate feeds that comply with Google’s Product Data Specification.
- Enrich titles and descriptions, map attributes, and clean up disapprovals.
A 2026 overview of 16 Google Shopping optimization platforms highlights common capabilities: automated feed syncing, GTIN and taxonomy fixes, rule-based or AI title optimization, and multi-channel distribution (Google Shopping plus Meta, marketplaces, and affiliates) across tools such as AdNabu, DataFeedWatch, Feedonomics, Channable, Productsup, and GoDataFeed. (Source: AdNabu – Google Shopping optimization software guide)
Other examples of this category include Feedoptimise, NextFeed, Shoptimised, and FeedOptimizer.AI, all positioning around product feed management and optimization for Shopping and related channels. (Source: Feedoptimise, NextFeed, Shoptimised, FeedOptimizer.AI)
These platforms are often the best “first buy” if your disapprovals are high, your titles are weak, or your catalog complexity outstrips what you can safely manage in a spreadsheet.
3.3 Layer 2 – Bid and Budget Management - Shopping Management Tools
Where feed tools shape what Google can show, bid and budget tools shape how aggressively it shows those products.
At the native level, Google Ads offers target ROAS Smart Bidding, including within Shopping and Performance Max campaigns. Third-party providers build on top of this to:
- Adjust targets or budgets by product group or segment.
- Automate campaign structures (e.g., multi-tier Shopping, branded vs generic splits).
- Add their own performance rules on top of Google’s AI.
For example, some agencies and platforms describe automated bid management tools that continuously adjust bids and priorities for Shopping campaigns to maximize profit over time. (Source: Omnitail – Google Shopping management) Others position explicitly as “optimising the constraints around Google’s AI” for Performance Max and Shopping—tuning ROAS targets and blocking wasted spend rather than replacing Google’s own bidding algorithms. (Source: Atlas – Google Ads optimisation for PMax & Shopping)
These tools are most helpful when your feed is solid and tracking is trustworthy, but you need more granular control or scale than native levers comfortably provide.
3.4 Layer 3 – Product-Level ROAS and Profit Intelligence Platforms
This is where Product Metrics sits, together with a small group of profit-based tracking tools.
These platforms typically:
- Pull together Google Ads, GA4, pricing, inventory, returns, and margin data into a single workspace.
- Provide product-level views of clicks, revenue, and profit across Shopping and Performance Max.
- Push back profit-based conversion values to Google Ads and Meta and/or labels into Merchant Center to steer campaigns. (Source: Product Metrics homepage, Product Metrics vs ProfitMetrics comparison)
Product Metrics, for example:
- Uses machine learning to segment every product into six segments (Stars, Question Marks, Cash Cows, Dogs, Drainers, Ghosts) based on click volume and ROAS/POAS vs target.
- Surfaces product journeys, competitor prices, and stock for each SKU so you can see why a product is under- or over-performing before changing bids.
- Writes those segments back as Merchant Center custom labels that your Shopping and Performance Max campaigns can target differently.
- Offers a “Full Signal Tracking” module: first-party, server-side tracking designed to get conversions past ad blockers and tracking prevention and into Google Ads consistently. (Source: Product Metrics – Product-level Google Shopping optimisation, Product Metrics – ML product segmentation, Product Metrics – Full Signal Tracking)
These Google Shopping optimization platforms with advanced ROAS measurement don’t replace your feed tool or Google’s bidding; they make your measurement layer richer and more trustworthy, particularly at the product level.
3.5 Layer 4 – Incrementality - MMM and Cross-Channel Measurement
A final category—MMM vendors, incrementality testing platforms, and advanced analytics teams—sits above everything else, using aggregated data to estimate causal ROAS and media elasticities across channels. Academic and industry work on ROAS measurement increasingly emphasizes combining attribution metrics with MMM and incrementality tests to understand true marketing effectiveness. (Source: Wikipedia – Marketing effectiveness)
Most PPC teams don’t start here, but this layer is becoming standard for larger brands once the basics are in place.
4. Evaluating “ROAS Accuracy” Across Tools - A Five-Part Framework
When you shop for advanced ROAS optimization platforms for Google Shopping, nearly every vendor will promise “better ROAS” and “more accurate reporting”. Instead of comparing slogans, interrogate these five dimensions.
| Dimension | What it checks |
|---|---|
| Signal completeness | What fraction of real orders reach your advertising data |
| Value correctness | Gross revenue, net revenue or profit (POAS) |
| Attribution and scope | Which conversions the ROAS number includes |
| Product-level granularity | Whether insight and action reach single products |
| Freshness and explainability | How current the data is and why a recommendation was made |
4.1 Signal Completeness
Key questions:
- What fraction of real orders make it into my advertising data?
- Do they quantify expected loss from ad blockers and tracking prevention?
- Do they use first-party, server-side tracking or proxy endpoints to bypass common blockers, similar to Product Metrics’ Full Signal style endpoint? (Source: Product Metrics – Enhanced conversions vs server-side tracking)
- How do they interact with Google’s own enhanced conversions?
- Enhanced conversions attach hashed customer data (email, address, phone) to conversions your existing tag already reports, improving match rates but not fixing blocked requests. (Source: Product Metrics – Enhanced conversions vs server-side tracking)
- A serious vendor should explain where they sit relative to that feature.
Look for architecture diagrams and measurement experiments, not just “supports enhanced conversions” in a checklist.
4.2 Value Correctness
Ask how the platform handles value:
- Gross revenue vs net revenue vs profit (POAS). Does it ingest product cost, discounts, shipping, and returns to move beyond pure revenue-based ROAS?
- Per-product break-even ROAS. Does it help you calculate the minimum ROAS each product needs based on contribution margin, as in Product Metrics’ break-even calculators and guides? (Source: Product Metrics – Break-even ROAS per product)
- Customer lifetime value (LTV). Can it distinguish new vs returning customers and reflect that in reported values and bidding signals? Product Metrics, for instance, can send profit and customer-type values into Google Ads and Meta. (Source: Product Metrics homepage)
This is the core of why you might buy Google Shopping optimization platforms with real-time ROAS insights instead of just using native Google reports.
4.3 Attribution and Scope
Clarify what the ROAS number actually includes:
- Which conversion actions does the tool or tag treat as primary? Standard Google Ads guidance allows you to choose which conversions go into the main “Conversions” column that powers bidding and reporting. (Source: Google Ads Help – Different ways to track conversions)
- Are view-through conversions included? Only last-click purchases? Subscription renewals?
- How does the platform de-duplicate conversions between GA4, Google Ads direct tags, and server-side ingestion if you run all three?
Sophisticated buyers should expect a written explanation of the attribution model, not just a single ROAS number on a dashboard.
4.4 Product-Level Granularity and Controls
To improve account-level ROAS, you almost always have to act at the product level:
- Google now exposes product-level metrics (cost, conversions, revenue) across all feed-based campaign types via its Products tab and Shopping Performance View. (Source: Google Ads Help – About Product Reporting, Google Ads API – Product reporting)
- Product-level Google Shopping optimisation approaches, such as the one Product Metrics documents, emphasise segmenting products by break-even ROAS and then structuring campaigns and priorities around those segments. (Source: Product Metrics – How to optimise Google Shopping ads)
When you evaluate tools:
- Check whether they can surface ROAS/POAS, margin, and stock at the individual product level, not just by campaign or category.
- Confirm whether they can act on that insight: for example, by writing custom labels to Merchant Center so your Google Shopping structure can prioritise Stars, nurture Question Marks, and suppress Drainers.
4.5 Freshness Diagnostics and Explainability
Accurate ROAS isn’t just about correct math; it’s about operational usability:
- How often is data refreshed—near real-time, hourly, daily?
- Can you drill from an alarming account-level ROAS down to the ten products responsible?
- Does the platform expose diagnostics (e.g., which blocker setups are likely to be suppressing your Google tags, or where enhanced conversions coverage is low) the way Google itself does in its enhanced conversions diagnostics? (Source: Product Metrics – Enhanced conversions vs server-side tracking)
As a rule of thumb, if you can’t explain why a recommendation was made at the product level, it will be hard to defend that recommendation to finance.
5. Implementation Paths by Maturity
Different stacks make sense at different stages. Here’s how we see typical paths for PPC specialists and ecommerce teams.
| Stage | Typical store | First priority |
|---|---|---|
| Baseline | Single country, a few thousand SKUs | Harden feed, tracking and profit model |
| Growing | 5–50k SKUs, multi-country feeds | Feed optimization platform (Layer 1) |
| Scaling | 50k+ SKUs or significant PMax spend | Product-level ROAS/profit layer (Layer 3) |
| Advanced | Multi-channel teams with MMM | Clean product-level inputs for MMM |
5.1 Baseline - “Good Enough” Tracking No Specialist Tools Yet
Characteristics:
- Single-country store, a few thousand SKUs.
- Performance Max and/or one or two Shopping campaigns linked to Merchant Center.
- Google tag or GTM-based conversion tracking sending purchase values.
Priorities:
- Harden the baseline. Double-check feed correctness against Google’s Product Data Specification and add structured data to product pages so Google’s understanding of price and availability stays in sync. (Source: Google Merchant Center – Product data specification, Google Search Central – Share your product data)
- Get enhanced conversions working to improve match rates for the conversions you already send.
- Define a simple profit model: contribution margin per product line and a minimum acceptable ROAS.
At this stage, you probably don’t need to buy Google Shopping optimization platforms with precise ROAS tracking yet; the biggest wins are in hygiene.
5.2 Growing - Feed and Structure Complexity
Characteristics:
- 5–50k SKUs, multi-country feeds.
- Mix of standard Shopping and Performance Max, maybe experimenting with upcoming AI Max-style shopping features.
- Frequent disapprovals, incomplete attributes, and messy titles.
Priorities:
- Adopt a feed optimization platform from Layer 1 to keep your Merchant Center data healthy and compliant across markets.
- Tighten Shopping structure (e.g., bestsellers vs long tail, high vs low margin) using native product groups and custom labels.
- Continue to refine your margin and break-even ROAS model.
Here, Google Shopping optimization platforms with advanced ROAS measurement are often overkill unless you already see big gaps between reported and actual performance.
5.3 Scaling - ROAS Versus Profit and Signal Loss Become Visible
Characteristics:
- 50k+ SKUs or significant spend in PMax and Shopping.
- Finance is scrutinising channel profitability; differences between P&L and Google Ads ROAS are material.
- You have evidence (or suspicion) that ad blockers, tracking prevention, and misattributed journeys are distorting ROAS.
Priorities:
- Introduce a product-level ROAS/profit intelligence layer (Layer 3) to:
- Join together ad spend, revenue, margin, and returns per product.
- Segment products by break-even ROAS and actual ROAS/POAS.
- Push profit-based values and labels back into Google Ads.
- Move critical conversion tracking server-side to reduce signal loss from blockers and tracking prevention, in parallel with enhanced conversions. (Source: Product Metrics – Enhanced conversions vs server-side tracking)
- Refine campaign structures (separating Stars, Dogs, etc.) so budget allocation follows product economics.
This is the point where it’s rational to get recommendations for Google Shopping ROAS optimization software from peers and shortlists, because measurement accuracy is now the primary bottleneck.
5.4 Advanced - Incrementality and Portfolio Optimization
Characteristics:
- Multi-channel marketing teams running sizable budgets across search, social, and retail media.
- In-house analytics or external partners already working on MMM and incrementality.
Priorities:
- Supply clean, product-level profit and ROAS to your analytics partners so MMM and tests can use realistic inputs.
- Treat Shopping and PMax as part of an integrated portfolio, not an isolated channel.
- Phase in more sophisticated bidding strategies (e.g., profit-based tROAS, LTV-based values) as comfort grows.
At this level, your question isn’t “which is the best software for tracking and optimizing ROAS in Google Shopping?” so much as “which combination of tools gives us dependable product-level inputs into our broader effectiveness models?”
6. Where Product Metrics Fits in Your ROAS Stack
For transparency, here’s how Product Metrics aligns with the categories above.
6.1 What Product Metrics Does
Product Metrics describes itself as an “operating system of ecommerce” focused on maximising product performance and profit by:
- Connecting Google Ads, GA4, pricing, margin, inventory, and returns into one product-level workspace.
- Segmenting every product into six machine-learning-based segments (Stars, Question Marks, Cash Cows, Dogs, Drainers, Ghosts) using ad click volume and ROAS/POAS against your target.
- Surfacing product journeys, competitor pricing, and stock per SKU so you can see whether a low ROAS is a true loser or a cross-sell engine.
- Sending profit and customer-type values into Google Ads and Meta and writing segment labels back into Merchant Center. (Source: Product Metrics homepage, Product Metrics – Product Segmentation, Product Metrics – Google Shopping optimisation guide)
6.2 Full Signal Tracking - Addressing Signal Loss
On the tracking side, Product Metrics offers Full Signal Tracking, which:
- Uses a unique first-party endpoint on your own domain to receive conversion events, designed to be less visible to generic ad-block filter lists.
- Auto-rotates that endpoint path if it’s ever blocked, without requiring tag changes.
- Keeps click IDs and order IDs server-side so conversions several days after the click can still be matched.
In lab tests documented by Product Metrics, Full Signal-style first-party endpoints were reached in all tested ad-blocker setups, while standard Google tags were blocked in several of them. (Source: Product Metrics – Enhanced conversions vs server-side tracking, Product Metrics – Full Signal Tracking)
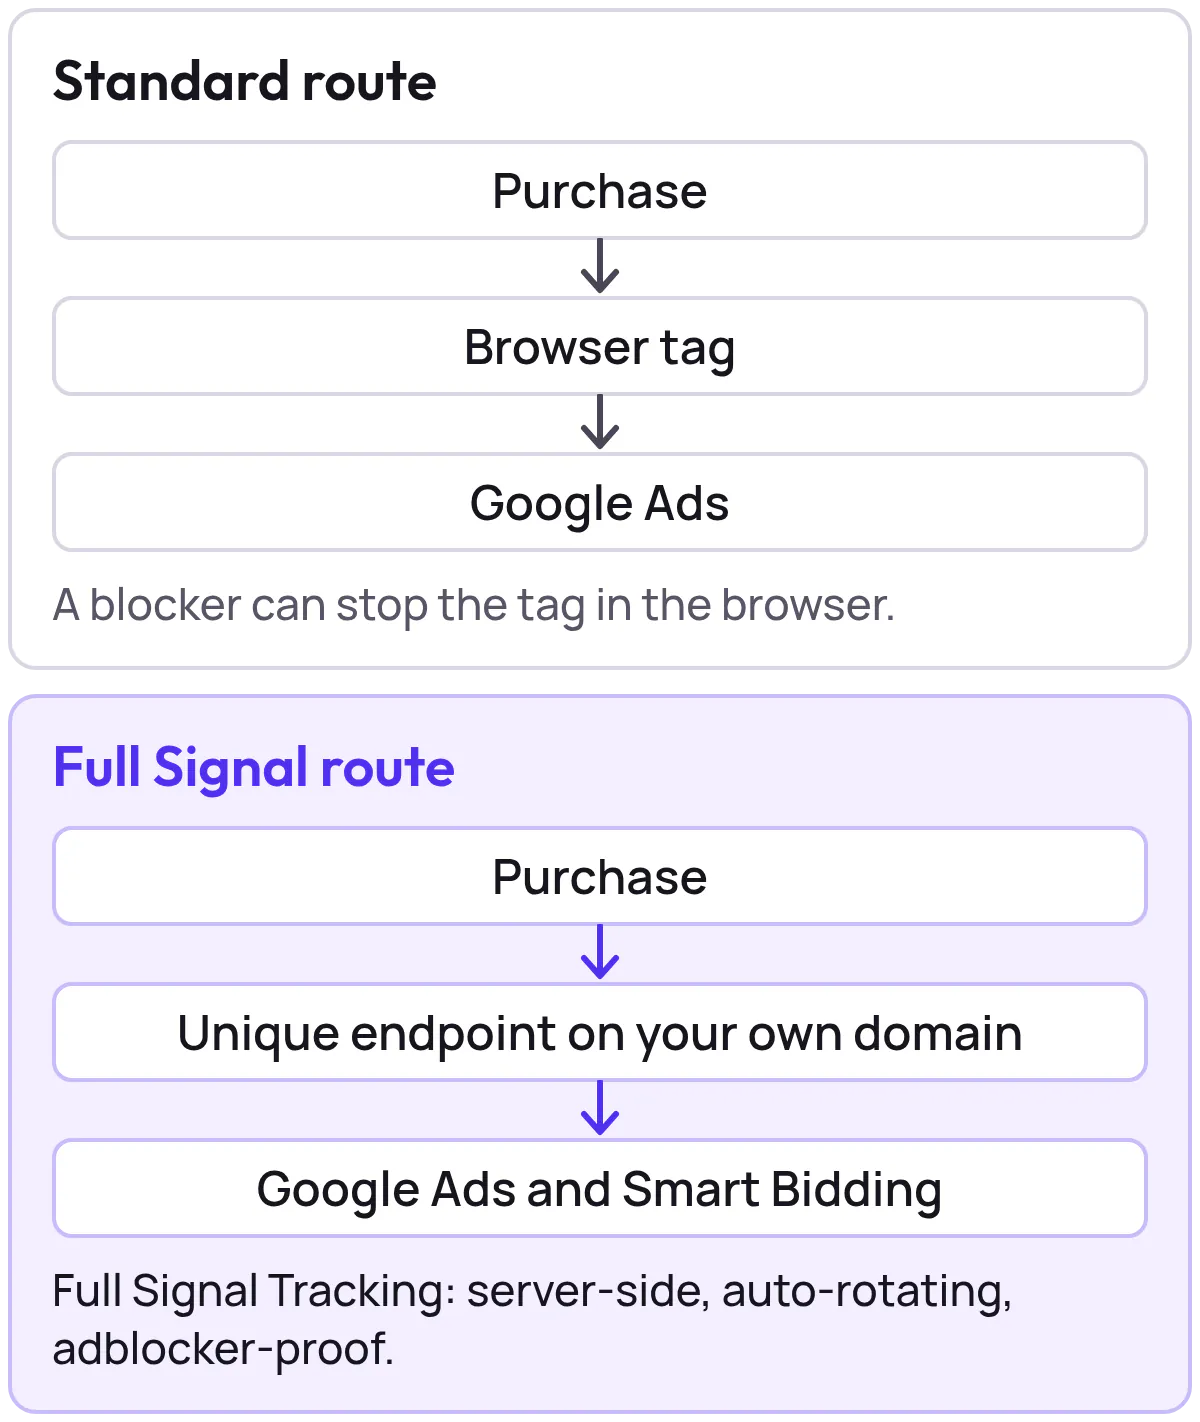
For teams whose biggest issue is “ROAS looks wrong because conversions never reach Google”, this sits exactly where a Google Shopping optimization platform with real-time ROAS insights should: at the intersection of measurement, product economics, and activation.
6.3 When Product Metrics Is and Isn’t the Right Fit
Product Metrics is a strong fit when:
- You run significant Shopping/PMax spend and already have a reasonably clean feed.
- You want to judge products against their own break-even ROAS and margin, not just account averages.
- You need to quantify and mitigate signal loss from blockers and tracking prevention, not just turn on enhanced conversions.
- You want actionable outputs (Merchant Center labels, profit-based conversion values) that plug back into your existing campaigns.
It’s less of a fit if:
- Your core problem is basic feed compliance (where a dedicated feed management tool is the natural first step).
- You’re still in the “single campaign, small catalog” phase where spreadsheet-level analysis is enough.
7. Turning This Into an RFP - Questions to Copy-Paste
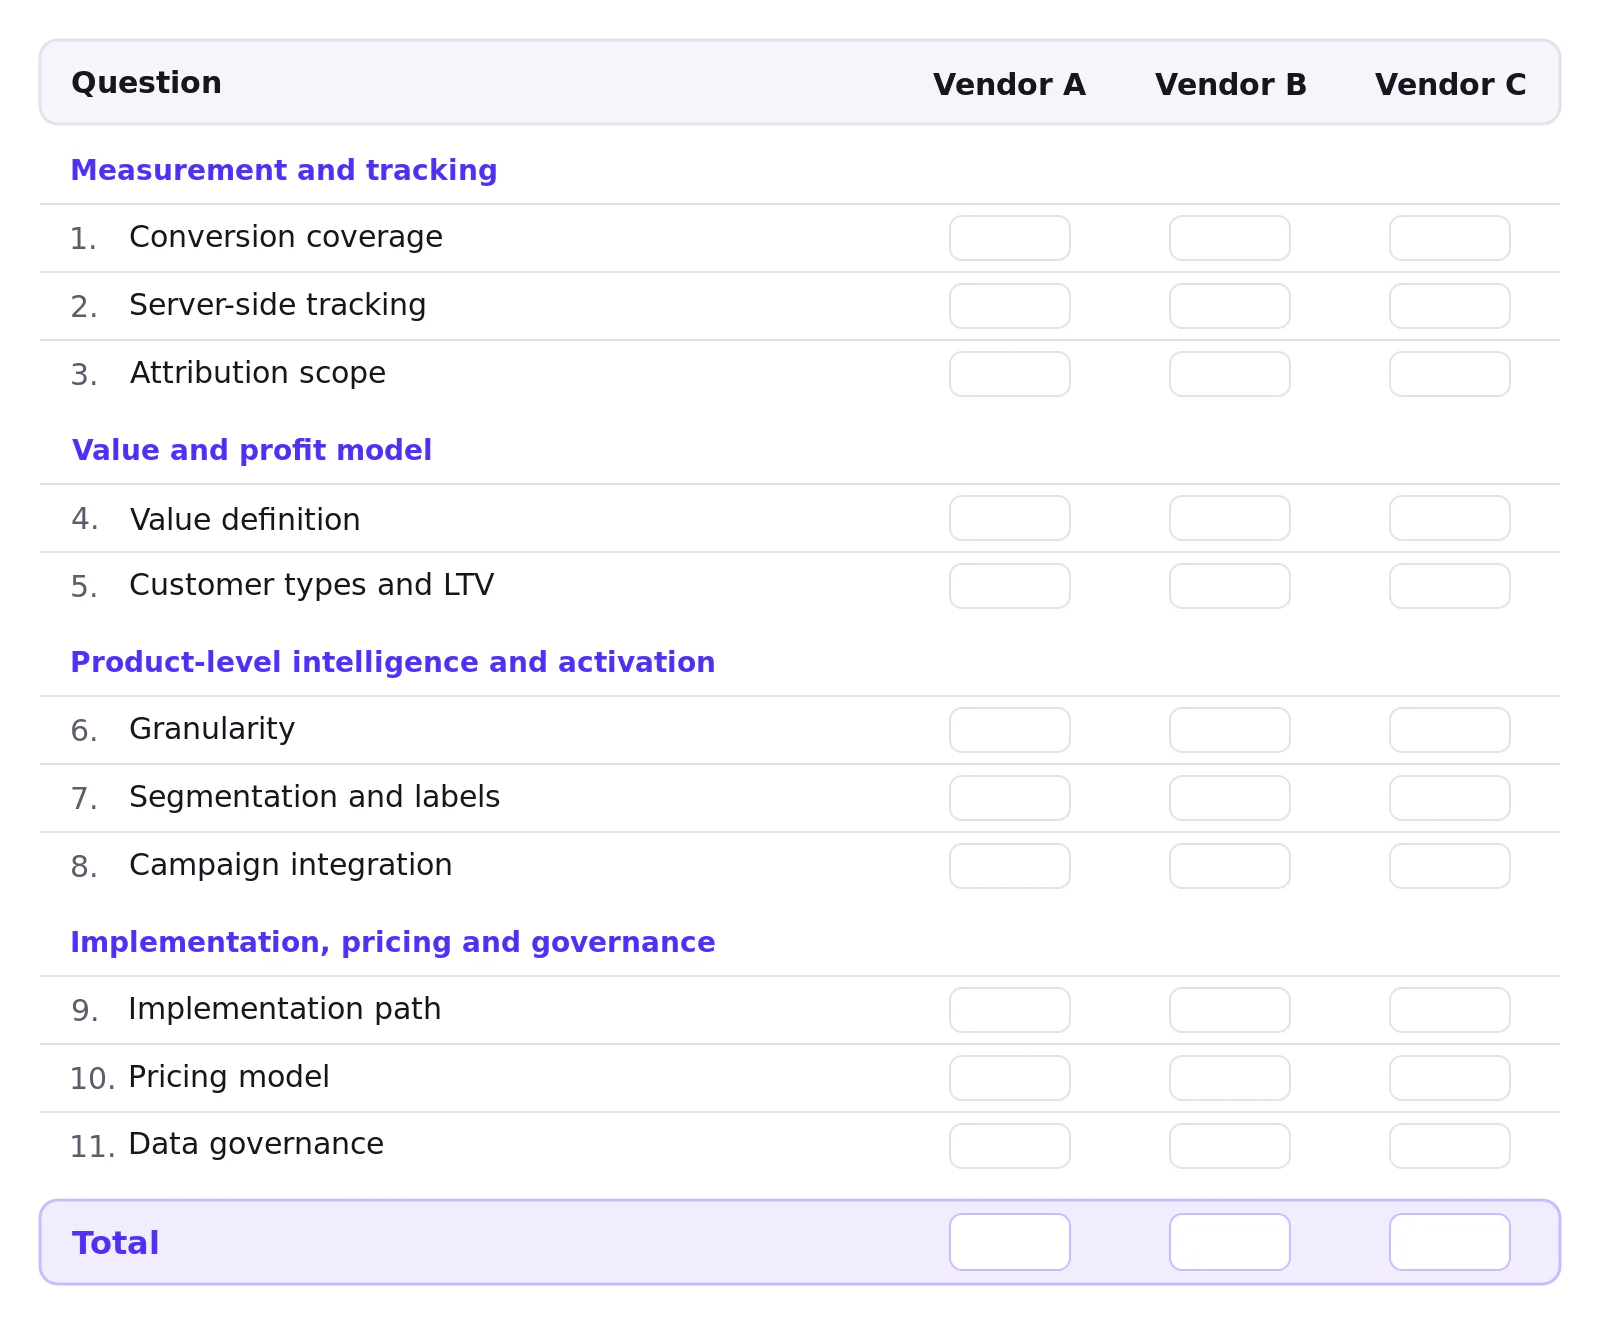
To help committees and procurement teams compare Google Shopping optimization platforms with advanced ROAS measurement, here’s a non-exhaustive checklist you can adapt.
7.1 Measurement and Tracking
- Conversion coverage
- What percentage of purchases do you estimate are missed by standard Google Ads tags in my vertical?
- How does your platform measure or model this loss?
- Server-side tracking
- Do you support first-party, server-side tracking for Google Ads (and/or GA4) similar to a Full Signal-style endpoint?
- How does this interact with enhanced conversions and Consent Mode?
- Attribution scope
- Which conversion actions are included in your ROAS numbers by default?
- Can we configure inclusion or exclusion (e.g., subscription renewals, phone orders, offline imports)?
7.2 Value and Profit Model
- Value definition
- Do you support net revenue (after discounts, tax, shipping) and profit-based metrics (POAS) as first-class citizens, not just custom fields?
- Can you calculate and surface per-product break-even ROAS based on margin inputs?
- Customer types and LTV
- Can you distinguish new vs returning customers and reflect them differently in reported ROAS and in values sent back to Google Ads and Meta?
7.3 Product-Level Intelligence and Activation
- Granularity
- At what level do you compute ROAS and POAS (product, product group, campaign)?
- Can we drill from account to product in a few clicks?
- Segmentation and Labels
- Do you provide automated product segmentation (e.g., Stars, Dogs, Ghosts) based on clicks and ROAS vs break-even?
- Can you write those segments back as Merchant Center custom labels without custom scripting?
- Campaign Integration
- How do your insights change what Google’s Shopping and Performance Max campaigns actually do (e.g., via labels, budgets, ROAS targets, exclusions)?
- Do you require us to abandon native bidding, or do you work alongside it?
7.4 Implementation Pricing and Governance
- Implementation path
- What is the typical implementation timeline for a store with X SKUs across Y countries?
- Which pieces require developer time vs self-serve setup?
- Pricing model
- Is pricing based on ad spend, SKU count, orders, or seats?
- How will costs scale if we double our catalog or our Shopping budget?
- Data governance
- Where is data stored, and how is it secured?
- Can we export raw product-level data for our own MMM or warehouse models?
Build these into a scoring sheet and you’ll quickly see which vendors are truly ROAS measurement platforms for Google Shopping and which are just wrapping standard Google Ads reports in a nicer UI.
8. Bringing It All Together
If you only remember three things from this buyer’s guide:
- ROAS is a measurement problem before it’s an optimization problem. Until you trust which conversions and values are making it into Google Ads—and how they relate to margins—feeding more data into more automation won’t reliably increase profit.
- Map tools to layers. Feed management platforms fix eligibility and relevance; bid tools tune how hard Google bids; product-level ROAS/profit intelligence platforms (like Product Metrics) fix what’s being measured and how it translates into budgets.
- Demand transparency. Any vendor claiming “advanced ROAS measurement” for Google Shopping should be able to walk you through their assumptions about tracking coverage, value calculation, attribution, and product-level segmentation.
Used this way, your next Google Shopping optimization platform with advanced ROAS measurement isn’t just another dashboard—it becomes a shared source of truth that your PPC team, finance, and leadership can all use to make smarter, faster decisions about where every incremental marketing dollar should go.
Written by
Berend Vrakking, Founder of Product Metrics
1M+ products analysed · Nominated at the Dutch Search Awards for Best Measurement Campaign (2023) and Best Use of Data (2024)
Keep reading.
Profit In Practice End-To-End COGS And Margin Integration For Google Shopping
How to collect COGS per product, model profit per order and send it to Google Ads as the conversion value, so Shopping and Performance Max bid on profit.
The Google Shopping Segmentation Playbook For 2026 Frameworks Labels And Structures
A feed-first Google Shopping segmentation playbook: custom labels, three campaign layers and new-customer bidding for Shopping and Performance Max.
Measuring Profit Segmentation In Google Shopping: Metrics, Tests And The Tools That Make It Work
Measuring profit segmentation in Google Shopping: four metric layers, a baseline test and product-level POAS show which segments make money.
See which of your products to push, fix or pause. Start with your own products, or a 30-second estimate.
Check one product first: work out its break-even ROAS in the calculator. Then see where all your products stand.
Questions, or want to spar about your products? Book a demo: a video call with Berend, then a demo account.