
How to optimise PPC campaigns: a margin-first playbook
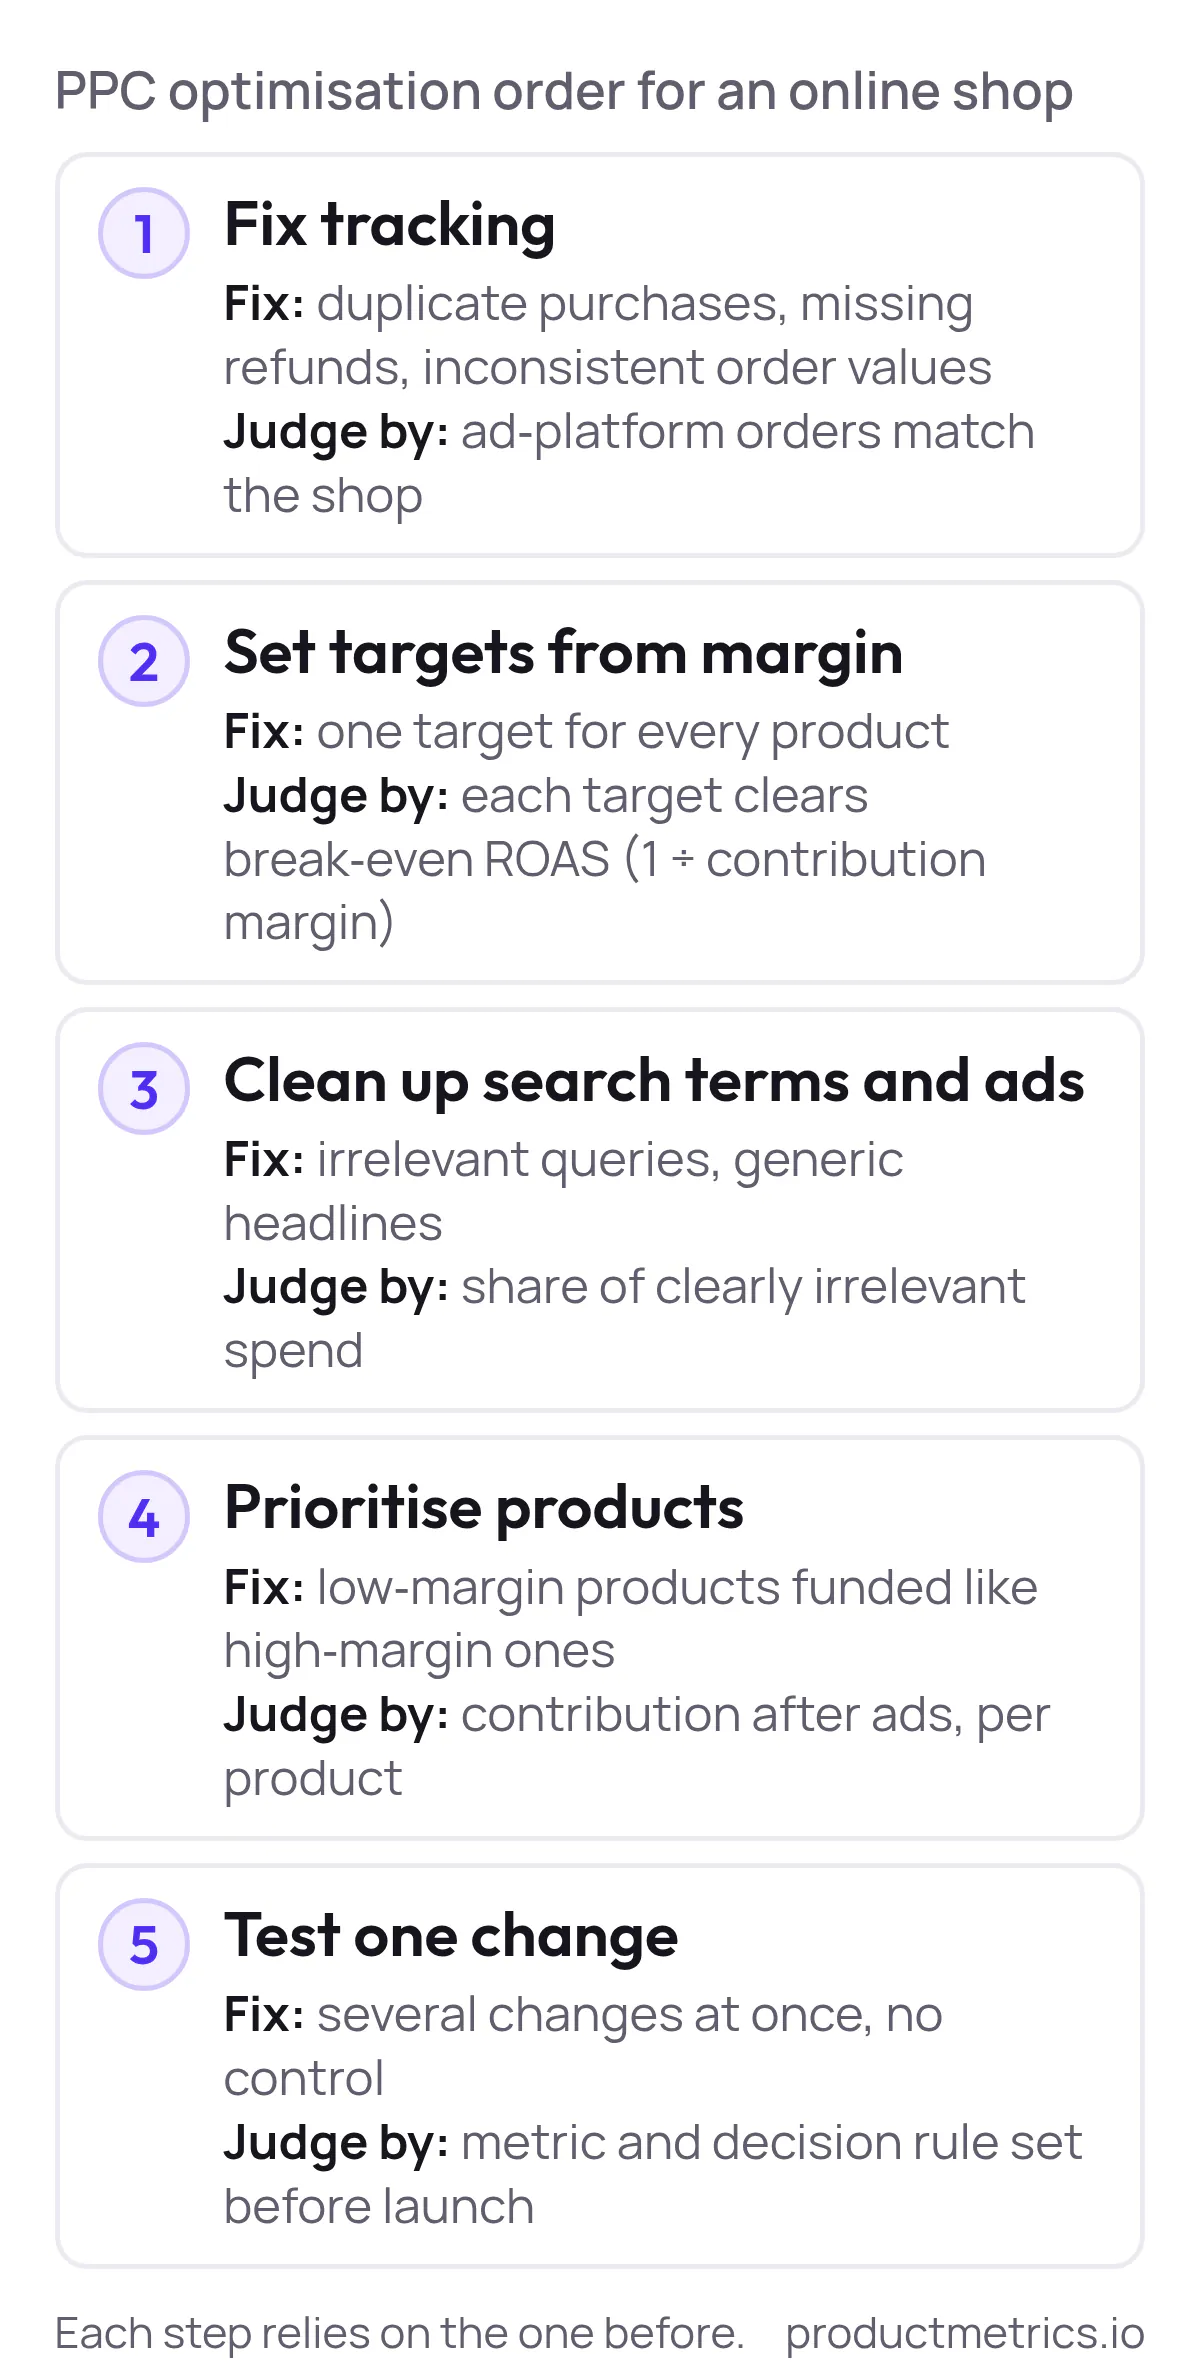
How to optimise PPC campaigns in order: fix tracking, set targets from margin, clean up search terms and ads, prioritise products, then test one change.
PPC optimisation is the work of changing tracking, targets, keywords, ads and product priority so each euro of ad spend returns more profit, not only more revenue.
For an online shop, I do it in a fixed order: tracking, margin targets, search terms and ads, products, then one test.
A click’s price says little on its own, so the order starts with what an order is worth.
The benchmarks come from WordStream’s public 2024 report and the targets from 1 ÷ margin arithmetic, so you can check every number.
Where do PPC campaigns lose money?
PPC campaigns lose money in four places: the auction, traffic quality, the site and product economics. A high cost per click (CPC) is only a problem when the other three can’t pay for it.
| Where money leaks | Question it answers | Check first |
|---|---|---|
| Auction | What does a click cost? | CPC, impression share |
| Traffic quality | Who clicks? | Search terms, click-through rate |
| Site | Do they buy? | Conversion rate, checkout, stock |
| Product economics | What does an order leave after costs? | Contribution margin, POAS |
In 2024, the average Google Ads CPC was $4.66 across industries, based on more than 17,000 campaigns from April 2023 to March 2024 analysed by WordStream. Its retail rows show why a cheap click is not a cheap sale:
| Category (WordStream, 2024) | Avg. CPC | Avg. conversion rate | Avg. cost per conversion |
|---|---|---|---|
| All industries | $4.66 | 6.96% | $66.69 |
| Shopping, Collectibles & Gifts | $2.61 | 3.49% | $42.10 |
| Sports & Recreation | $2.34 | 5.35% | $49.90 |
| Beauty & Personal Care | $3.56 | 8.01% | $48.42 |
| Apparel / Fashion & Jewelry | $3.39 | 3.33% | $83.10 |
| Furniture | $3.29 | 2.53% | $119.10 |
| Home & Home Improvement | $6.96 | 8.62% | $82.27 |
Five of the six retail categories pay a below-average CPC, yet two of them pay an above-average cost per conversion.
Furniture is the extreme: clicks cost 29% less than average and each conversion 79% more, because only 2.53% of clicks converted.

Show the dataHide the data
| Category | CPC, % of average | Cost per conversion, % of average |
|---|---|---|
| Shopping, Collectibles & Gifts | 56% | 63% |
| Sports & Recreation | 50% | 75% |
| Beauty & Personal Care | 76% | 73% |
| Apparel / Fashion & Jewelry | 73% | 125% |
| Furniture | 71% | 179% |
| Home & Home Improvement | 149% | 123% |
Treat these rows as context, not a target. Your own limit is the break-even CPC: contribution per order × conversion rate, the most a click can cost before the order loses money.
At €25 contribution per order, each extra percentage point of conversion rate lets a click cost €0.25 more.

Show the dataHide the data
| Conversion rate | Break-even CPC |
|---|---|
| 1% | €0.25 |
| 2% | €0.50 |
| 3% | €0.75 |
| 4% | €1.00 |
| 6% | €1.50 |
| 8% | €2.00 |
Which signals point to the cause?
The three Quality Score components and the pattern of CPC, click-through rate and conversion rate point to the cause. Quality Score is Google’s 1–10 keyword-level estimate of expected click-through rate, ad relevance and landing page experience (Google’s Quality Score documentation).
Google says it is not used at auction time to determine Ad Rank, so read it as a diagnostic, never as a KPI.
| Signal | Likely cause | Where to look first |
|---|---|---|
| Below average expected CTR | Offer or ad doesn’t attract clicks | Headlines, assets, price or offer |
| Below average ad relevance | Keyword intent and ad text don’t match | Ad groups that mix several intents |
| Below average landing page experience | Slow, off-topic or awkward page | Load speed, query–page match, mobile checkout |
| High CPC with normal CTR | Competitive auction | Auction insights, impression share |
| Healthy clicks, low conversion rate | Price, offer or funnel friction | Checkout, stock, shipping cost |
Treat each row as a hypothesis. A sold-out size or a surprise delivery charge explains a low conversion rate more often than the landing page design does.
Judge every fix on cost per conversion, revenue and contribution profit.
Campaign averages also hide products: two products with the same ROAS can earn opposite profit, which is why ROAS can hide profit differences.
Why fix conversion tracking before changing bids?
Fix conversion tracking first because Smart Bidding optimises towards whatever you count as a conversion. Each common fault teaches it the wrong lesson, and it then buys more traffic like it:
| Tracking fault | What Smart Bidding learns |
|---|---|
| A Google Ads purchase tag and an imported Google Analytics purchase are both primary | Every order is worth twice its value |
| Refunds and cancellations never reach Google Ads | A returned order was a sale |
| Purchases lost to consent or ad blockers | Products that sell look weak |
| Some order values include VAT or shipping, others don’t | Values that can’t be compared |
- Find the conversion action bidding usesCheck which purchase actions are primary. Exactly one of them should count each order.
- Test real purchases end to endCheck consent mode, enhanced conversions or server-side delivery, and the transaction ID on real orders across devices and payment methods, not only in tag preview.
- Reconcile values with the backendCompare currency, discounts, cancellations and refunds with your shop's orders. A correct purchase count says nothing about whether its value is usable.
- Keep one optimisation eventDon't switch the conversion action while you judge performance, and log every tracking change so nobody mistakes a measurement fix for a sales gain.
- Compare attribution over complete windowsCompare data-driven and last-click views only once the conversion window has closed, and read the conversion paths rather than the final click alone.
Ad platform and shop reports rarely match exactly. Allow for reporting delay and attribution, but explain any material gap before you touch a target.
The full checklist is in Google Ads optimisation for Shopping and Performance Max.
Our guide to Google Ads conversion tracking and ad blockers separates enhanced conversions from server-side delivery. Neither replaces consent checks, correct order values or deduplication.
If purchases go missing in browsers with blockers, run the ad blocker conversion tracking check.
How much data does attribution need?
For data-driven attribution, Google recommends at least 200 conversions and 2,000 ad interactions within 30 days in supported networks. Below that, small differences between attribution models are noise, not instructions for moving budget.
A campaign can look weak on last click because it introduces shoppers who come back through another channel. Another looks strong because it takes the final click after other marketing did the work.
Google Ads attribution reports show those conversion paths, such as a keyword that assisted a conversion another keyword closed.
Attribution assigns credit, though, not cause: incrementality testing tells you whether the sales would have happened without the ads.
An incomplete profit value steers worse than an accurate revenue value, so pick the conversion value by what your data covers:
| Value sent | Leaves out | Bid on it when |
|---|---|---|
| Revenue | Every cost | Margin data is incomplete; apply margin through product grouping |
| Gross profit | Shipping, payment fees, discounts, returns | Those costs are similar across products |
| Contribution profit | No variable cost, if complete | Margin, shipping, discounts, cancellations and returns are all in it |
How do you set PPC targets from margin?
Set PPC targets from contribution margin, not from the sales price: break-even ROAS is 1 ÷ contribution margin, and the ROAS that keeps a profit is 1 ÷ (contribution margin − the share of revenue you want to keep).
Count product cost, fulfilment, payment fees, discounts and expected returns, with revenue and costs both excl. VAT. Your maximum affordable CPA is the contribution per order minus the profit you want to keep.
For example, a product with a 25% contribution margin breaks even at a ROAS of 4. To keep 10% of revenue after ads it needs 1 ÷ (0.25 − 0.10) = 6.67, a target ROAS of 667%.

Show the dataHide the data
| Contribution margin | Break-even ROAS | ROAS to keep 10% of revenue |
|---|---|---|
| 20% | 5 | 10 |
| 25% | 4 | 6.67 |
| 30% | 3.33 | 5 |
| 35% | 2.86 | 4 |
| 40% | 2.5 | 3.33 |
| 50% | 2 | 2.5 |
The thinner the margin, the faster the required ROAS climbs: from a 40% to a 20% margin, break-even ROAS doubles from 2.5 to 5. That is why one account-wide target funds the low-margin products.
Check your own products in the break-even ROAS calculator, and agree the cost definition first: no calculator corrects a margin that leaves out returns.
At break-even
At break-even: ROAS 4 matches the 4 you need. After ads you keep €0.00 of every €100 of revenue.
- Contribution margin
- 25.0%
- €25.00 per order
- Break-even ROAS
- 4
- 1 ÷ margin
- POAS
- 1
- ROAS × margin. 1 is break-even.
- Left per €100 of revenue after ads
- €0.00
- Target ROAS for the profit to keep
- 666.67%
- The economic ROAS threshold for keeping 10% of revenue after ads is 666.67%. A bidding target does not guarantee that outcome; compare achieved return on the same revenue and cost basis.
Illustrative data: €100.00 excl. VAT, €55.00 cost of goods, €20.00 other variable costs, a current ROAS of 4 and 10% of revenue kept.
Per order, excl. VAT. For several products or VAT, use the break-even ROAS calculator.
How to set a target ROAS from your margin covers margin bands and how to move a target without unsettling the bid strategy.
What does the same ROAS earn on different margins?
The same ROAS earns a loss on a low-margin product and a profit on a high-margin one.
POAS (profit on ad spend) is ROAS × contribution margin, and break-even POAS is 1.
At a ROAS of 4, the 25% product from the target example sits exactly at 1, so any lower margin loses money.

Show the dataHide the data
| Contribution margin | POAS at a ROAS of 4 |
|---|---|
| 20% | 0.8 |
| 25% | 1 |
| 30% | 1.2 |
| 40% | 1.6 |
| 50% | 2 |
Google Ads reports gross profit for conversions with cart data (revenue minus cost of goods sold), but it has no POAS bid strategy. Maximise conversion value with a target ROAS steers on whatever value you send.
In Performance Max, the optional ROAS or CPA target belongs to the campaign (Google’s overview of Performance Max):
| Level | Own ROAS or CPA target | Own budget | What it does |
|---|---|---|---|
| Campaign | Yes, optional | Yes | Sets the goal for every product in it |
| Asset group | No | No | Selects products and pairs them with assets |
| Custom label | No | No | Includes, excludes or groups products |
Products that need very different targets need separate campaigns. Each split thins the conversion data per campaign, so split on large margin gaps only.
Stock limits the target too. When replenishment won’t arrive before demand empties the shelf, lower the product’s priority or exclude it rather than selling what you can’t deliver.
How do you match keywords, search terms and ads to intent?
Match intent by reviewing search terms on a fixed routine, excluding only intent you are sure you can’t serve, and writing each ad group’s headlines around the need its queries share.
A query with no recorded purchase may be irrelevant, too recent or too rarely seen to judge.
How do you review search terms without cutting profitable demand?
Review search terms by tagging each one as converting, wasteful or unclear, and act only on the first two. Here is what that looks like for a shop selling waterproof footwear (illustrative queries):
| Tag | What it means | Example query | Action |
|---|---|---|---|
| Converting | Sales at or under the CPA limit | womens waterproof trail shoes | Keep; consider exact or phrase match |
| Wasteful | Intent you can’t serve | boot repair near me | Negative at the narrowest level |
| Unclear | Plausible intent, too few clicks | best waterproof walking shoes | Wait for more clicks and conversions |
The routine behind the tags:
| Step | Rule |
|---|---|
| Export a long enough window | Leave out the last days, whose purchases haven’t arrived yet |
| Add negatives at the narrowest level | Shared lists for account-wide exclusions, campaign negatives for offer-specific ones |
| Split ad groups by buying intent | Keep queries together when one ad and one landing page answer them all |
| Review match types against outcomes | Keep broad match only where conversion data supports it |
| Promote proven queries | Exact or phrase match gives clearer copy and spend control; neither limits matching to the literal query |
| Repeat on a schedule and log changes | Check that last week’s negatives didn’t remove this week’s profitable demand |
Keep “best” and “reviews” queries even before they sell: those shoppers are still choosing which product to buy.
A high-spend query isn’t automatically wasteful either: check whether its orders clear the contribution limit and whether the landing page matches it.
Judge the cleanup by a shrinking share of clearly irrelevant spend over completed conversion windows, not by a lower CPC. A narrower traffic mix can cost more per click and still bring better orders.
How do you write ads that match search intent?
Write ads that name the need the ad group’s queries share, then give distinct, true reasons to choose you.
Say a shop sees strong demand for waterproof trail running shoes for women, but its ads lead with brand slogans:
| Headline role | Generic headline | Intent-matched headline |
|---|---|---|
| Product need | Shop Our New Collection | Women’s Waterproof Trail Shoes |
| Reason to choose | Quality You Can Trust | Sizes 36–43, Fully Waterproof |
| Delivery | Great Deals Every Day | Order by 22:00, Here Tomorrow |
Each illustrative headline fits the 30-character limit for responsive search ad headlines. The landing page should keep the same promise in its heading, filters, available sizes and delivery information.
Responsive search ads and Performance Max combine your headlines and descriptions, so each asset has to read well next to any other:
| Do | Don’t |
|---|---|
| Give distinct reasons: price, delivery, returns, materials or range | Repeat one benefit in three wordings |
| Say “water-resistant” when that is what the product is | Promise waterproof |
| Send the click to a filtered category | Send it to an unfiltered footwear category |
| Pin only a message that must sit in a fixed position | Pin lines by habit: every pin cuts the combinations |
Read asset ratings alongside sales: a rating doesn’t prove a line caused profitable orders.
Test one messaging idea with a fixed asset set, not while also changing the landing page and the offer.
How do you prioritise products in Shopping and Performance Max?
Prioritise products by two numbers, ad clicks and return against the product’s own ROAS or POAS target, then write the result to a Merchant Center custom label (custom_label_0 to custom_label_4) your campaigns can split on.
Classify each product against its own economics, not one revenue threshold for every product, as in judging ecommerce PPC by product profit. Then check stock and merchandising before you settle the action.
| Segment | Ad clicks | Return vs target | Typical action |
|---|---|---|---|
| Stars | High | Above target | Increase priority, scale with care |
| Question Marks | High | Just under target | Test price, title and image |
| Cash Cows | Low | Above target | Protect and grow reach |
| Dogs | High | Below target | Lower priority or fix the page |
| Drainers | Low | No return | Exclude or pause |
| Ghosts | No impressions | Nothing to measure | Check feed, eligibility and disapprovals |
A Star deserves room to grow, not an unlimited budget. Lowering its return target buys reach at lower efficiency, so watch total contribution after ads rather than volume.
Before you give a Ghost more budget, check its title and whether anyone searches for the product at all.
The labels are only as good as the margin, return and stock data behind them.
A stale stock feed can keep a sold-out product in a scale segment while its ad data still looks excellent. Give the label definitions an owner and a rule for missing inputs.
Doing this by hand means a spreadsheet per product, rebuilt every week from Google Ads, Merchant Center, your margins and your stock, which stops scaling at a few hundred products.
How do Product Metrics labels work?
Product Metrics labels work in two steps: Product Segmentation segments every product into the six segments above with Product Metrics ML, then product rules write labels to your Merchant Center supplemental feed.
Segmentation runs on ROAS straight away, or on POAS once you connect margins. You split campaigns or asset groups on those labels and set targets and budgets yourself.
For example, the Promote Star candidates rule sets custom_label_0 to star_candidate when all three example conditions hold:
| Condition | Example threshold |
|---|---|
| POAS | At least 1.4 |
| Margin | At least 40% |
| Stock cover | Over 8 weeks |
A label doesn’t set a bid by itself. Campaign structure by profit covers where a separate campaign is worth the thinner data.
How do you test a change before scaling it?
Test one change in a Google Ads experiment with a written hypothesis and decision rule, then roll it out only to the products it was proven on.
A rising trend alone can be seasonality, conversion delay or the bid strategy still learning.
Google’s experiment guidance asks for a hypothesis, one variable at a time, one or two success metrics picked before the test begins, no edits to the base campaign unless sync is on, and a record of every test.
Write the protocol down before you touch a setting:
| Element | What to write down | Example |
|---|---|---|
| Hypothesis | The change and its expected effect | Intent-matched headlines lift conversion value |
| Variable | The one thing that differs | Headlines in one asset set |
| Success metrics | One or two, chosen up front | Conversion value, CPA |
| Guardrails | Limits that end the test early | CPA above the product’s limit |
| Duration | End date, including conversion delay | Fixed before launch |
| Decision rule | The result that triggers rollout | Value up, CPA within limit |
Don’t stop early because one arm leads, and don’t edit the tested assets mid-test. Read completed cohorts only, and check that a significant result is also worth enough money to implement.
Once a change wins, apply it only to the product group it was tested on, such as Stars or stock-limited items.
Final thoughts
A cheap click and a healthy campaign ROAS are both averages, and averages are where PPC accounts hide their losses.
The fix is to judge each click, query and product against what its order leaves after costs.
Start this week with one campaign: check its purchase signal, set its target from margin, and change one thing, with a named owner and a written decision rule.
If you want a broader account review before you start, Amax Marketing’s checklist shows how to improve Google Ads with Amax Marketing by checking account weaknesses before making isolated bid changes.
When your ad reports and your order economics disagree, AdCrafty’s margin-analysis guide can help you identify hidden costs behind healthy ROAS.
If you draft headline variations with AI, CreativeClaw’s guide to create ad variations with AI covers the workflow. Give the tool verified product facts and banned claims, then edit every line before it goes live.
Written by
Berend Vrakking, Founder of Product Metrics
1M+ products analysed · Nominated at the Dutch Search Awards for Best Measurement Campaign (2023) and Best Use of Data (2024)
Keep reading.
POAS In The Real World Passing Profit, Composing Conversion Value, And Bidding With Confidence
POAS in the real world passing profit to Google Ads: what to send as conversion value, which costs to include, how to keep margins private and test it.
Google Ads Match Types: Broad, Phrase and Exact Compared
Google Ads match types compared: what broad, phrase and exact let through, how close variants work and which one pays at your margin.
Ecommerce PPC: costs, metrics and a profit-first strategy
Ecommerce PPC judged by profit: what a click can cost, each product's break-even ROAS, and how to act on it in Google Shopping and Performance Max.
Frequently asked questions.
How often should you optimise a PPC campaign?
Should you optimise PPC campaigns for target ROAS or target CPA?
What is a good ROAS for a PPC campaign?
See which of your products to push, fix or pause. Start with your own products, or a 30-second estimate.
Check one product first: work out its break-even ROAS in the calculator. Then see where all your products stand.
Questions, or want to spar about your products? Book a demo: a video call with Berend, then a demo account.