
Profit In Practice End-To-End COGS And Margin Integration For Google Shopping
How to collect COGS per product, model profit per order and send it to Google Ads as the conversion value, so Shopping and Performance Max bid on profit.
If you’re still optimizing Google Shopping on revenue and ROAS alone, you’re flying blind.
In a world of rising acquisition costs, discount-heavy promotions, and wildly different margins across SKUs, revenue-based ROAS tells you where money came in — not whether any stayed behind as profit.
This guide gives you a practitioner-grade blueprint to collect, model, and activate COGS and margin data end-to-end so you can:
- Track true gross profit per order, not just revenue
- Optimize Shopping and Performance Max toward profit (POAS), not ROAS
- Fix reporting distortions from returns, cancellations, and discounts
- Answer all those hard questions like:
- How to integrate COGS and margin tracking with Google Shopping?
- How to track margins effectively in Google Shopping?
- How to improve Google Shopping ROI with margin tracking?
1. Why Revenue-Based ROAS Breaks Down In Google Shopping
Google Shopping is great at showing you which products generate revenue. But several structural realities make raw revenue a poor optimization signal:
-
Margin variance across the catalog
A $100 sale at 15% margin is not the same as a $100 sale at 60% margin. Revenue-based ROAS treats them identically. -
Multi-item baskets
A user might click on Product A (mid-margin) and then buy Products B and C (high-margin). If you only look at revenue on the clicked product, you under- or overvalue that traffic. -
Promotions, discounts, and fees
20% off sales, coupons, and payment or marketplace fees can erase margin even when ROAS looks exceptional. -
Returns and cancellations
Revenue-based tracking usually counts the initial sale but rarely subtracts returns cleanly. Your ROAS stays inflated long after the cash went back to the customer.

Show the dataHide the data
| Sale | Revenue | Gross profit |
|---|---|---|
| $100 sale at 15% margin | $100 | $15 |
| $100 sale at 60% margin | $100 | $60 |
To get Google to optimize for actual business outcomes, you need to upgrade from ROAS (revenue on ad spend) to POAS (profit on ad spend) — and that means integrating COGS and margin deeply into your Shopping and Google Ads stack.
2. Step 1 - Define The Profit Metric You Want Google To Optimize
Before you touch feeds or tags, get crystal clear on what “profit” means in your context. Your definition drives every downstream modeling and integration decision.
2.1 Choose Your Optimization Metric
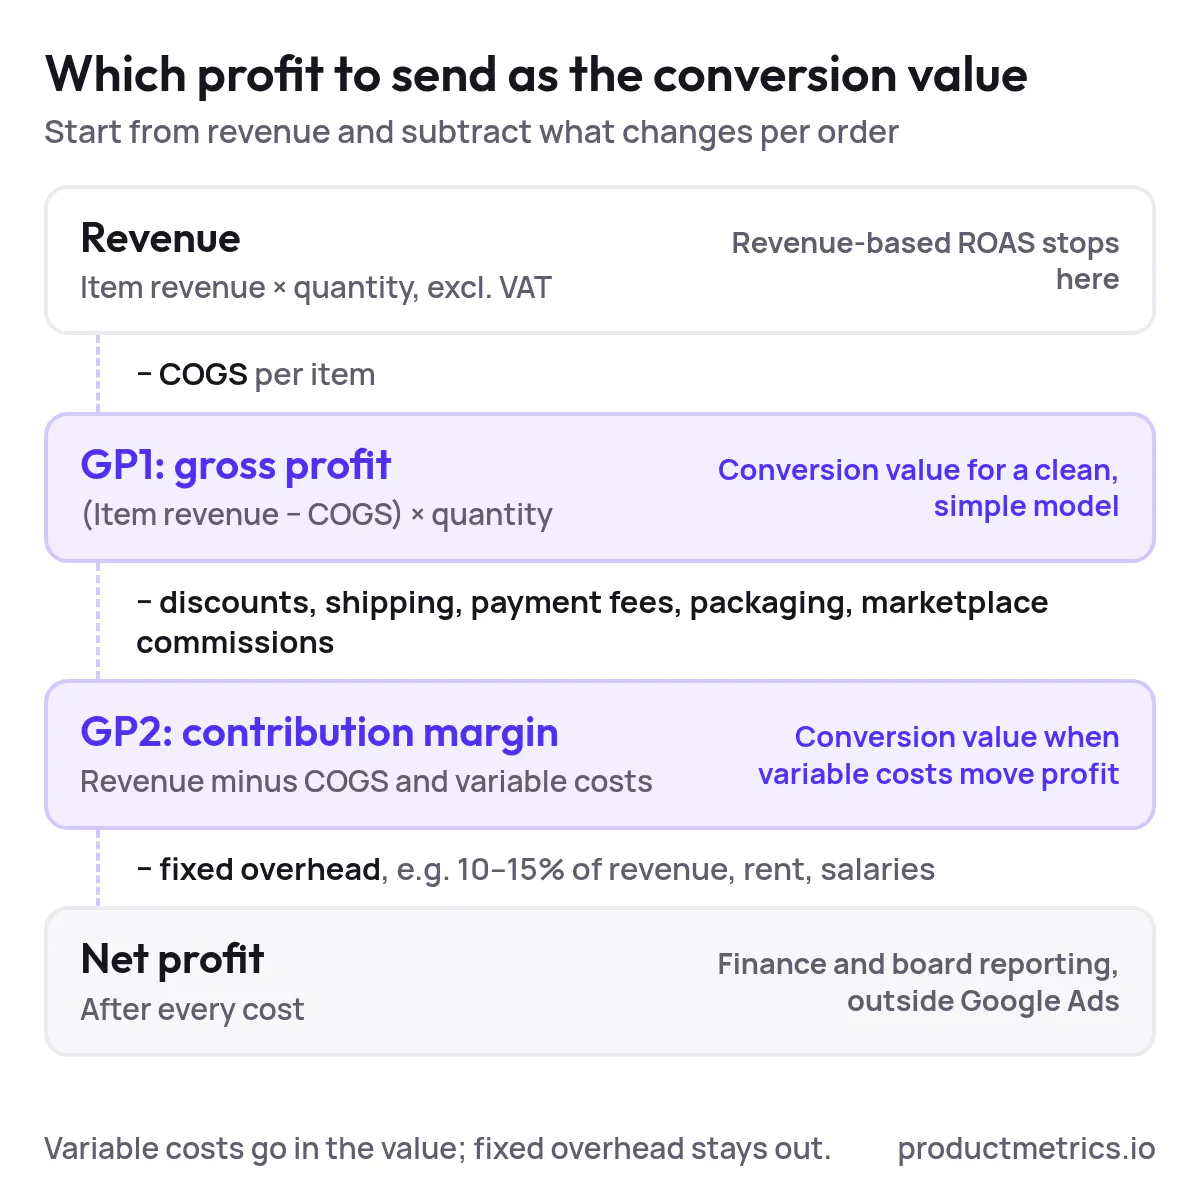
For most ecommerce advertisers, you’ll choose one of these as the conversion value you send to Google Ads:
-
Gross profit per order (GP1)
Formula (per line item):Gross profit = (Item revenue - COGS) × QuantityRoll this up to the order level by summing across all items.
-
Contribution margin including variable costs (GP2)
Here you also subtract variable costs like shipping, payment fees, packaging, and marketplace commissions:Contribution margin = Revenue - COGS - Discounts - Shipping costs - Payment fees - Packaging/handling -
Net profit proxy
Some brands also subtract a standard overhead allocation (e.g., 10–15% of revenue) if they want to optimize closer to true net profit.
Recommendation:
- Use gross profit (GP1) if you want a clean, simple model and your variable costs are relatively flat.
- Use contribution margin (GP2) if shipping, transaction fees, or marketplace commissions significantly affect profitability and you want your POAS targets to reflect that reality.
2.2 Decide What Not To Include
Don’t try to cram everything into the conversion value. As a rule of thumb:
- Include anything that varies by order or product (COGS, discounts, shipping, fees) so Google sees the true incrementality of each click.
- Exclude fixed overhead (office rent, salary for the CEO) from the Google Ads conversion value, and handle that in your financial modeling outside of Ads.
This keeps the signal both accurate and stable enough for Smart Bidding to work with.
3. Step 2 - Collect COGS And Margin Data At The Product Level
Once you know what profit metric you want, you need reliable product-level COGS and related cost data.
3.1 Define Your Data Sources
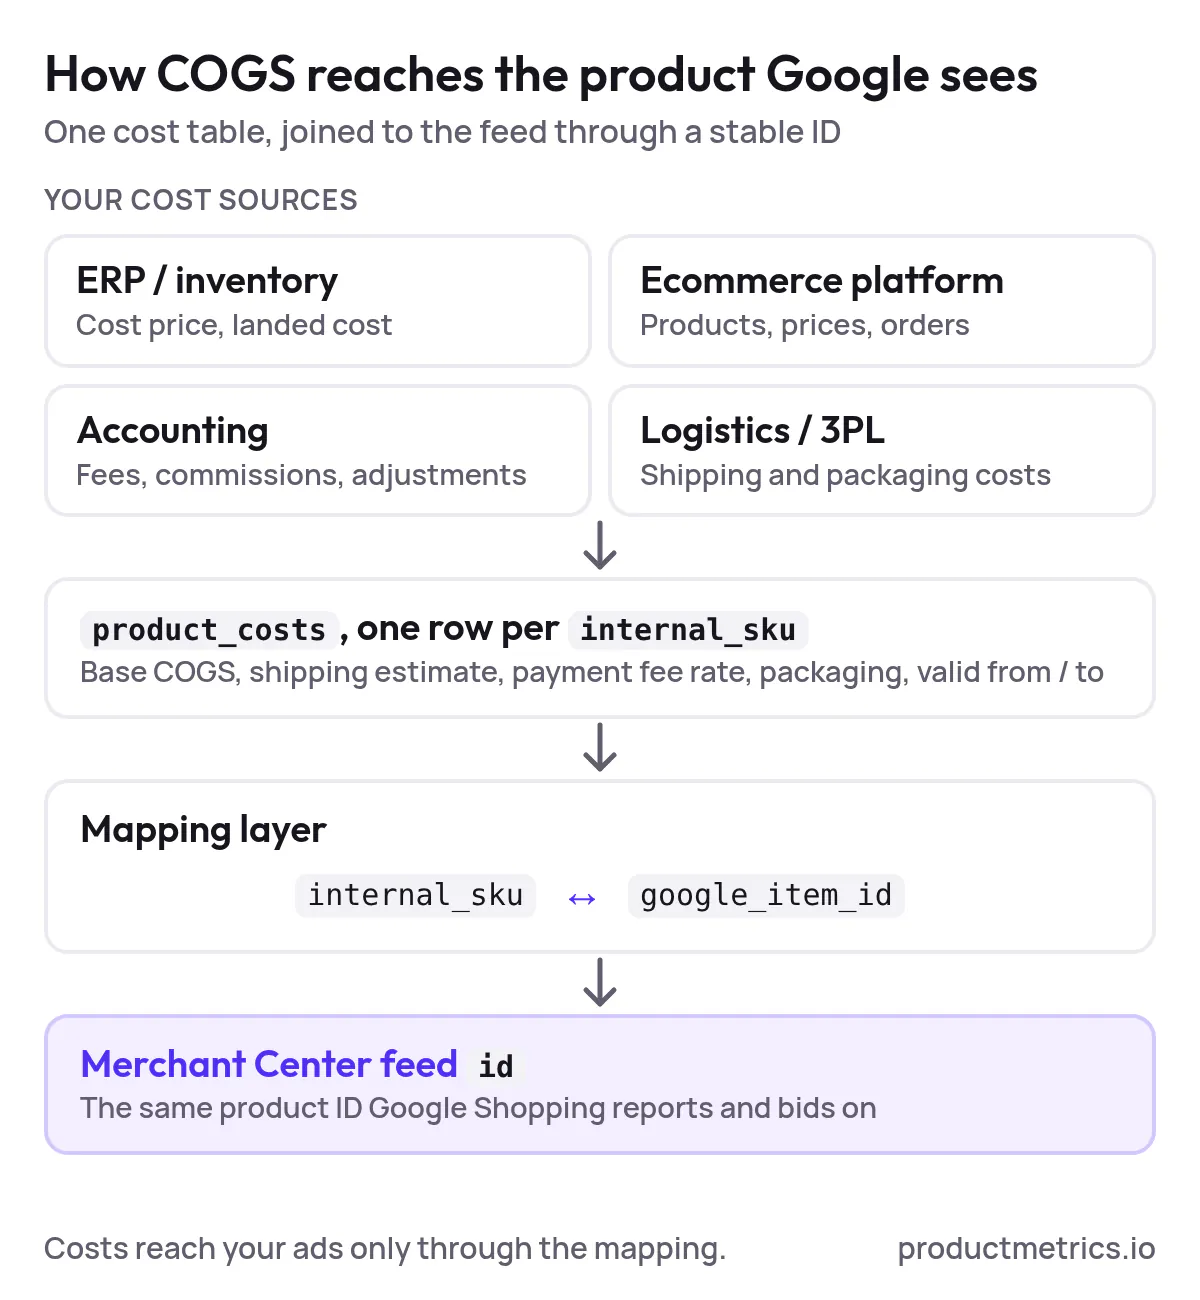
Typical COGS inputs live in one or more of:
- ERP / inventory system (e.g., cost price, landed cost, supplier info)
- Ecommerce platform (Shopify, Magento, BigCommerce, custom)
- Accounting platform (for fees, commissions, and adjustments)
- Logistics / 3PL system (shipping and packaging costs)
Your first job is to extract these into a single COGS table, keyed by a stable product identifier.
3.2 Standardize Product Identifiers
Google Shopping lives on item IDs (the id field in your Merchant Center feed). Your internal systems often use SKUs.
Create a mapping layer:
products
--------
internal_sku
google_item_id
brand
category
...
Make sure every item in your Merchant Center feed has:
- A unique
google_item_id - A corresponding
internal_skuin your source systems
This mapping is critical — it’s how COGS from your ERP ends up associated with the same product ID Google Shopping sees.
3.3 Build Your COGS Table
At minimum, aim for a structure like:
product_costs
-------------
internal_sku
base_cogs              -- unit cost, ideally landed cost
avg_shipping_cost      -- optional per-unit estimate
payment_fee_rate       -- e.g., 0.025 for 2.5%
packaging_cost         -- optional
margin_bucket          -- low / medium / high, if you still use segmentation
valid_from             -- cost effective date
valid_to               -- optional end date
Maintain this table centrally and treat it as the single source of truth for all profit-related modeling.
3.4 Handling Products Without A Cost Price
You will have SKUs with missing COGS. To avoid poisoning your profit data:
-
Fallback rules
- Use brand- or category-level average margins temporarily.
- Or assign a conservative default margin (e.g., 20%) and flag for cleanup.
-
Fail-safe in bidding
- Either exclude these products from profit-based bidding until COGS is set, or
- Bid on them using a separate “revenue-only” conversion action with stricter targets.
-
Operational loop
Make missing COGS a KPI for merchandising/finance to tackle each week until coverage is near 100%.
4. Step 3 - Model Order-Level Profit From COGS
With product-level COGS in place, the next step is to turn orders into profit events that Google Ads can consume.
4.1 Core Data Model
You’ll typically work with four logical tables (even if they’re views in your warehouse):
orders
------
order_id
order_datetime
customer_id
currency
shipping_revenue
tax
coupon_code
order_status

order_items
-----------
order_id
internal_sku
quantity
item_price_ex_vat
item_discount_amount

product_costs
-------------
internal_sku
base_cogs
avg_shipping_cost
payment_fee_rate
packaging_cost

ad_clicks
--------
order_id (or gclid/order_id join table)
gclid / gbraid / wbraid
campaign
ad_group
...
4.2 Example Profit Calculation Per Line Item
For each order_item, join to product_costs and compute:
line_revenue   = (item_price_ex_vat - item_discount_amount) × quantity

line_cogs      = base_cogs × quantity

line_ship_cost = avg_shipping_cost × quantity

line_fee_cost  = line_revenue × payment_fee_rate

line_profit    = line_revenue
                 - line_cogs
                 - line_ship_cost
                 - line_fee_cost
                 - packaging_cost × quantity
Then aggregate to order level:
order_profit = SUM(line_profit for all items in the order)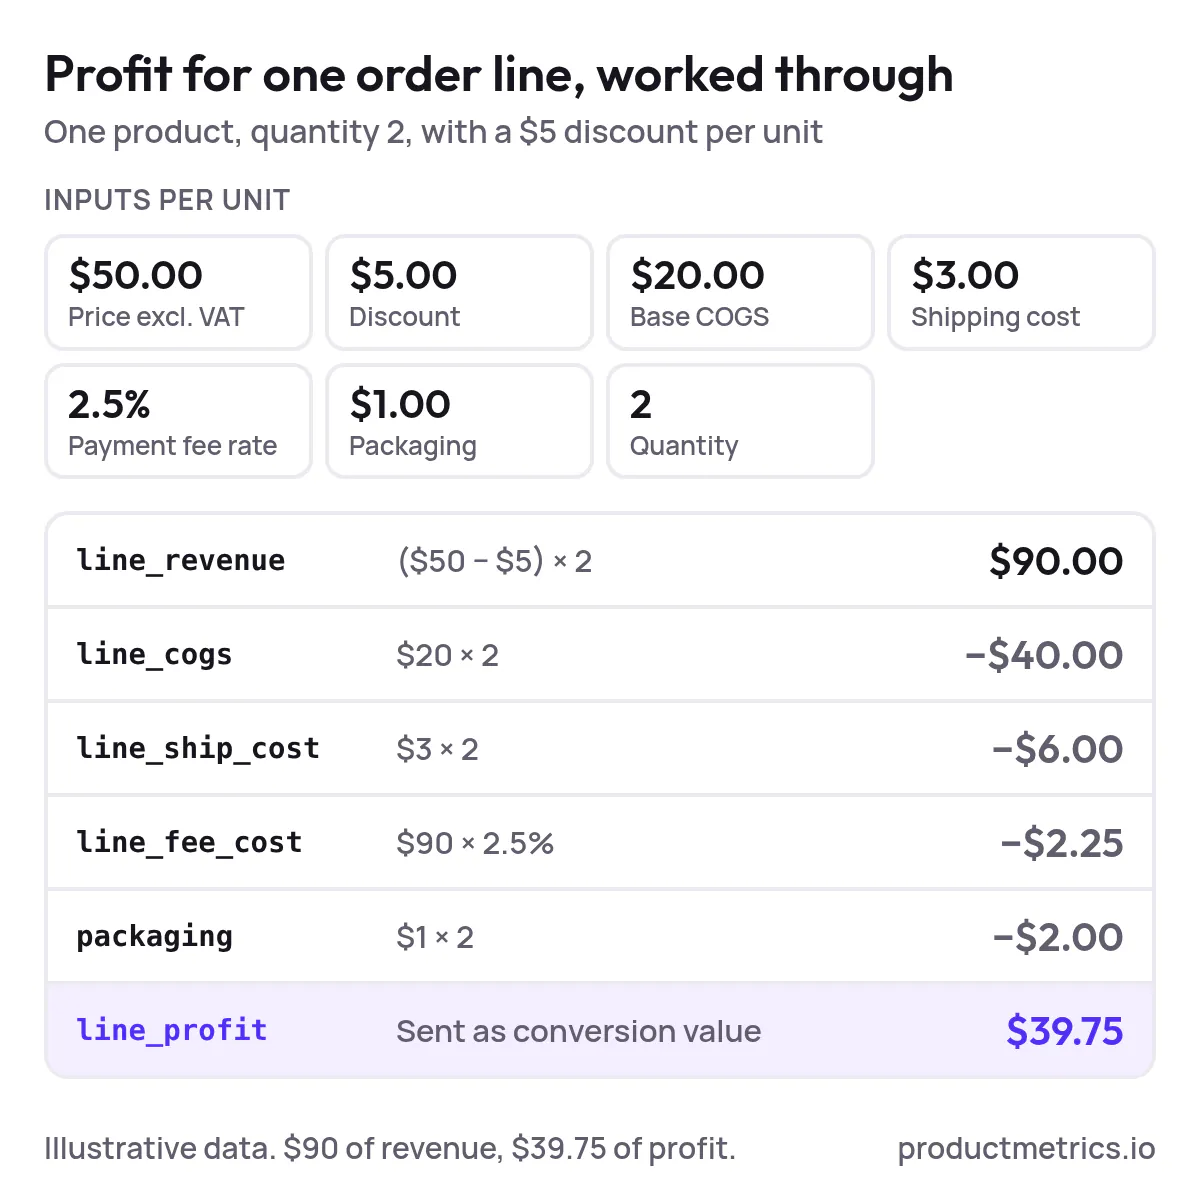
Depending on your metric choice from Step 1, you may omit certain costs (e.g., shipping) from order_profit.
4.3 Net Versus Gross Profit As Google Ads Conversion Value
Many teams ask:
Should we send gross profit or net profit as the Google Ads conversion value?
Guidelines:
- Use gross profit or contribution margin as your conversion value. These capture product-level and order-level economics that depend on each click.
- Keep true net profit (after all fixed overhead) for your finance and board reporting.
The goal inside Google Ads is not perfect accounting; it’s to give Smart Bidding a clean, high-signal proxy for business value that varies meaningfully between clicks.
5. Step 4 - How To Integrate COGS And Margin Tracking With Google Shopping
Now that you can compute profit per order, you need to connect it to Google Shopping and Performance Max.
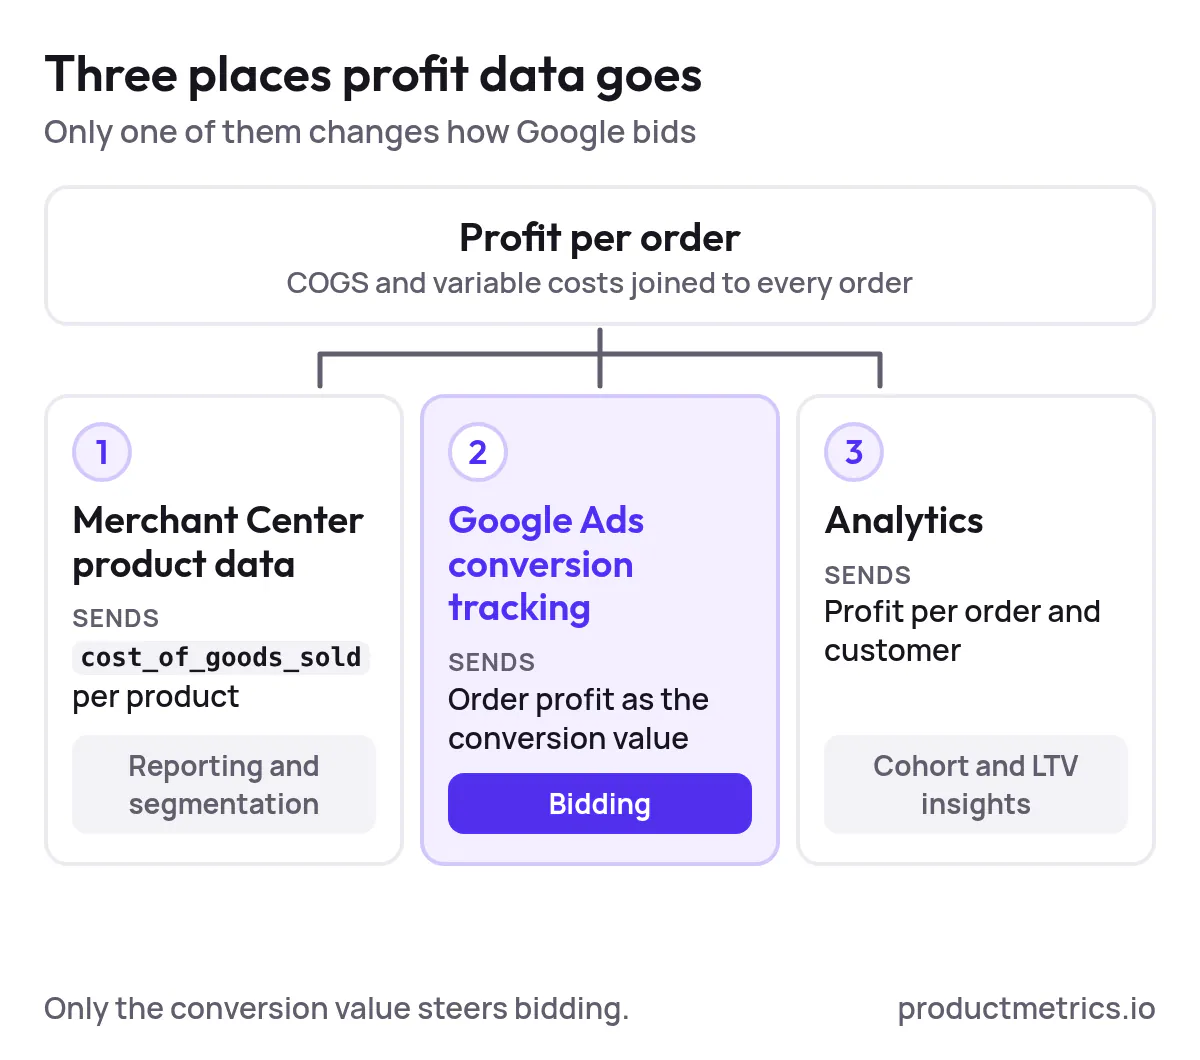
There are three key integration surfaces:
- Merchant Center product data (for reporting and segmentation)
- Conversion tracking in Google Ads (for bidding)
- Analytics (for cohort and LTV insights)
5.1 Use Merchant Center COGS For Reporting Not Bidding
Google Merchant Center supports a cost_of_goods_sold attribute. Populating this lets you analyze profit in product performance reports, especially when combined with Conversion with Cart Data (CwCD) reporting.
However:
- COGS in Merchant Center/Shopping is primarily a reporting field, not a direct bidding input.
- You cannot currently plug the COGS column itself into a bidding formula or Google Ads bid strategy.
So, while you should fill cost_of_goods_sold where possible, profit-based bidding still relies on sending profit as the conversion value in Google Ads.
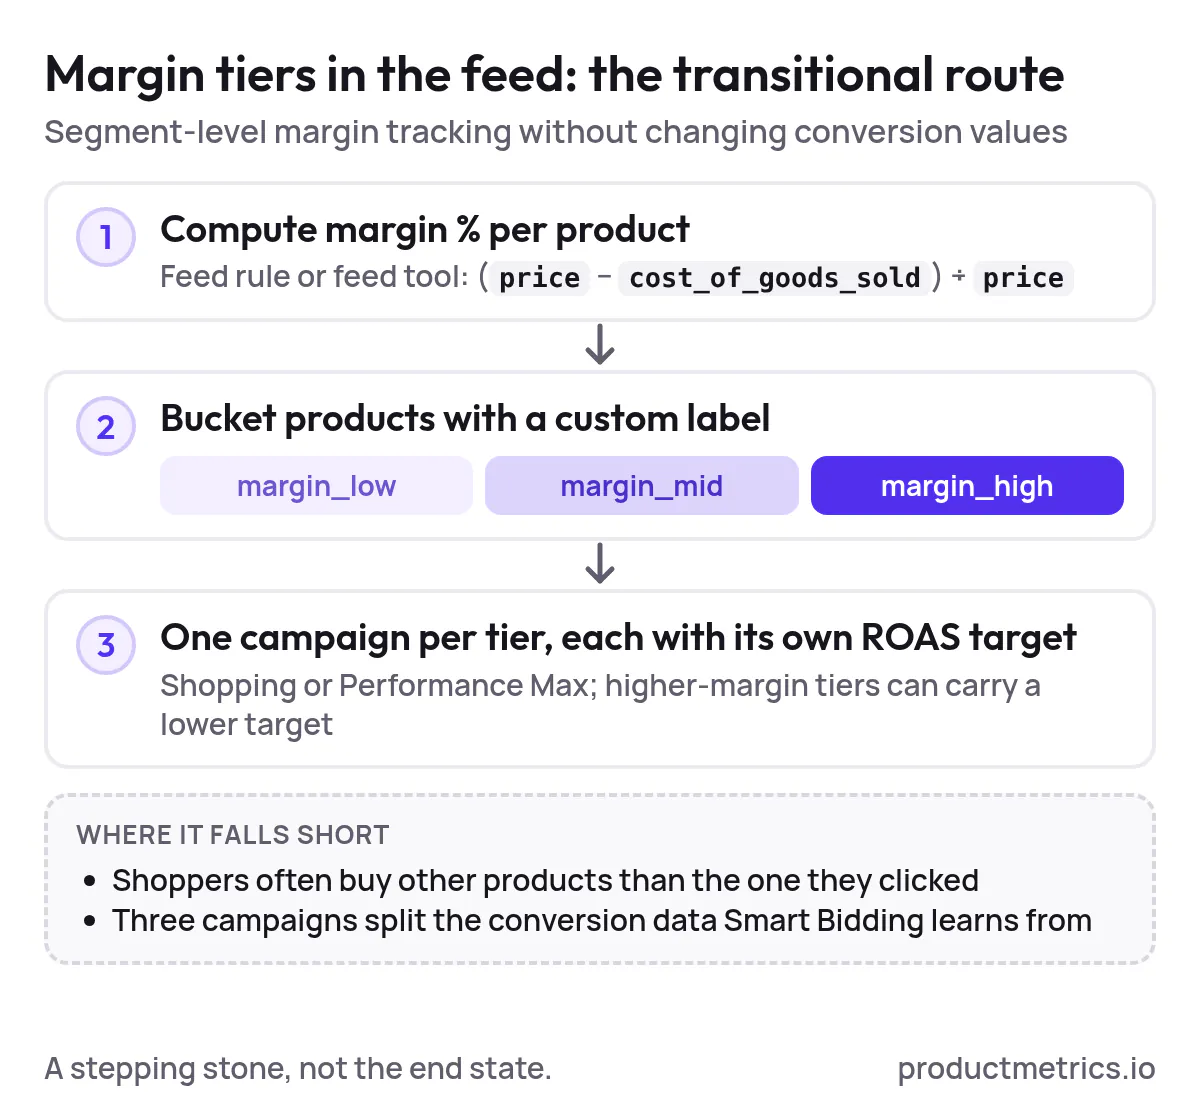
5.2 Margin-Based Feed Segmentation When You Must
If you’re not ready to overhaul conversion tracking, a transitional approach is to:
- Use feed rules or an external feed tool to compute margin % from
priceandcost_of_goods_sold. - Bucket products into margin tiers (e.g.,
margin_low,margin_mid,margin_high) using custom labels. - Build separate Shopping or Performance Max campaigns by margin tier, with different ROAS targets.
This answers basic questions like “How to track margins effectively in Google Shopping?” at a segment level.
Caveats:
- It assumes users buy the same product they clicked — often untrue in multi-item baskets.
- It fragments your data across many campaigns, starving Smart Bidding of volume.
Use this as a stepping stone, not your end state.
5.3 Profit-Based Conversion Values The Real Answer
The robust way to improve Google Shopping ROI with margin tracking is to:
- Compute profit per order (Section 3), and
- Send that profit value to Google Ads as the conversion value for your primary purchase conversion action.
Once you do this, Google’s value-based bidding strategies (like “Maximize conversion value” or “Target ROAS”) effectively become profit-based bidding strategies.
This is the core of:
- How to improve Google Shopping ROI with margin tracking
- How to link COGS data to Google Shopping performance
6. Step 5 - Send Profit Instead Of Revenue As Your Google Ads Conversion Value
There are three main implementation paths, depending on your tech stack and latency tolerance.
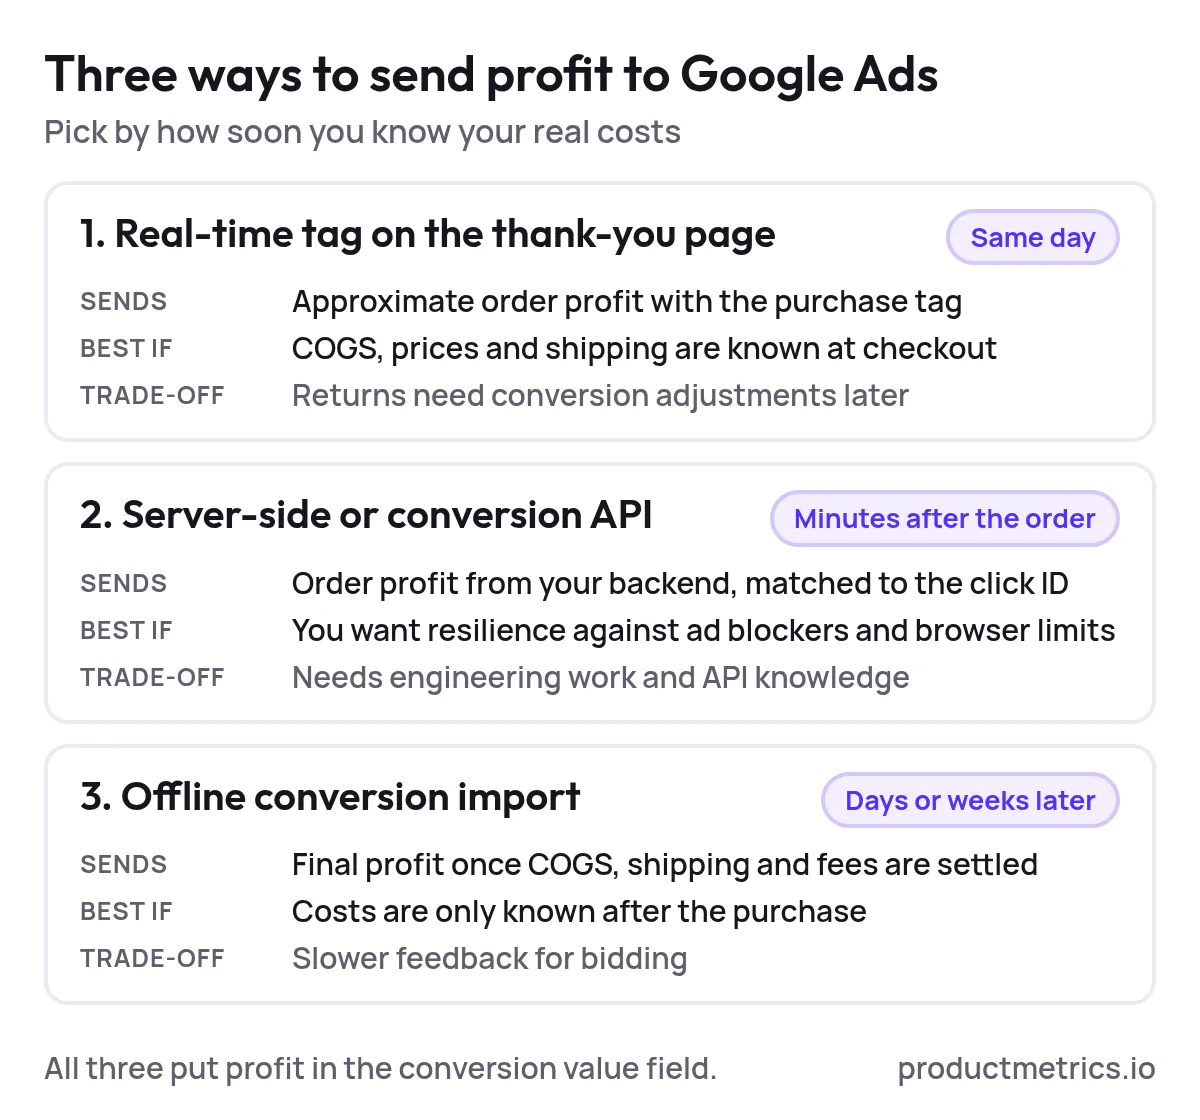
6.1 Real-Time Tracking On The Thank-You Page
Best if:
- You can compute approximate profit at checkout (prices and COGS are stable, shipping cost is known upfront).
How it works:
-
When an order is placed, your backend or tag manager assembles all line items.
-
It looks up COGS and other variable costs for each SKU.
-
It calculates
order_profitbased on your chosen formula. -
It fires the purchase conversion tag (via gtag, Google Tag Manager, or similar) with:
gtag('event', 'purchase', { 'send_to': 'AW-CONVERSION_ID/label', 'value': order_profit, 'currency': 'USD', 'transaction_id': 'ORDER1234' }); -
Google Ads logs the purchase with profit as the value, not revenue.
Pros:
- Simple architecture
- Same-day data, great for bid automation
Cons:
- Harder to correct for returns and post-purchase adjustments unless you also implement conversion adjustments (see Section 7).
6.2 Server-Side Tracking Or A Conversion API
Best if:
- You want more control and resilience than browser tags can provide.
How it works:
- Your backend receives order data and associates it with an ad click (via GCLID / GCLID-like ID, or first-party click/session IDs).
- A background job computes
order_profitand posts it to Google Ads via API or server-side tag manager.
Pros:
- More robust to ad blockers and browser limitations
- Easier to integrate with data warehouses and profit modeling pipelines
Cons:
- Requires engineering work and API familiarity
6.3 Offline Conversion Imports Delayed But Precise
Best if:
- Your true COGS or fees are only known days or weeks after purchase (e.g., dynamic shipping, supplier costs, or marketplaces).
How it works:
- Log the initial order with a provisional conversion (often revenue-based or zero-value) using standard web tracking.
- After your accounting or warehouse system knows the final COGS, shipping, and fees, compute
order_profitfor each order. - Import that data as offline conversions mapped to the original clicks or order IDs.
This path is slower but lets you answer advanced questions like:
- How to analyze COGS data for Google Shopping success?
- How to pass gross profit per order to Google Ads accurately, even with variable COGS?
7. Fixing Reality Returns Cancellations And Conversion Adjustments
Even with great COGS integration, your profit data will drift if you ignore what happens after the sale.
Common problems include:
- Orders canceled before shipping
- Partial returns (one item from a multi-item basket)
- Full refunds weeks later
To keep your Google Ads data honest, you need a conversion adjustment loop.
7.1 Conceptual Model For Conversion Adjustments
-
Maintain an order ledger with current status and up-to-date profit:
order_id status -- completed, canceled, refunded, partial_refund original_profit current_profit -- after refunds/fees last_updated_at -
When
current_profitchanges (because of a refund, chargeback, or cost update), compute:profit_delta = current_profit - original_profit -
Translate
profit_deltainto a conversion adjustment back to Google Ads:- If the order is fully refunded, you effectively negate the original profit.
- If an item is returned, you partially reduce the profit.
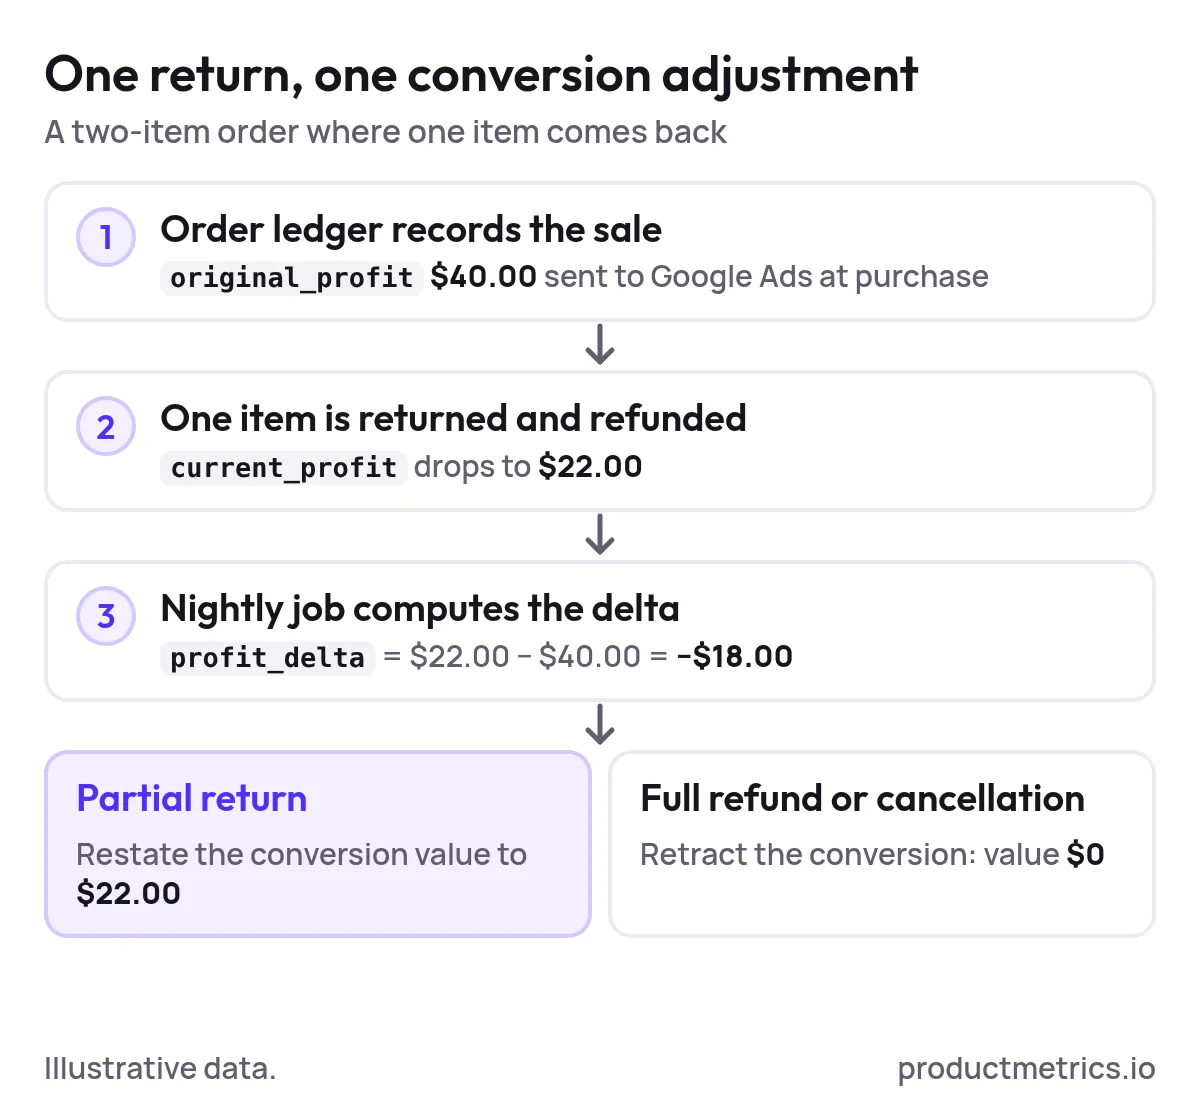
This is the backbone of:
- Automatic conversion adjustments for refunds in Google Ads
- How to subtract refunds from Google Ads conversion value
- Best way to correct Google Ads conversions for returns and refunds
7.2 Practical Recommendations
- Start with full refunds and cancellations only. Negate those conversions so campaigns stop looking more profitable than they are.
- Add partial refunds once your data pipeline is stable.
- Run a regular job (e.g., nightly) that looks at orders updated in the last N days and posts the corresponding adjustments.
You don’t need perfect day-one coverage; moving from 0% to even 50–60% refund adjustment coverage dramatically improves the reliability of your POAS.
8. Shipping Payment Fees Discounts And Other Real-World Costs
Several of your target queries center on the messy bits of real ecommerce economics:
- How to include cost of goods sold in Google Ads conversion value?
- Should shipping costs be included in Google Ads conversion value?
- How to include shipping and transaction costs in POAS?
- How to account for payment fees and discounts in profit tracking?
Here’s a pragmatic approach.
8.1 Include What Changes Per Click
You want your conversion value to reflect incremental profit from each order. That means including:
- COGS – this is non-negotiable if you’re serious about POAS.
- Discounts and coupons – subtract them from revenue first.
- Shipping costs – include if they vary meaningfully by product, destination, or basket size.
- Payment fees and marketplace commissions – include if they’re a significant % of revenue.
8.2 How To Include Shipping And Transaction Costs In POAS
In your profit formula, keep these as explicit components:
order_profit = order_revenue
               - total_cogs
               - shipping_costs
               - payment_fees
               - packaging/handling
Then send order_profit as the Google Ads conversion value.
This way, you don’t need Google to “understand” shipping or fees explicitly — they’re baked into the value you send.
8.3 Net Profit Versus Gross Profit As Google Ads Conversion Value
If you want to compare net profit vs gross profit as Google Ads conversion value:
- Start by sending gross profit or contribution margin as your in-platform value.
- In your BI tool, layer on fixed cost allocations to compute net profit by campaign or channel.
Trying to send fully-loaded net profit into Google Ads usually adds complexity without improving optimization quality.
9. Privacy How To Bid On Profit Without Showing Google Your Real Margins
A common concern:
How do we bid on profit in Google Ads without showing Google our exact margins?
The answer is simple: scale your profit values.
If you multiply all profit values by a constant factor k (say 0.1 or 5), then:
- Relative differences between clicks and campaigns stay the same.
- Smart Bidding still learns which clicks are more or less valuable.
- Google sees only a rescaled value, not your true dollar margin.
Example:
- Real profit: $80 → send 8.0 (k = 0.1)
- Real profit: $20 → send 2.0

Show the dataHide the data
| Order | Real profit | Value sent (k = 0.1) |
|---|---|---|
| Order with $80 profit | 80.0 | 8.0 |
| Order with $20 profit | 20.0 | 2.0 |
When you set a Target ROAS on this rescaled value, you just adjust the target accordingly.
This approach lets you fully embrace profit-based bidding while keeping true unit economics private.
10. Tools And Patterns For COGS Integration In Google Shopping Campaigns
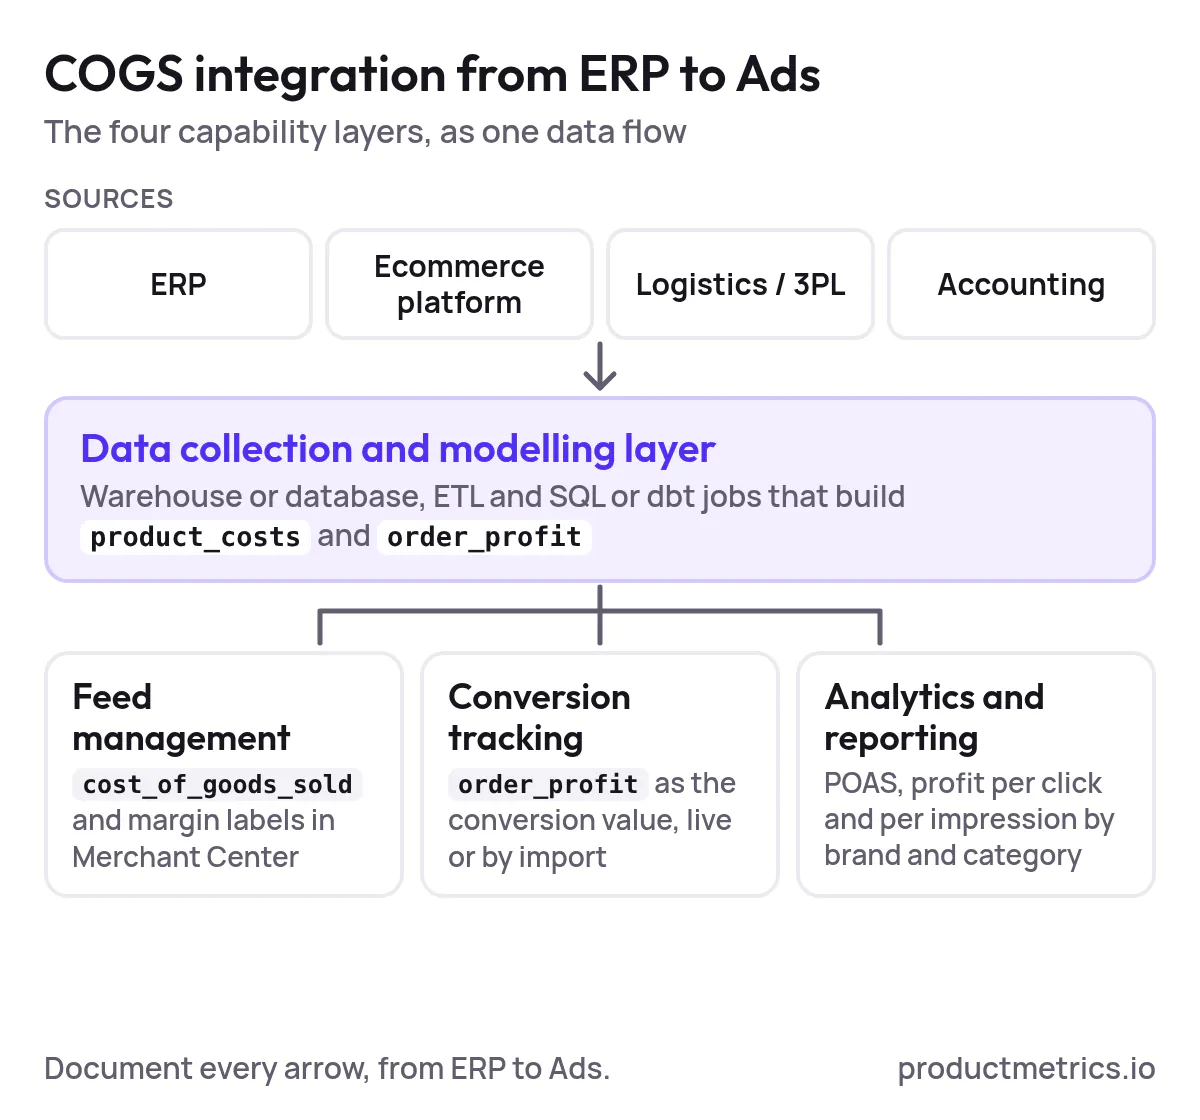
If you’re wondering about tools for integrating COGS with Google Shopping analytics and conversion tracking, think in terms of capabilities rather than specific brands.
You’ll typically need:
-
Data collection & modeling layer
- Data warehouse or database (BigQuery, Snowflake, Postgres, etc.)
- ETL or integration tool to pull from ERP, ecommerce, and logistics
- Jobs (SQL, dbt, or similar) to compute order-level profit
-
Feed management for Merchant Center
- Ability to join your product feed with the
product_coststable - Populate
cost_of_goods_soldand, optionally, margin-based custom labels
- Ability to join your product feed with the
-
Conversion tracking integration
- Web/SDK tags, server-side GTM, or a dedicated conversion API service
- Logic to look up order_profit and send it as conversion value in real time or via offline imports
-
Analytics & reporting
- Dashboards showing POAS, profit per click, and profit per impression
- Breakdowns by brand, category, margin bucket, device, and audience
A platform like Productmetrics.io can sit across several of these layers — especially the COGS modeling and profit-based conversion integration pieces — so practitioners don’t have to build everything from scratch.
10.1 Recommendations For COGS Integration In Google Shopping Campaigns
To answer the query “recommendations for COGS integration in Google Shopping campaigns” directly, here’s a prioritized list:
- Get your COGS coverage above 90% of revenue. Partial coverage leads to misleading POAS.
- Start with a single profit metric (e.g., contribution margin before fixed overhead) and avoid changing it mid-quarter.
- Send profit as the primary conversion value in Google Ads as soon as your calculations are stable.
- Use Merchant Center COGS for diagnostics and QA, not as your main optimization lever.
- Limit campaign fragmentation. Don’t over-split by margin buckets; let Smart Bidding work on richer, consolidated data.
- Implement refund and cancellation adjustments within 60–90 days of an order wherever possible.
- Document your entire data flow — from ERP to Ads — so future changes don’t silently break profit tracking.
11. Implementation Checklist From ROAS To Profit
Use this as a practical runbook for your team.
Phase 1 - Foundations (1–3 weeks)
- Align stakeholders on the definition of profit to use in Google Ads.
- Inventory all COGS and cost data sources (ERP, ecommerce, 3PL, accounting).
- Map internal SKUs to Google item IDs in your Merchant Center feed.
- Build a product_costs table with COGS and key variable costs.
Phase 2 - Profit Modeling (2–4 weeks)
- Build order and order_item tables (or views) if you don’t already have them.
- Implement SQL or modeling logic to compute order_profit per order.
- Validate profit outputs against finance for a sample of orders.
- Populate Merchant Center
cost_of_goods_soldfor reporting.
Phase 3 - Activation In Google Ads (2–4 weeks)
- Choose your activation path: real-time web tags, server-side, or offline imports.
- Implement a profit-based purchase conversion action and test with low traffic.
- Gradually switch Shopping and Performance Max campaigns to optimize on profit.
- Set initial POAS/Target ROAS goals based on historical margins and adjust over time.
Phase 4 - Hardening And Optimization (Ongoing)
- Add conversion adjustments for refunds and cancellations.
- Tighten handling for products without COGS and missing data.
- Monitor POAS by campaign, brand, and audience; shift budget toward the highest profit density.
- Periodically revisit your profit definition as your business model evolves.

Show the dataHide the data
| Phase | Shortest (weeks) | Longest (weeks) |
|---|---|---|
| Phase 1: foundations | 1 | 3 |
| Phase 2: profit modelling | 2 | 4 |
| Phase 3: activation in Google Ads | 2 | 4 |
12. Where Productmetrics.io Fits
Building all of this from scratch — COGS collection, profit modeling, and integration into Google Shopping and Google Ads — is absolutely possible. But it’s also exactly the kind of plumbing most growth and performance teams don’t have time to own long term.
Productmetrics.io is designed to:
- Connect your product, order, and COGS data into a coherent profit model
- Turn that model into clean, reliable profit-based conversion values for Google Ads
- Help you monitor POAS, margins, and profitability across Shopping and Performance Max campaigns
If you’re ready to move from theoretical profit to profit in practice, this is the moment to make COGS and margin a first-class citizen in your Google Shopping stack.
Next step: Connect your product, finance, and acquisition teams, and design your profit model. Then use Productmetrics.io to operationalize it end-to-end — from raw COGS to profit-optimized bidding in Google Ads.
Written by
Berend Vrakking, Founder of Product Metrics
1M+ products analysed · Nominated at the Dutch Search Awards for Best Measurement Campaign (2023) and Best Use of Data (2024)
Keep reading.
The Google Shopping Segmentation Playbook For 2026 Frameworks Labels And Structures
A feed-first Google Shopping segmentation playbook: custom labels, three campaign layers and new-customer bidding for Shopping and Performance Max.
Measuring Profit Segmentation In Google Shopping: Metrics, Tests And The Tools That Make It Work
Measuring profit segmentation in Google Shopping: four metric layers, a baseline test and product-level POAS show which segments make money.
The 2026 Ecommerce ROAS Optimization Tools Landscape - How Performance Teams Evaluate, Pilot, and Scale
The 2026 ecommerce ROAS optimization tools landscape - how performance teams evaluate, pilot and scale Google Shopping tools with custom dashboards.
See which of your products to push, fix or pause. Start with your own products, or a 30-second estimate.
Check one product first: work out its break-even ROAS in the calculator. Then see where all your products stand.
Questions, or want to spar about your products? Book a demo: a video call with Berend, then a demo account.