
Measuring Profit Segmentation In Google Shopping: Metrics, Tests And The Tools That Make It Work
Measuring profit segmentation in Google Shopping: four metric layers, a baseline test and product-level POAS show which segments make money.
If your Google Shopping and Performance Max campaigns only optimize for ROAS, you are almost certainly pushing budget into low‑margin products that look great in the UI but quietly erode profit.
Profit segmentation fixes that by restructuring campaigns and reporting around product‑level margins and contribution instead of just revenue.
This guide is about how to measure profit segmentation in Google Shopping: what to track, how to test, and where a profit data layer like Productmetrics.io fits in.
TL;DR (for your next strategy deck)
- Profit segmentation means grouping products and campaigns by economics (margin, fees, shipping, returns) instead of only by category or brand.
- You enable it with feed‑level flags (often custom labels) for things like margin tier, best‑seller status, and promotions, then mirror those groups in campaigns and asset groups.
- The core evaluation metrics are gross profit after ad spend, POAS (profit on ad spend), profit per click, and the share of spend going to profit‑positive segments.
- You measure success by mix shift (more budget into profitable segments) and account‑level profit lift vs a non‑segmented baseline.
- A profit data layer such as Productmetrics.io centralizes product‑level cost and margin data, then feeds profit metrics into your Shopping and PMax reporting so you can actually act on POAS, not just ROAS.
Soundbite: If your Shopping strategy does not know your margins, it does not know your goal.
1. What Is Profit Segmentation In Google Shopping?
Profit segmentation is the practice of structuring your Google Shopping and Performance Max campaigns so that products are grouped by profitability, not just category or brand.
Instead of one flat campaign where a $10 low‑margin accessory and a $300 high‑margin flagship product share the same bid strategy, you deliberately separate:
- High‑margin vs low‑margin items
- Best‑sellers vs long‑tail
- Seasonal or promo products vs evergreen
Most advanced Shopping practitioners already segment product groups using custom labels for things like seasonality, clearance, shipping deals, best‑sellers, and margin.
Profit segmentation simply pushes that further: margin and contribution become first‑class segmentation dimensions, and your optimization target becomes profit, not just revenue.
Why this matters:
- ROAS treats a $1 margin and a $50 margin sale equally if revenue is the same.
- Profit segmentation lets you bid more aggressively on products that genuinely drive contribution, and cap or down‑rank products that only create top‑line vanity.

Show the dataHide the data
| Sale | Margin per sale |
|---|---|
| Low-margin sale | $1 |
| High-margin sale | $50 |
2. The Profit Data Layer: What You Need Before You Segment
Before you can measure or optimize profit segmentation, you need a clear profit equation and a way to attach it to each product.
2.1 Define Your Profit Metric
Pick one core metric and stick with it for at least a few months; changing the definition constantly makes evaluation impossible. A practical default for ecommerce is:
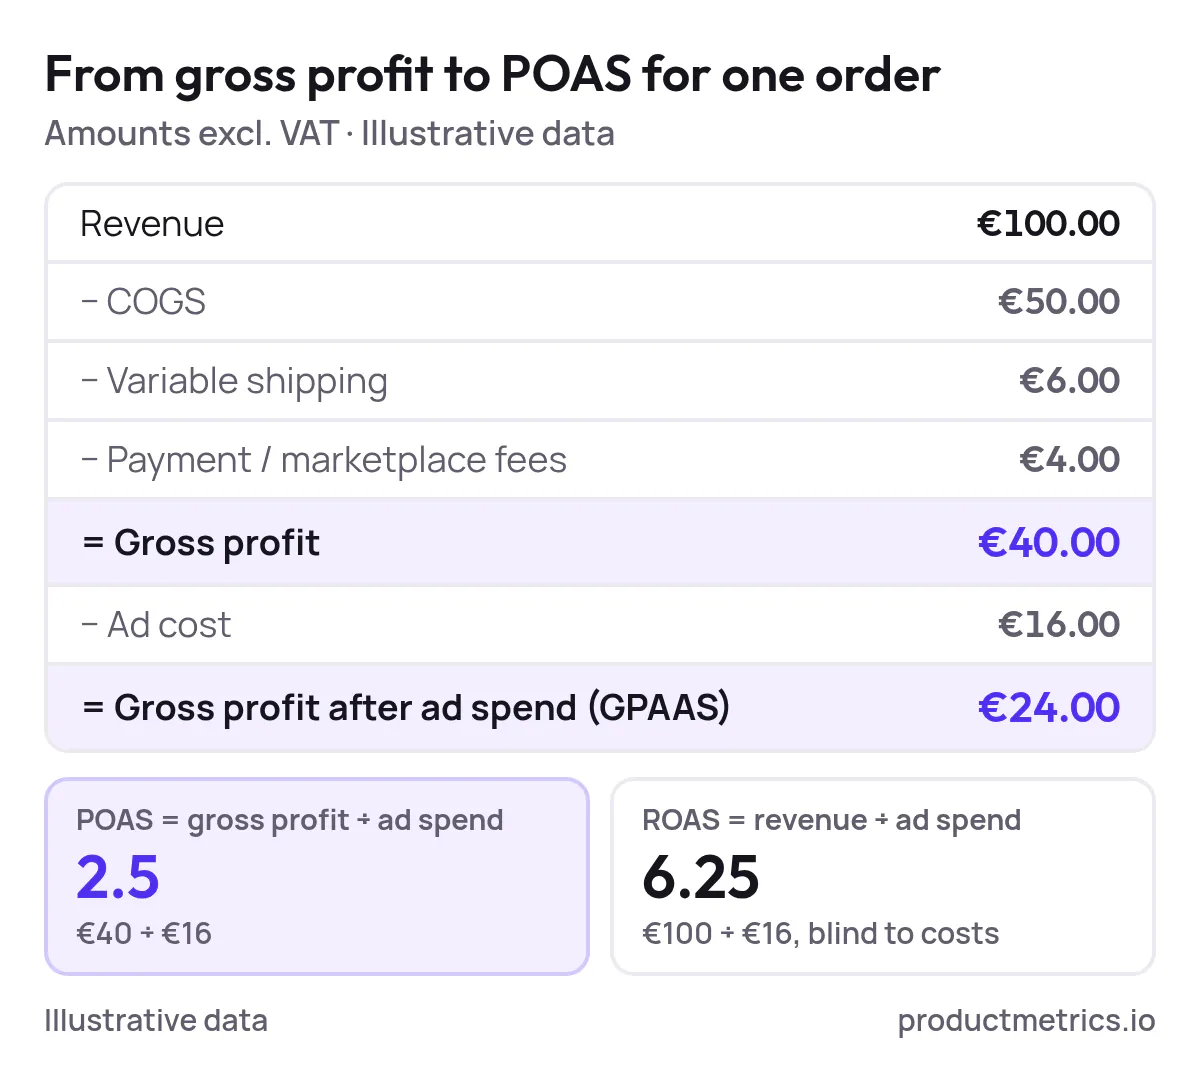
- Gross profit per order:
Revenue – COGS – variable shipping – payment / marketplace fees - Gross profit after ad spend (GPAAS) per order or per product:
Gross profit – ad cost
Once you have gross profit, you can define POAS (profit on ad spend) at any level:
POAS = Gross profit / Ad spend
Daryl Mander, for example, recommends defining a clear profit metric like gross profit after ad spend (GPAAS) and using it consistently in reporting when profit is your goal.
2.2 Attach Profit Data To Products
To make profit‑based segmentation work in Google Shopping, you need product‑level data that includes at least:
- Product ID (matching Merchant Center / Google Ads)
- COGS and variable fees
- Margin tier (e.g., Very high / High / Medium / Low / Negative)
- Optional flags (best‑seller, clearance, seasonal, high return rate)
This data is typically pushed into Shopping via custom labels in the product feed, which Google explicitly supports for flexible segmentation strategies like margin, best‑seller, seasonal, and promotions.
2.3 Where Productmetrics.io Fits
All of this is hard to maintain in spreadsheets at any scale.
A profit data layer such as Productmetrics.io sits between your store / ERP and your ad platforms, acting as the single place where:
- Product‑level costs, margins, and fees are unified and cleaned.
- Margin tiers and other profit‑related attributes are derived.
- Profit metrics such as product‑level gross profit and POAS can be exported to Google Ads, Meta, Merchant Center, and your BI tools.
That lets you build and maintain profit‑based segmentation once at the data layer, instead of re‑coding it manually in every account and every campaign.
3. What Metrics To Track For Profit Segmentation In Google Shopping
This directly addresses the question: what metrics to track for profit segmentation in Google Shopping?
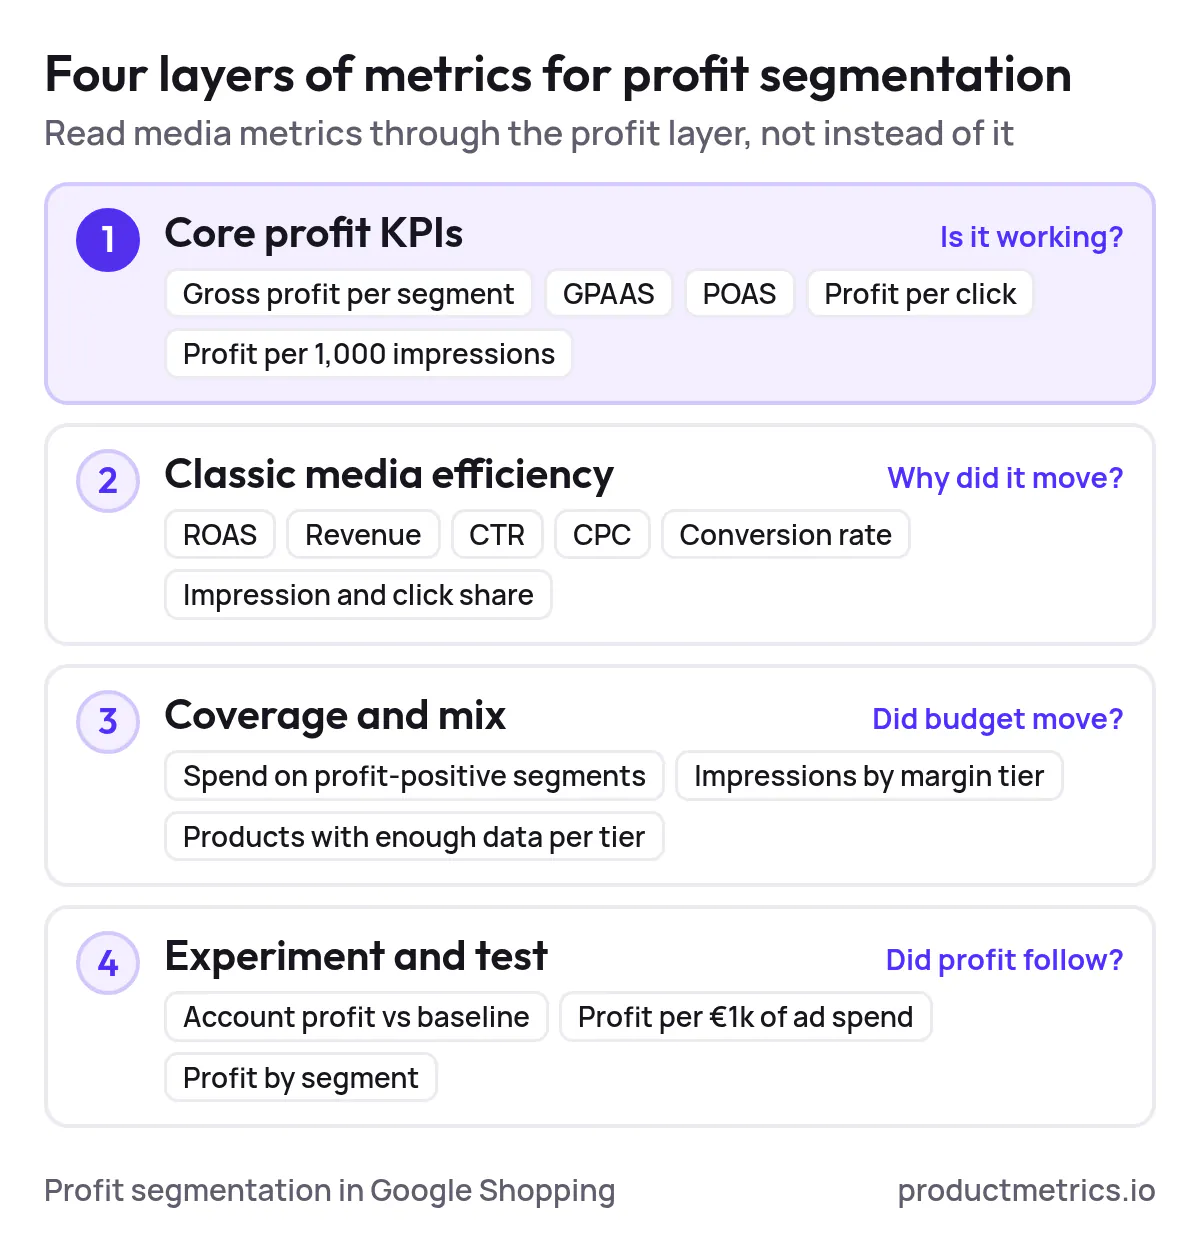
Think of four layers of metrics.
3.1 Core Profit KPIs
These tell you whether segmentation is doing what it is supposed to do.
- Gross profit per product / segment (over a time window)
- Gross profit after ad spend (GPAAS) per segment
- POAS (profit on ad spend) per segment and per campaign
- Profit per click:
GPAAS / clicks - Profit per 1,000 impressions: stabilizes noisy campaigns with low volume
Mander explicitly recommends using gross profit after ad spend as a primary KPI when profit is the goal, and baking it into regular reporting.
3.2 Classic Media Efficiency Metrics
You still need the normal media metrics; you are just reading them through a profit lens:
- ROAS (Return on Ad Spend)
- Revenue
- CTR, CPC, conversion rate
- Impression share and click share
Advanced Shopping guides emphasize tracking ROI/ROAS, CTR, CPC, and conversion rate as the foundation of Shopping optimization; profit segmentation does not replace these, it contextualizes them.
3.3 Coverage And Mix Metrics
To evaluate segmentation, you also need to see how your budget mix changes over time:
- Share of spend on profit‑positive segments (e.g., POAS above your threshold)
- Share of impressions for high‑margin vs low‑margin tiers
- Count of SKUs with statistically useful data in each margin tier
Custom‑label‑driven segmentation makes it straightforward to report performance at the product‑group level instead of wading through product‑level noise.
3.4 Experiment And Test Metrics
For testing profit segmentation strategies, you care about:
- Change in account‑level profit vs baseline period
- Change in profit per $1k of ad spend
- Change in profit distribution across segments (more profit coming from high‑margin segments?)
Segmentation by product groups and campaign structures is widely used specifically because it enables clean A/B‑style comparisons between segments and is easier to manage than product‑by‑product bidding.
4. How To Analyze Profit Segmentation In Google Shopping Campaigns Step‑By‑Step
Here is a practical workflow for how to analyze profit segmentation in Google Shopping campaigns.
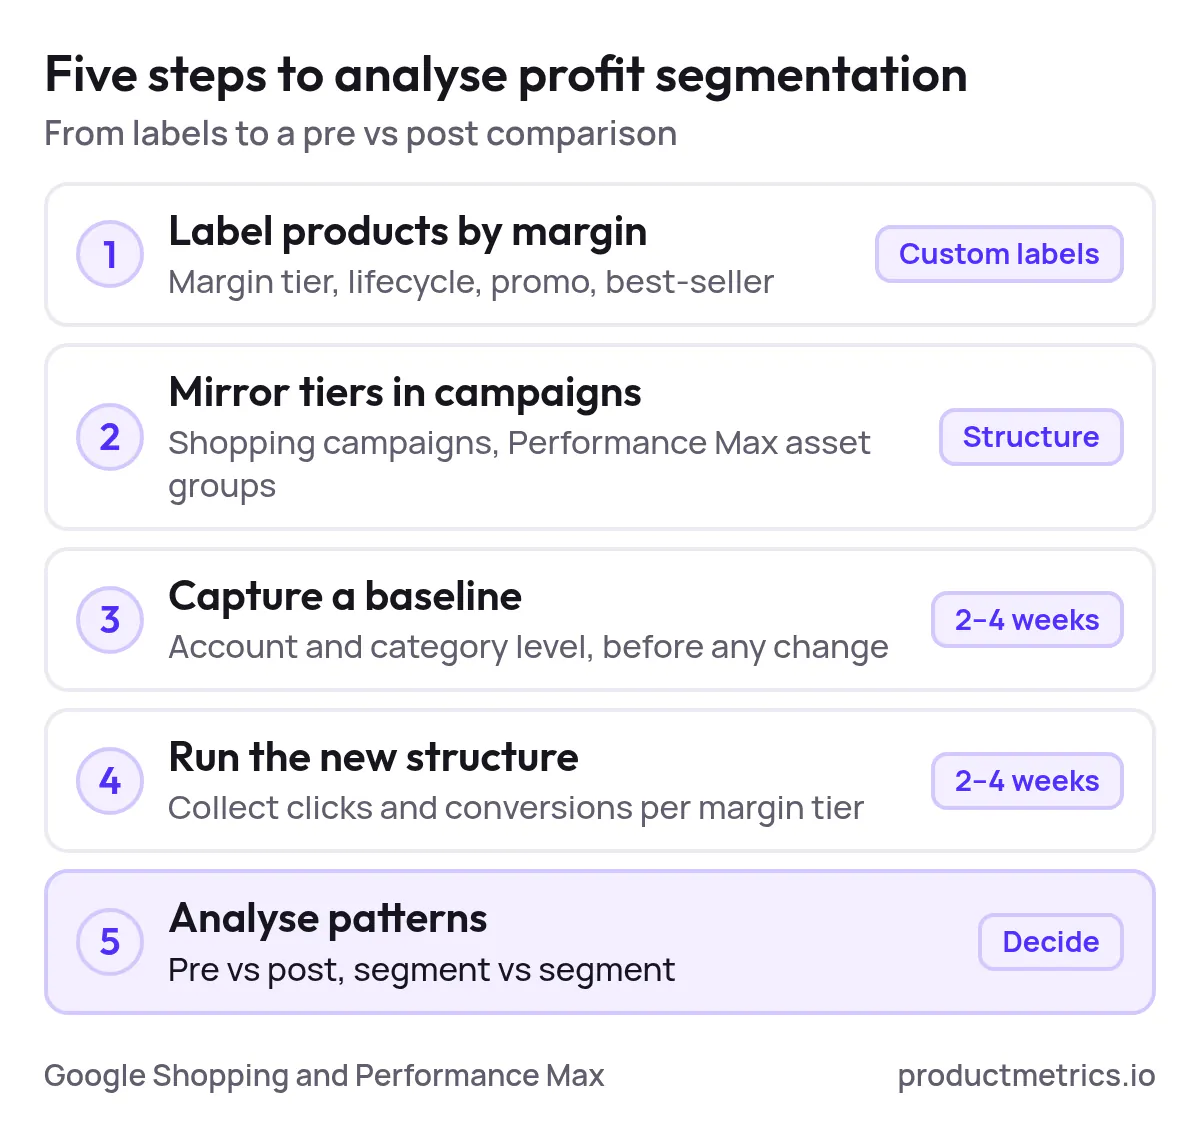
Step 1: Label Products By Margin And Profit Attributes
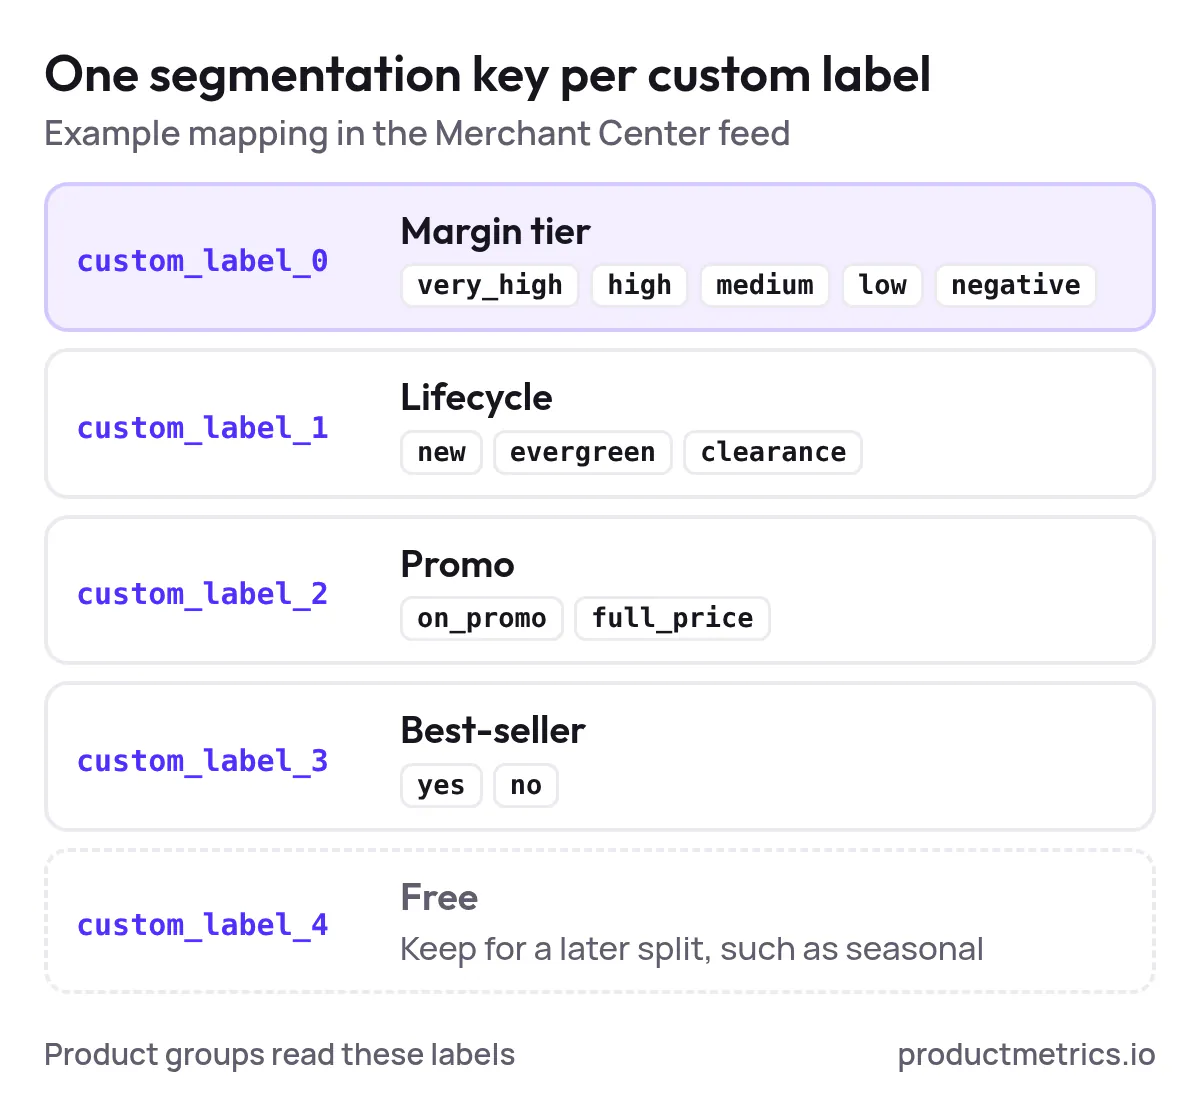
Use Merchant Center custom labels 0–4 for segmentation keys such as:
margin_tier(very_high, high, medium, low, negative)lifecycle(new, evergreen, clearance)promo(on_promo, full_price)bestseller(yes / no)
Industry guidance explicitly calls out margin, seasonal status, shipping deals, and best‑seller status as common custom‑label dimensions for Shopping segmentation.
If Productmetrics.io is your profit layer, this labelling can be generated automatically from your cost and margin tables, then pushed to the feed so campaigns always see up‑to‑date tiers.
Step 2: Mirror Profit Tiers In Shopping And PMax Structure
In standard Shopping:
- Create separate campaigns or at least separate product groups for each
margin_tier. - Use campaign priorities and bids so high‑margin campaigns have more aggressive bids and higher priority for relevant queries, while low‑margin campaigns capture only the leftover traffic.
In Performance Max:
- Either run separate PMax campaigns for high‑margin vs low‑margin product sets, or
- Use asset groups tied to margin tiers, then adjust budgets and targets accordingly.
This is effectively segmenting Performance Max by product margin even though PMax hides keywords.
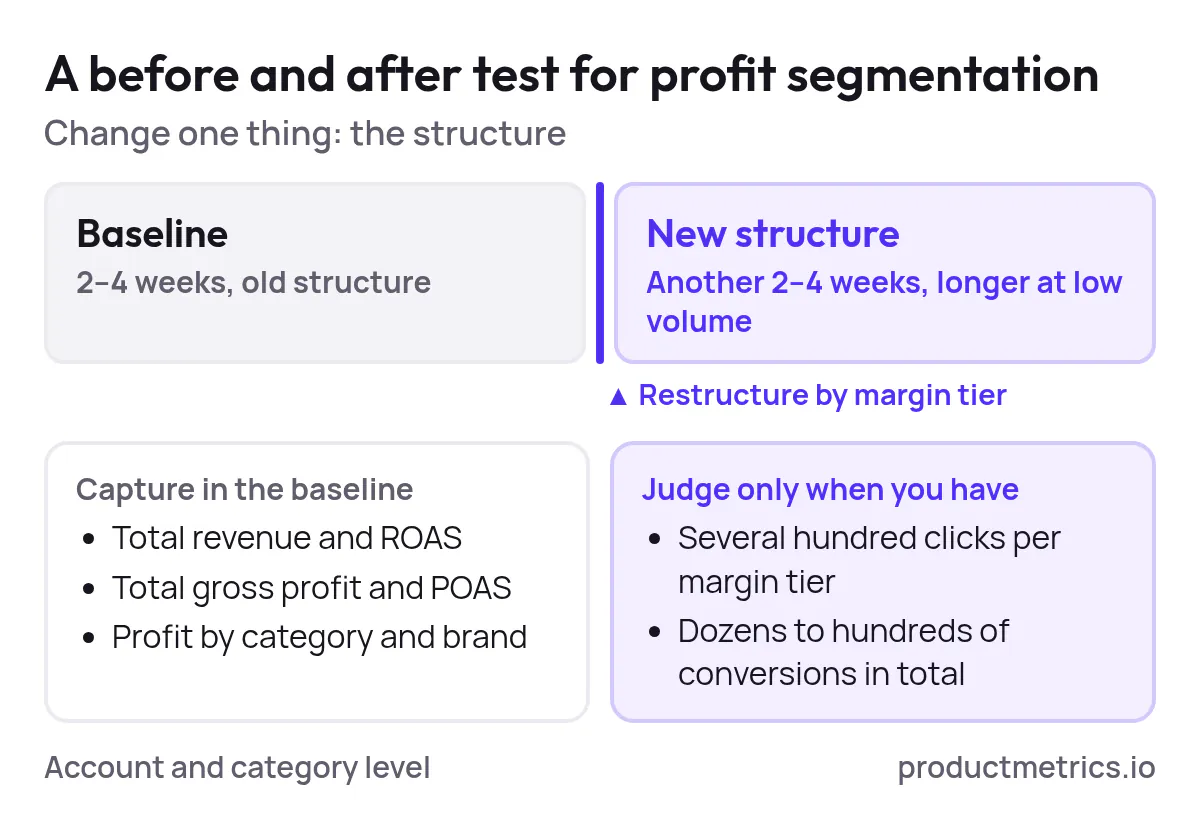
Step 3: Establish A Pre‑Segmentation Baseline
Before making changes, capture at least 2–4 weeks of baseline data at the account and category level:
- Total revenue, ROAS
- Total gross profit and POAS
- Profit distribution by category / brand
If you already have product‑level profit in a tool like Productmetrics.io, export a baseline report by SKU and by pseudo‑segment (e.g., apply what the margin tiers would have been historically).
Step 4: Let The New Structure Run And Collect Data
After implementing profit segmentation, give the new structure enough time (typically another 2–4 weeks, depending on volume) to accumulate:
- At least several hundred clicks per margin tier
- Dozens or hundreds of conversions total (for smaller accounts, more time)
As various Shopping experts note, segmentation only delivers value when combined with ongoing analysis and agile adjustments based on observed performance.
Step 5: Analyze Patterns In Profit Metrics
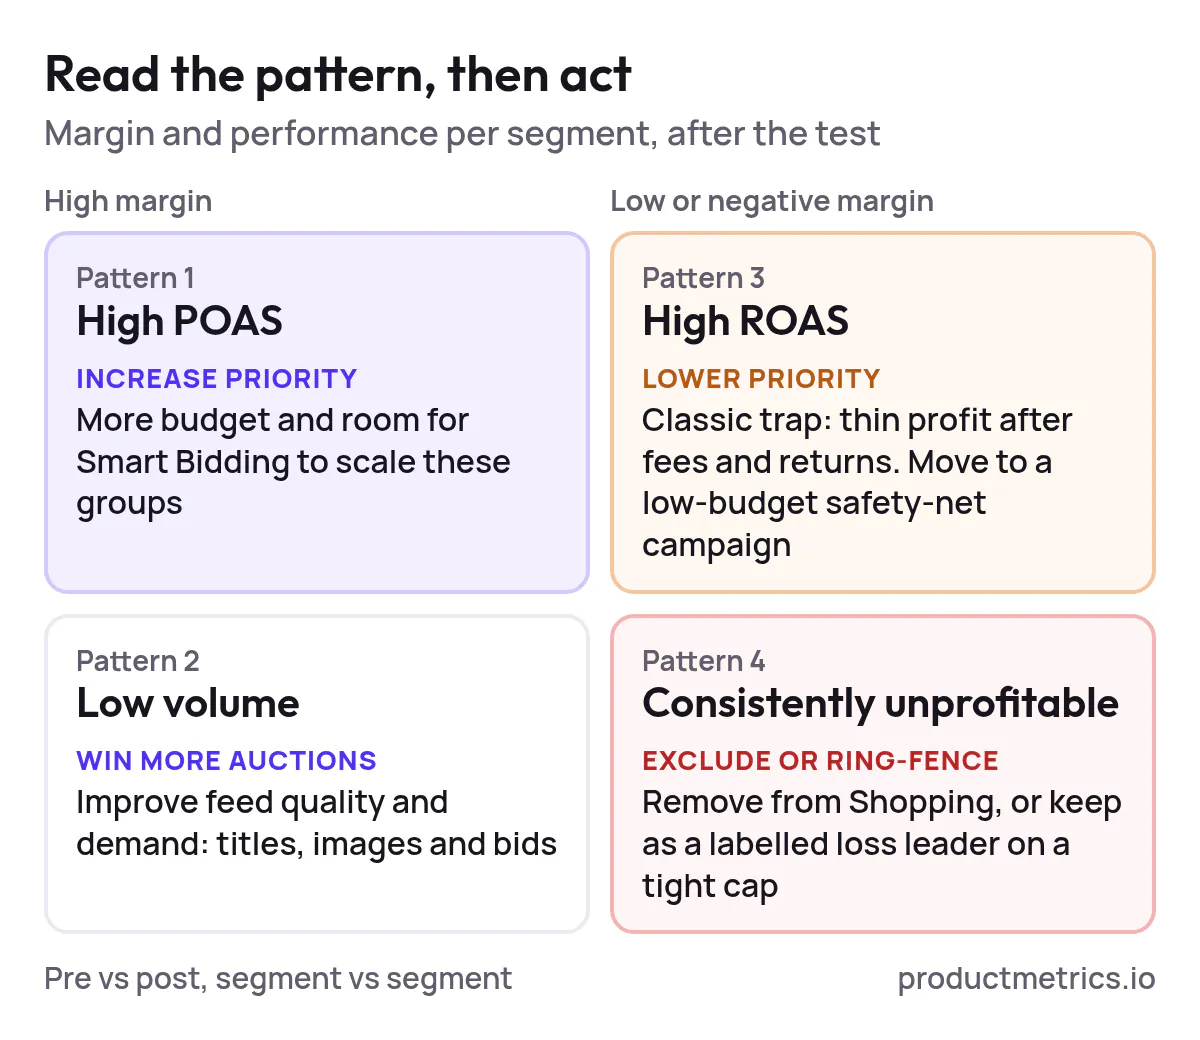
Now compare pre vs post and segment vs segment.
Key patterns to look for:
- High‑margin high‑POAS segments
- Action: Increase budgets and raise tROAS / lower tCPA constraints so Smart Bidding can scale these groups.
- High‑margin low‑volume segments
- Action: Improve feed quality and demand; optimize titles, images, and bids to win more auctions for these products.
- Low‑margin high‑ROAS segments
- Classic trap: strong ROAS but thin or negative profit once fees and returns are included.
- Action: Cap bids or move these into a low‑priority low‑budget safety‑net campaign.
- Negative‑margin or consistently unprofitable products
- Action options:
- Exclude the product entirely from Shopping.
- Keep in a separate tightly capped campaign for strategic reasons (e.g., attachment sales or LTV), but label clearly so everyone knows it is a loss leader.
- Action options:
Product‑group level reporting via custom labels makes it dramatically easier to see which segments are pulling their weight without drowning in SKU‑level noise.
5. How To Evaluate Profit Segmentation Effectiveness In Google Shopping
Once the structure is in place, how do you evaluate whether profit segmentation is actually working?
5.1 Re‑State The Business Goal: Revenue Or Profit
The first step is choosing a clear priority:
- If you prioritize revenue, you might accept thinner margins in exchange for top‑line growth.
- If you prioritize profit, you optimize strictly for contribution metrics like GPAAS and POAS.
Mander argues you should pick one primary goal at a time and define a small set of metrics that map directly to it, then keep those definitions stable across months.
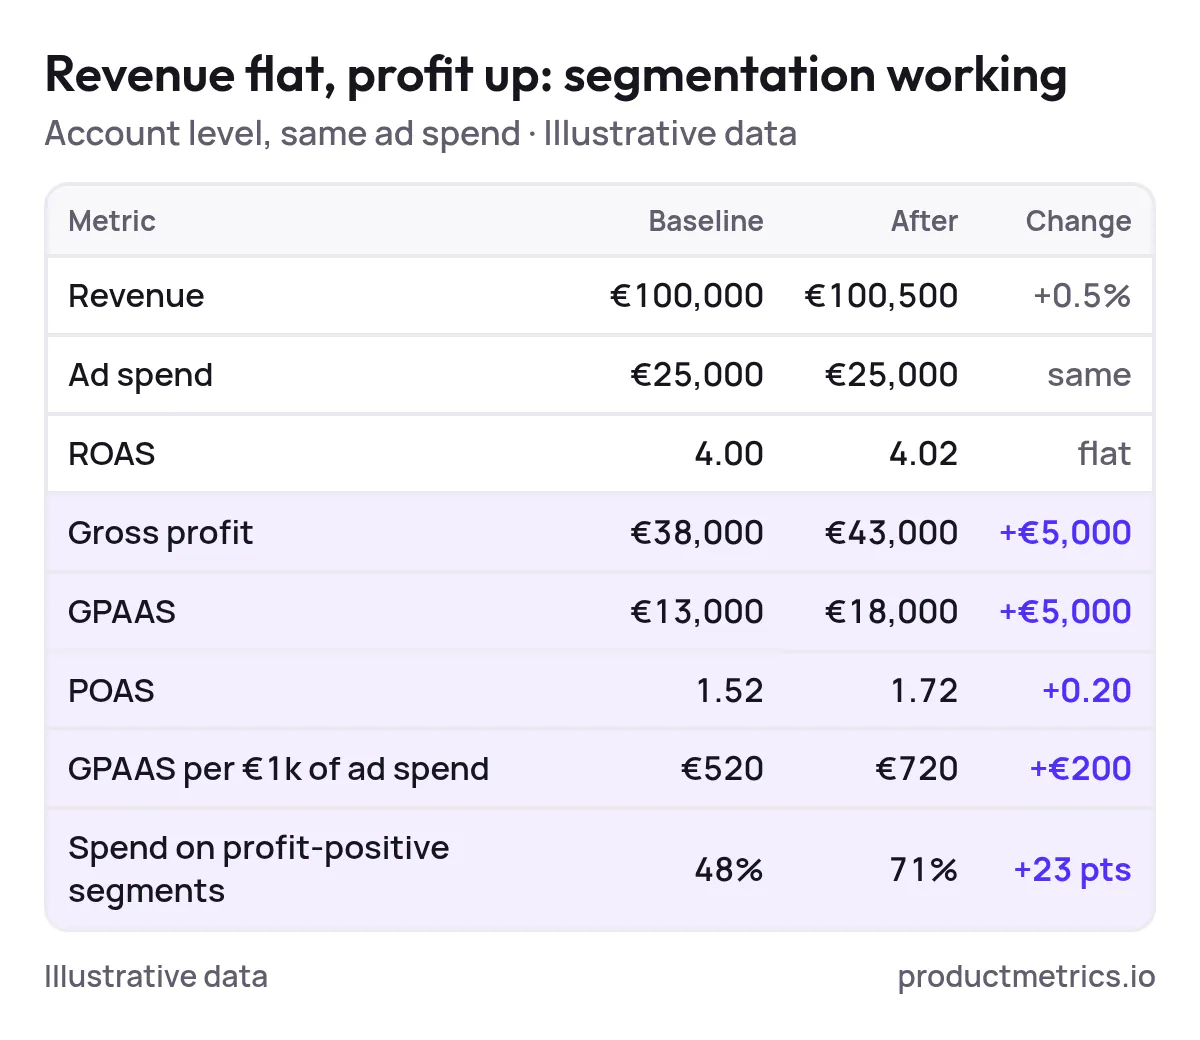
5.2 Account‑Level Profit Vs Baseline
Compare a post‑segmentation period to your historical baseline on:
- Total gross profit after ad spend
- POAS at the account level
- Profit per $1k of ad spend
If revenue stayed flat but profit and POAS improved meaningfully, segmentation is likely working even if ROAS looks similar.
5.3 Mix Shift Toward High‑Margin Segments
Look at how your budget and impressions have re‑distributed:
- % of ad spend now going to high‑margin tiers vs before
- % of impressions now coming from best‑seller + high‑margin products
Sophisticated Shopping playbooks explicitly recommend breaking top‑spend / top‑performing product groups into their own campaigns so you can give them more control, budget, and tailored bids.
If, post‑segmentation, you see a higher share of spend and impressions going to profitable segments while low‑margin segments are capped, that is a strong sign your structure is doing its job.
5.4 Complexity Vs Payoff
Profit segmentation introduces more campaigns, more labels, and more reporting. It is worth it if:
- The incremental profit attributable to segmentation comfortably exceeds the additional management time and tooling cost.
- Teams can explain performance clearly using a small set of profit metrics, instead of drowning stakeholders in conflicting KPIs.
Again, the emphasis in advanced guidance is on clarity and consistency: a few well‑chosen metrics, measured the same way every month, beat an ever‑shifting dashboard.
6. Product‑Level ROAS Vs POAS Reporting For Google Ads
Most Shopping reports stop at product‑level ROAS. To really evaluate profit segmentation you need product‑level POAS as well.
Here are two practical approaches.
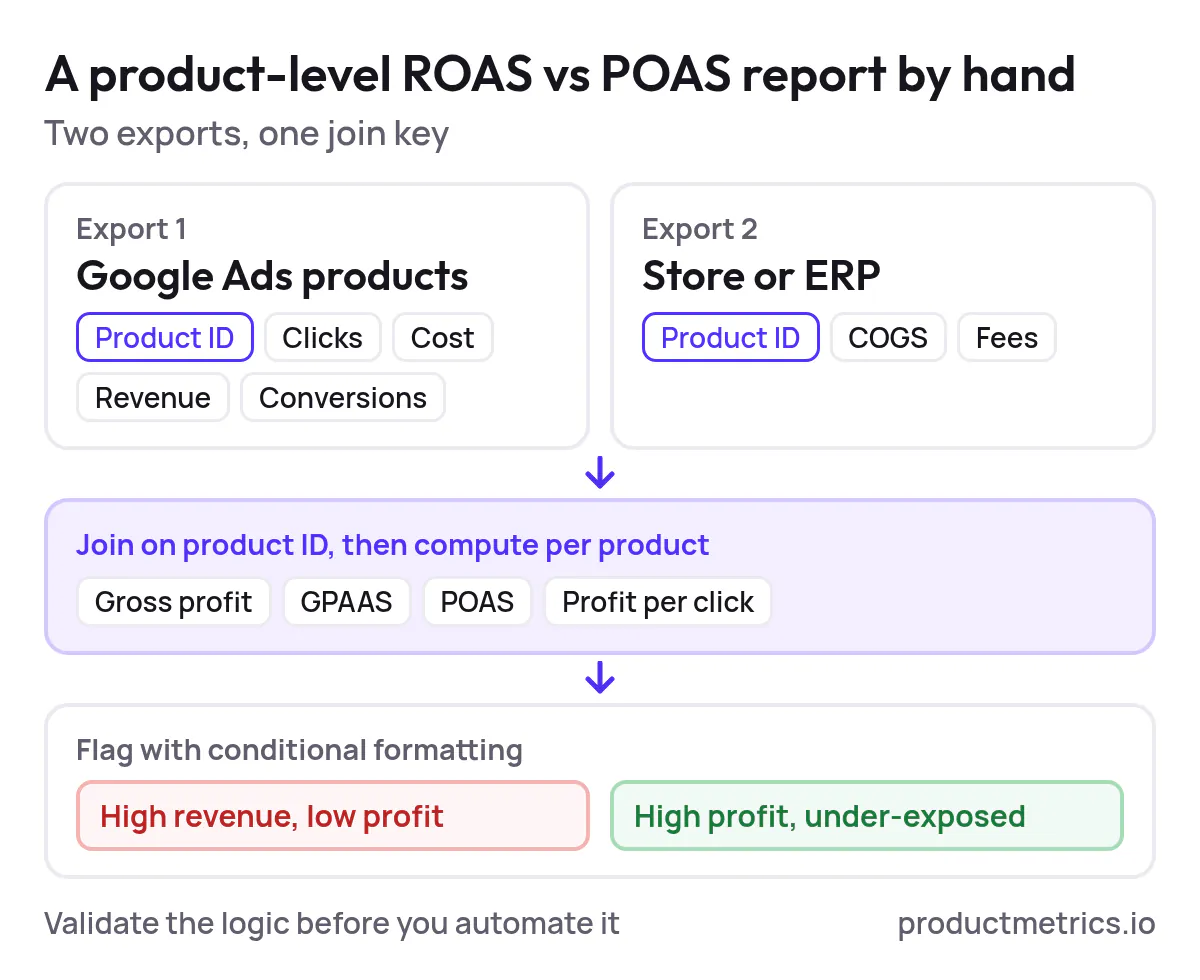
6.1 Spreadsheet Join (Manual)
- Export product‑level performance from Google Ads for your Shopping or PMax campaigns (including product ID, clicks, cost, revenue, and conversions).
- Export product‑level COGS and fees from your ecommerce platform or ERP.
- Join on product ID; compute:
- Gross profit per product
- Gross profit after ad spend (GPAAS)
- POAS and profit per click
- Use simple conditional formatting to flag:
- High‑revenue low‑profit products
- High‑profit under‑exposed SKUs that deserve more budget
This is the low‑tech way to build a product‑level ROAS vs POAS report for Google Ads and is useful for validating your segmentation logic before automating it.
6.2 Profit Data Layer (Automated With Productmetrics.io)
As data volume grows, the manual join becomes fragile.
A profit data layer like Productmetrics.io can:
- Continuously join ad performance with product‑level cost and margin data.
- Compute gross profit, GPAAS, and POAS per product and per segment.
- Feed those metrics into your BI stack and, where supported, back into Google Ads and Meta via offline conversions or custom data feeds.
That unlocks things like:
- Always‑on product‑level POAS dashboards that mirror your campaign segmentation.
- Alerting when previously profitable products slip into negative POAS.
- Cleaner conversations with stakeholders: you can literally show how much profit each POAS‑optimized segment is generating.
7. How To Use Data For Profit Segmentation In Google Shopping Campaigns: A 30/60/90‑Day Roadmap
Finally, here is a pragmatic roadmap for how to use data for profit segmentation in Google Shopping campaigns without stalling in analysis.
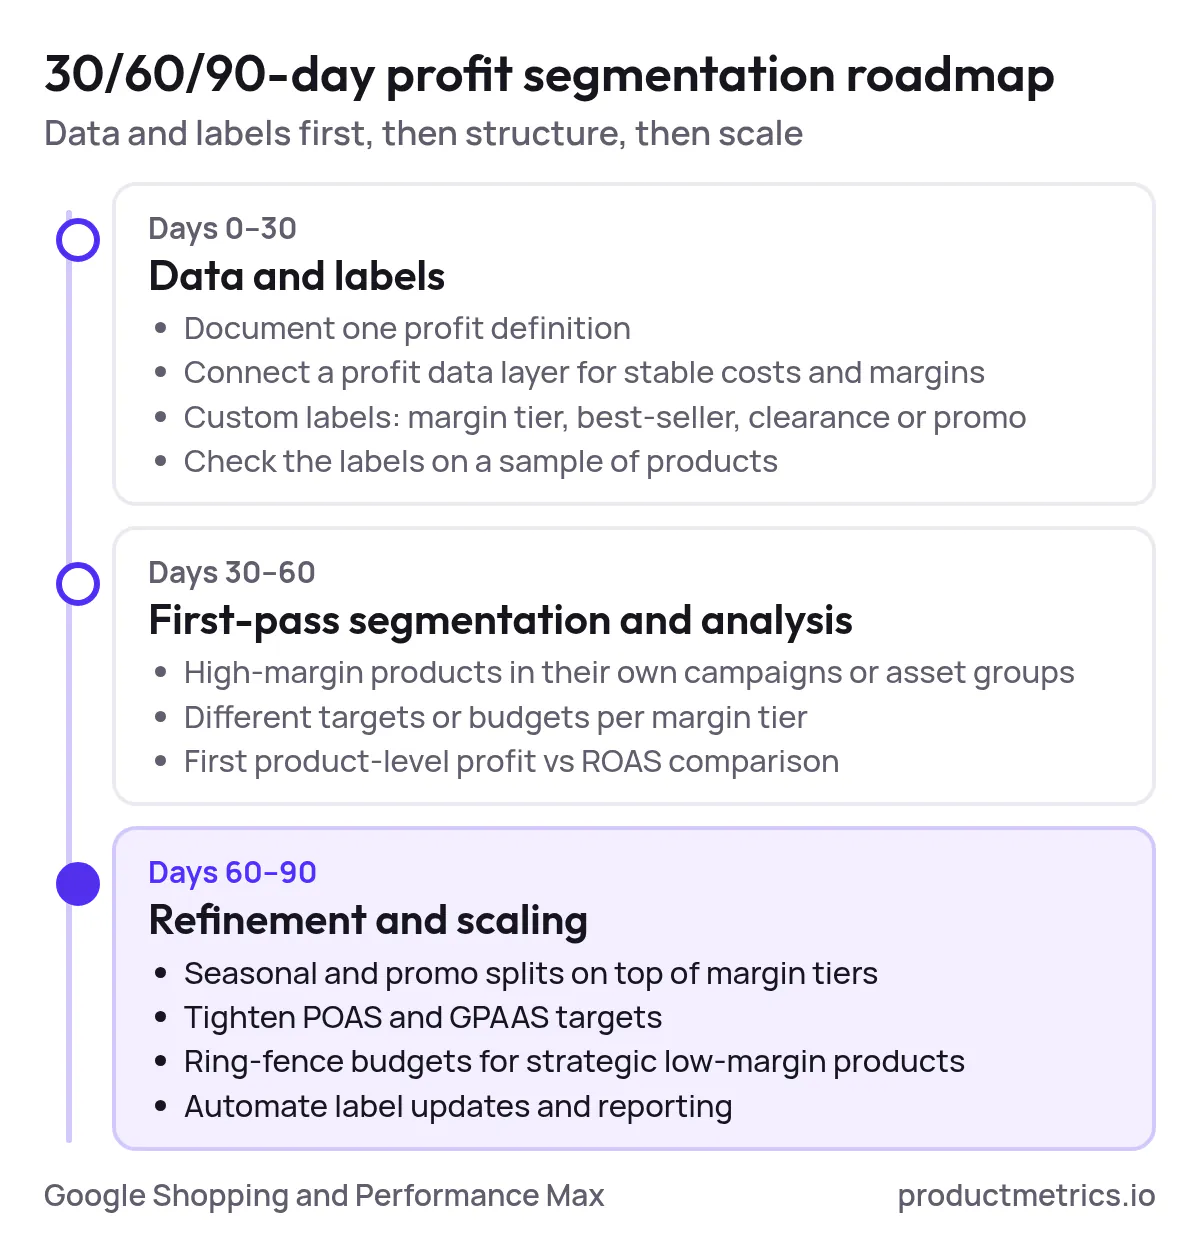
Days 0–30: Data And Labels
- Decide on your profit definition (gross profit vs gross profit after ad spend) and document it.
- Stand up or connect your profit data layer (e.g., Productmetrics.io) so product‑level costs and margins are stable.
- Implement custom labels in your Merchant Center feed for:
- Margin tiers
- Best‑sellers
- Clearance / promo status
- Sanity‑check the labels on a sample of products to ensure the mapping matches reality.
Days 30–60: First‑Pass Segmentation And Analysis
- Restructure key Shopping and PMax campaigns so that high‑margin products live in their own campaigns or asset groups.
- Apply different bid targets or budgets by margin tier.
- Track the metrics from Section 3 at the segment and account level.
- Run your first profit vs ROAS comparison at product level to identify:
- High‑revenue low‑profit products to cap or exclude.
- High‑profit under‑served products to promote.
Guides from Optmyzr and Metric Theory both stress the importance of segmenting Shopping campaigns and then continuously analyzing and adjusting based on performance; your twist is that you are doing it through a profit lens.
Days 60–90: Refinement And Scaling
- Introduce seasonal and promotional splits (e.g., Q4 vs off‑season, sale vs full price) layered on top of margin tiers.
- Tighten your POAS and GPAAS targets based on what you have learned.
- Decide deliberately which low‑margin or negative‑margin products remain live for strategic reasons (LTV, bundling) and ring‑fence their budgets.
- Use your profit data layer to automate ongoing label updates and reporting, so profit segmentation becomes part of your standard operating procedure, not a one‑time project.
8. Bringing It Together
Profit segmentation is not a hack; it is a structural change in how you think about Google Shopping and Performance Max.
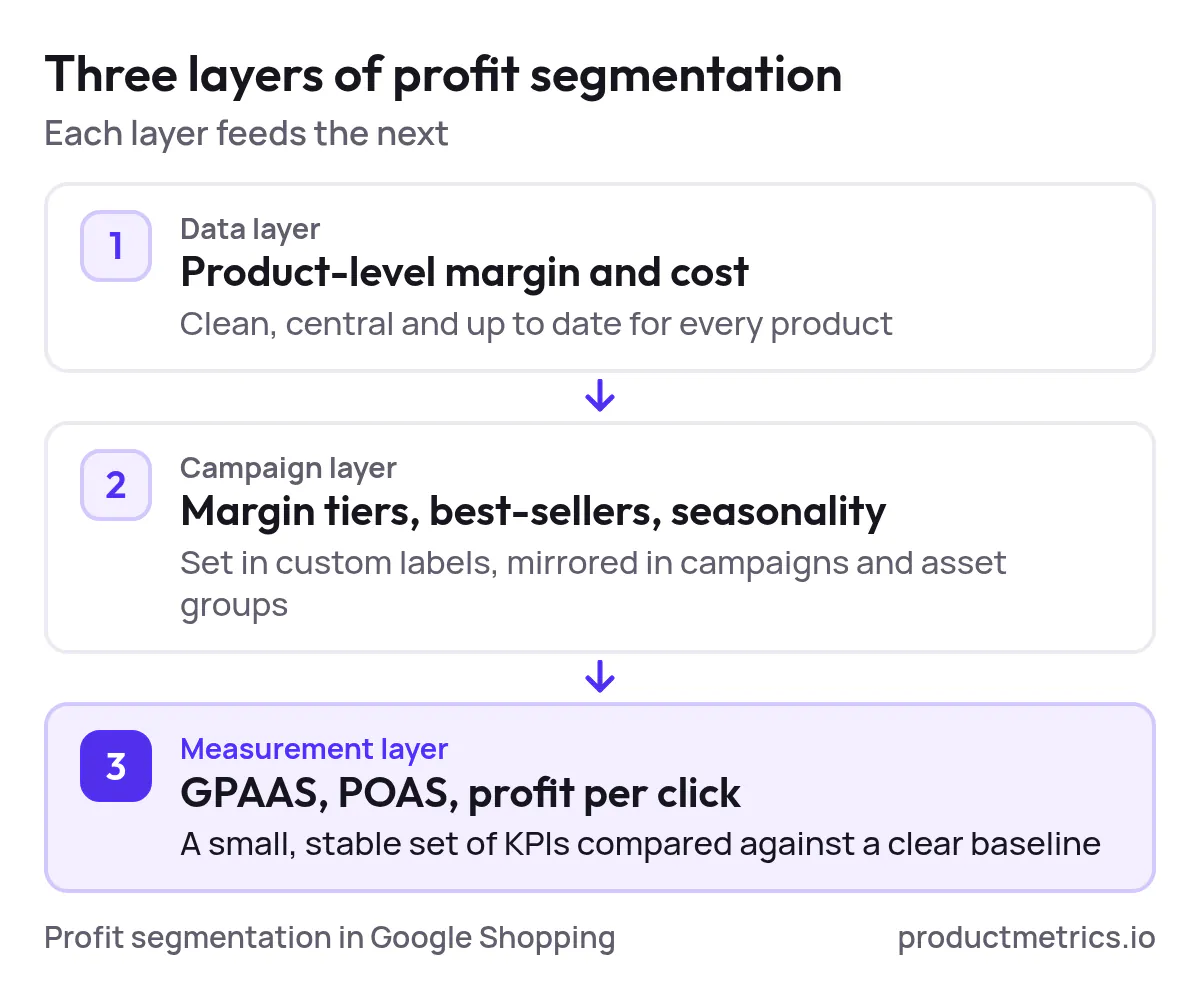
- At the data layer, you need clean product‑level margin and cost data, ideally centralized in a tool like Productmetrics.io.
- At the campaign layer, you need segmentation by margin tiers, best‑sellers, and seasonality, implemented with custom labels and mirrored in campaigns and asset groups.
- At the measurement layer, you need a small, stable set of profit‑focused KPIs (GPAAS, POAS, profit per click) and a habit of comparing them against a clear baseline.
Do that, and your next Shopping report will not just say what happened.
It will finally answer the question that matters: which parts of your catalog actually make you money, and how much more profit you get when you segment for it.
Written by
Berend Vrakking, Founder of Product Metrics
1M+ products analysed · Nominated at the Dutch Search Awards for Best Measurement Campaign (2023) and Best Use of Data (2024)
Keep reading.
The Google Shopping Segmentation Playbook For 2026 Frameworks Labels And Structures
A feed-first Google Shopping segmentation playbook: custom labels, three campaign layers and new-customer bidding for Shopping and Performance Max.
The Practical Buyer’s Guide To Google Shopping ROAS Platforms With Customizable Dashboards
The Practical Buyer’s Guide To Google Shopping ROAS Platforms With Customizable Dashboards: demo scripts, a scoring matrix and a security checklist.
Where to Buy and How to Choose Google Shopping Segmentation Software With Advanced Granularity: A Practical Buyer’s Guide
Where to Buy and How to Choose Google Shopping Segmentation Software With Advanced Granularity: pricing, a selection checklist and a six-step migration.
See which of your products to push, fix or pause. Start with your own products, or a 30-second estimate.
Check one product first: work out its break-even ROAS in the calculator. Then see where all your products stand.
Questions, or want to spar about your products? Book a demo: a video call with Berend, then a demo account.