
Designing Multi‑Level Performance Dashboards For Segmented Google Ads From Campaigns To SKUs
Designing Multi‑Level Performance Dashboards For Segmented Google Ads From Campaigns To SKUs: metric ladders, role views and latency tiers for Shopping and PMax
Highly segmented Google Shopping setups are powerful—but they’re also fragile.
Once you start layering campaign types, product groups, custom labels, and audiences, it becomes almost impossible to see:
- Which segments are truly driving incremental profit
- Where budget is being wasted inside Performance Max or Standard Shopping
- How specific SKUs behave inside broader segments
This is where most brands stall. They’ve built sophisticated segmentation, but they’re still managing performance from a handful of generic views in Google Ads and spreadsheets.
In this guide, we’ll outline how to design multi‑level performance dashboards for segmented Google Shopping campaigns—from the account level down to individual SKUs—with clear metric ladders, role-based views, latency targets, and embedded experimentation panels.
The examples are written with Productmetrics.io in mind as a Google Shopping optimization partner, but the architecture applies regardless of the specific stack you use.
1. Why Granular Performance Tracking Breaks In Segmented Shopping
Before designing dashboards, it’s worth naming the common failure modes you’re probably seeing today:
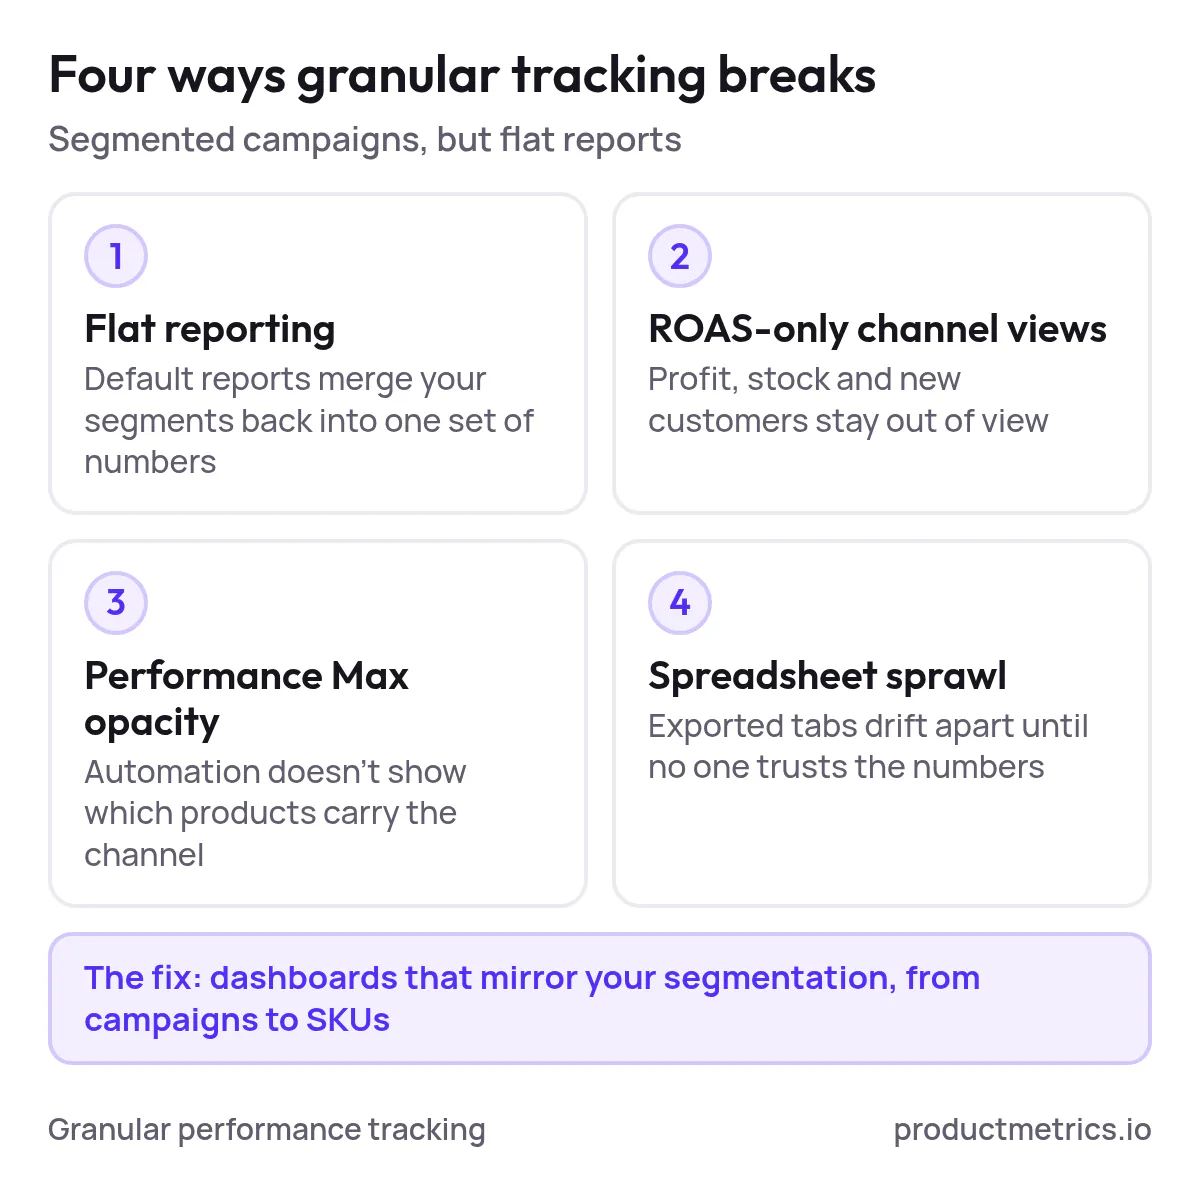
- Flat reporting on non‑flat campaigns
The more you segment by performance, price, margin, lifecycle, or brand, the more your default reports collapse those segments back into a flat set of numbers. You can’t see which business logic is actually driving results. - Channel views that ignore business reality
Shopping performance is usually judged on high-level KPIs like ROAS or CPA, not on blended metrics like profit, inventory health, or new customer impact. That disconnect makes it easy to over‑invest in the wrong segments. - PMax opacity
Performance Max and Smart Bidding automate bidding and placements, but they don’t automatically tell you which product groups, labels, or SKUs are carrying the channel. Without your own views, optimization devolves into guesswork. - Spreadsheet sprawl
Analysts export data from Google Ads, Merchant Center, and analytics tools into ad‑hoc sheets. After a few months, no one trusts which tab is the source of truth, and it’s too brittle to support real experimentation.
A well‑designed dashboard system solves these problems by mirroring your segmentation strategy and giving every stakeholder a consistent, multi‑level view from campaigns to SKUs.
2. Model Your Shopping System From Campaigns To SKUs
Start by formalizing the entities and relationships your dashboards need to represent.
2.1 Core Entities To Track
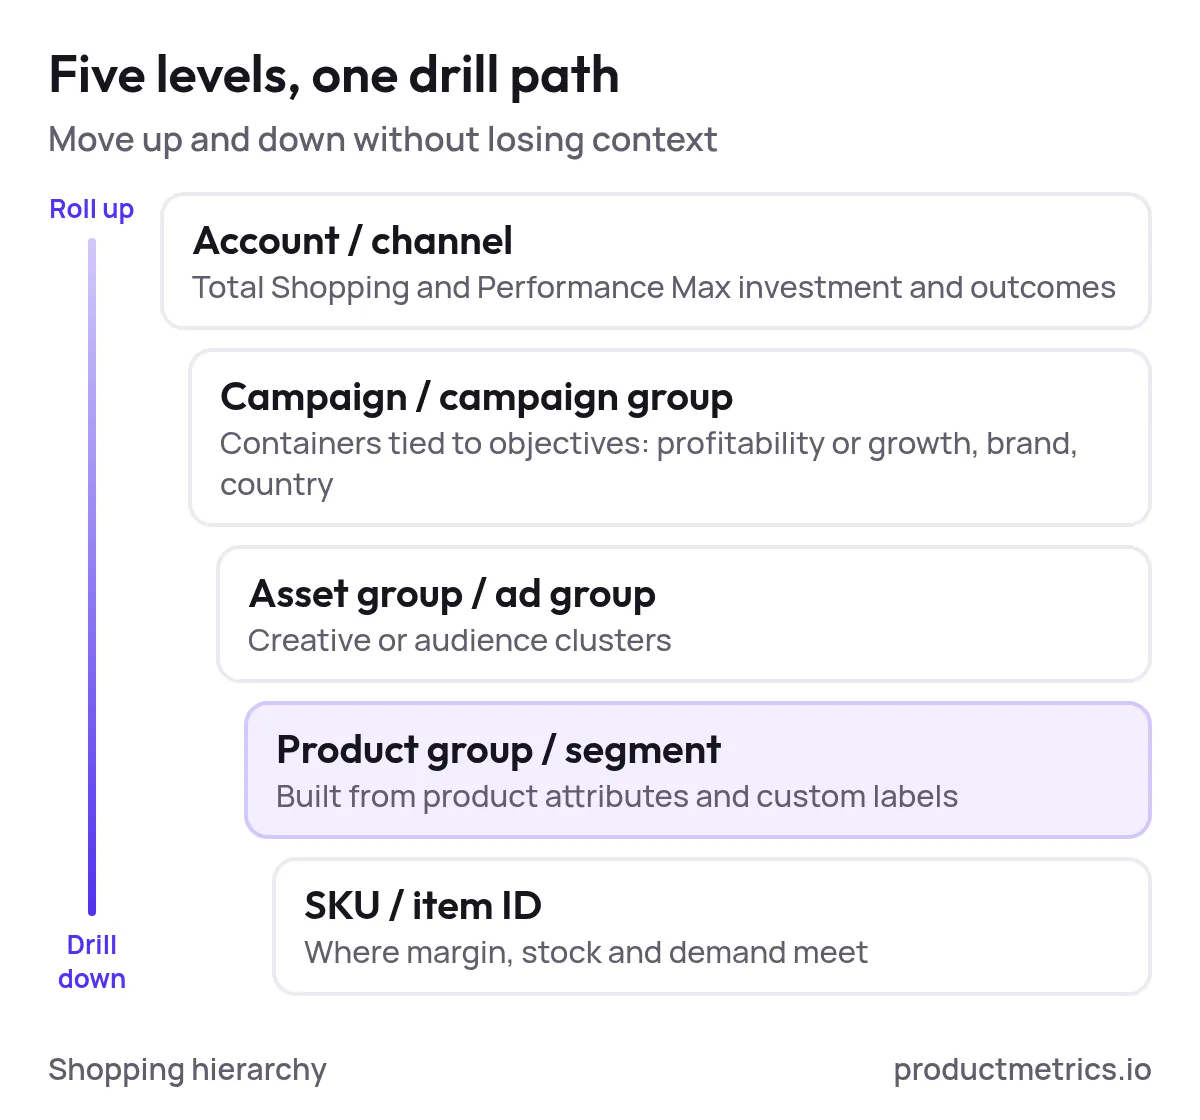
Most advanced Google Shopping setups share a common hierarchy, even if the naming differs:
- Account / Channel level – The total Shopping / PMax investment and outcomes.
- Campaign / Campaign group – Logical containers tied to objectives (e.g., profitability vs growth, brand vs non‑brand, country, or device splits).
- Asset group / Ad group level – Creative or audience clusters, especially in PMax.
- Product group / Segment level – Groups built from product attributes and custom labels (e.g., margin tiers, price bands, lifecycle stages, inventory tiers, performance buckets).
- SKU / Item ID level – Individual products, the atomic level where margin, stock, and demand meet.
Your multi‑level dashboards should let you move up and down this hierarchy without losing context: from a channel view, to a campaign, to a performance segment, to the exact SKUs driving the result.
2.2 Define Your Segmentation Axes
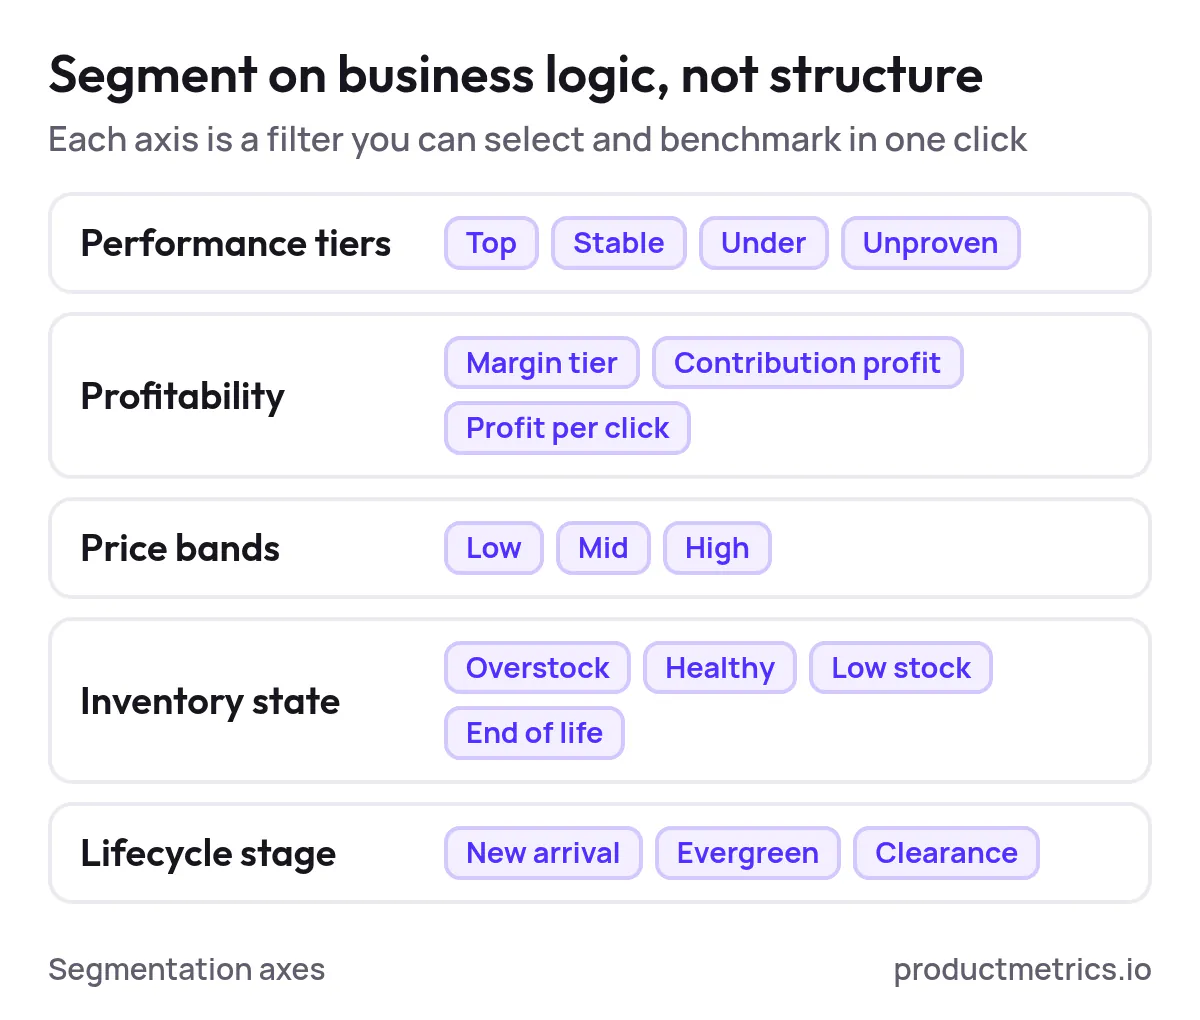
If you run serious Shopping volume, your campaign segmentation is almost never purely structural (category/brand). It’s built around business logic, for example:
- Performance tiers – Top performers, stable performers, underperformers, and unproven products
- Profitability – Margin tiers, contribution profit, or profit per click
- Price bands – Low, mid, and high ASP brackets
- Inventory state – Overstock, healthy stock, low stock, end‑of‑life
- Lifecycle stage – New arrivals, evergreen, clearance
The key is to treat these as first‑class objects in your dashboards, not just labels buried in a feed. Every meaningful segment you buy against should be something you can select, filter, and benchmark in one click.
2.3 Map Entities To Core Questions
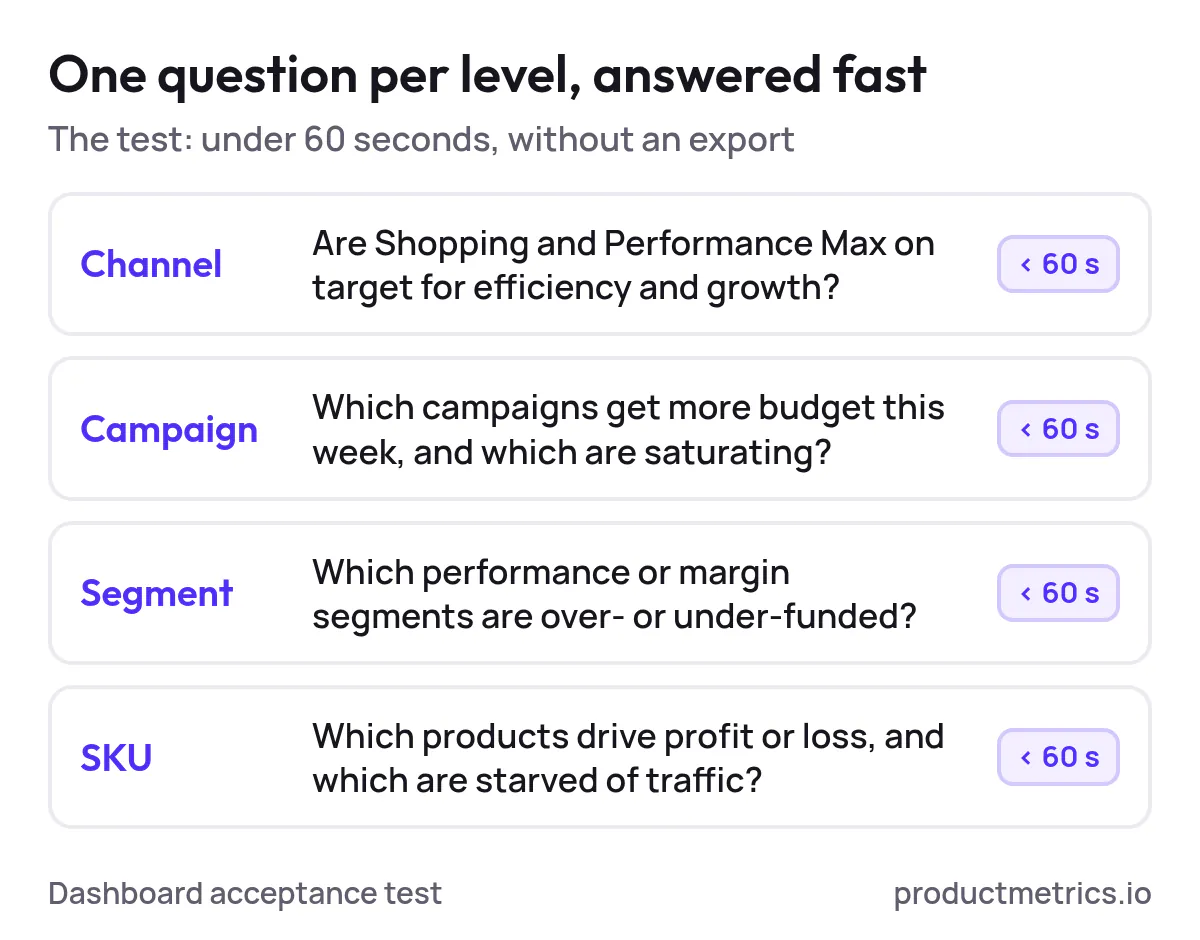
For each level, write down the questions your team needs to answer quickly. Examples:
- Channel: Are Shopping and PMax hitting our overall efficiency and growth targets? Is the channel gaining or losing share versus other paid media?
- Campaign: Which campaigns should get more budget this week? Which ones are saturating or showing diminishing returns?
- Segment: Which performance or margin segments are over‑ or under‑funded? Which ones are slipping versus last week or last month?
- SKU: Which individual products are driving disproportionate profit or loss within each segment? Which are starved of traffic? Which are candidates for price or bid tests?
Your dashboard architecture should be able to answer each of these questions in under 60 seconds without exports.
3. Designing Metric Ladders For Segmented Shopping Dashboards
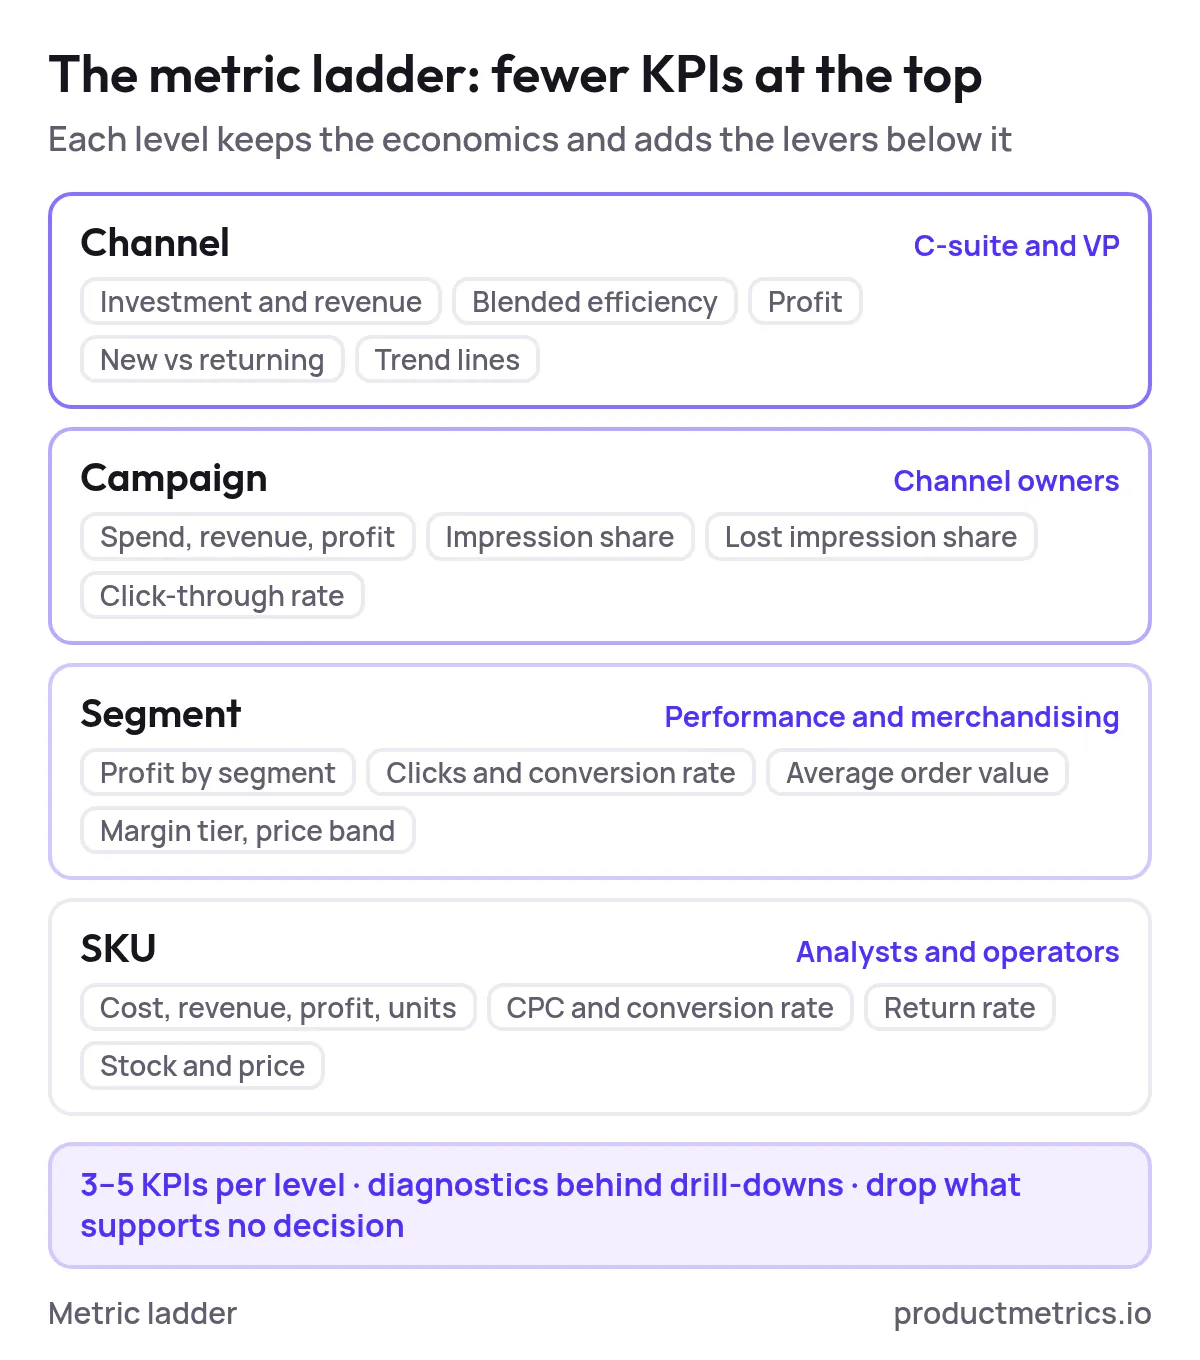
A metric ladder defines which KPIs appear at each level—from the boardroom view down to SKU‑level—and how they relate. This prevents every dashboard from becoming an undifferentiated wall of numbers.
3.1 Channel Level Metrics C Suite And VP Level
At the highest level, you want a clean, stable picture of the Shopping and PMax channel as a whole. Keep this to a tight set of KPIs:
- Investment and revenue
- Blended efficiency (e.g., ROAS or cost as a percentage of revenue)
- Profit or contribution margin (where available)
- New vs returning customer mix
- High‑level trend lines (week‑over‑week, month‑over‑month)
Granularity here is minimal; the goal is to know whether Google Shopping, as a channel, is creating profitable growth.
3.2 Campaign Level Metrics Channel Owners
Campaign‑level views should preserve the core economic signals above, plus a few levers that explain why performance is shifting:
- Spend, revenue, efficiency, and profit per campaign
- Impression share, lost impression share (budget or rank), and click‑through rate
- Device, network, and geo overlays where they materially differ
This level answers: where is performance strong or weak, and where do we have room to push harder or pull back?
3.3 Segment Level Metrics Performance And Merchandising
This is where granular performance tracking in segmented Google Shopping campaigns really starts to pay off.
At the segment (product group) level, you want:
- Spend, revenue, efficiency, and profit by segment
- Volume drivers: impressions, clicks, conversion rate, and average order value
- Structural attributes: margin tier, price band, lifecycle stage, inventory tier
The metric ladder here should make it obvious which segments are punching above or below their weight relative to their strategic importance.
3.4 SKU Level Metrics Analysts And Operators
Finally, at the SKU level, you need enough detail to make specific decisions without drowning in noise. Common metrics include:
- Cost, revenue, profit, and units sold per SKU
- Clicks, CPCs, conversion rate, and refund/return rate (when available)
- Attribution: first‑click vs last‑click behavior, or simple assisted‑conversion signals
- Stock state and pricing relative to segment norms
The job of the SKU view is not to be browsed endlessly. It’s to be filtered and sorted based on the segment‑ and campaign‑level signals so that you can:
- Isolate SKUs dragging down a high‑value segment
- Find hidden winners that deserve more exposure
- Identify candidates for creative, price, or bidding tests
When you design your dashboards, build these ladders explicitly: start with 3–5 KPIs per level, add second‑tier diagnostic metrics behind drill‑downs, and actively remove anything that doesn’t support a decision.
4. Role Based Views Aligning Dashboards With Decisions
The same data should not look the same to everyone. A good multi‑level dashboard system uses shared definitions but different entry points and layouts by role.
4.1 Example Role Matrix
| Role | Primary decisions | Time horizon | Ideal view |
|---|---|---|---|
| CMO / VP Growth | Channel mix, budget allocation, growth vs efficiency trade‑offs | Monthly / quarterly | Channel‑level Shopping vs other paid media, top campaigns and segments, high‑level trends |
| Performance Lead | Budget shifts, bid strategies, test roadmap | Weekly | Campaign and segment views with quick drill‑down to SKUs and experiments |
| Channel Manager (Shopping / PMax) | Daily optimizations, feed and structure changes | Daily | Segment and SKU views filtered by performance tiers, with operational alerts |
| Merchandising / Buying | Range planning, markdowns, stock moves | Weekly | Segments and SKUs with inventory, margin, and sell‑through overlays |
| Analytics / Data | Attribution, modeling, experiment readouts | Ad‑hoc / project-based | Cross‑channel views with experiment panels and deeper segmentation |
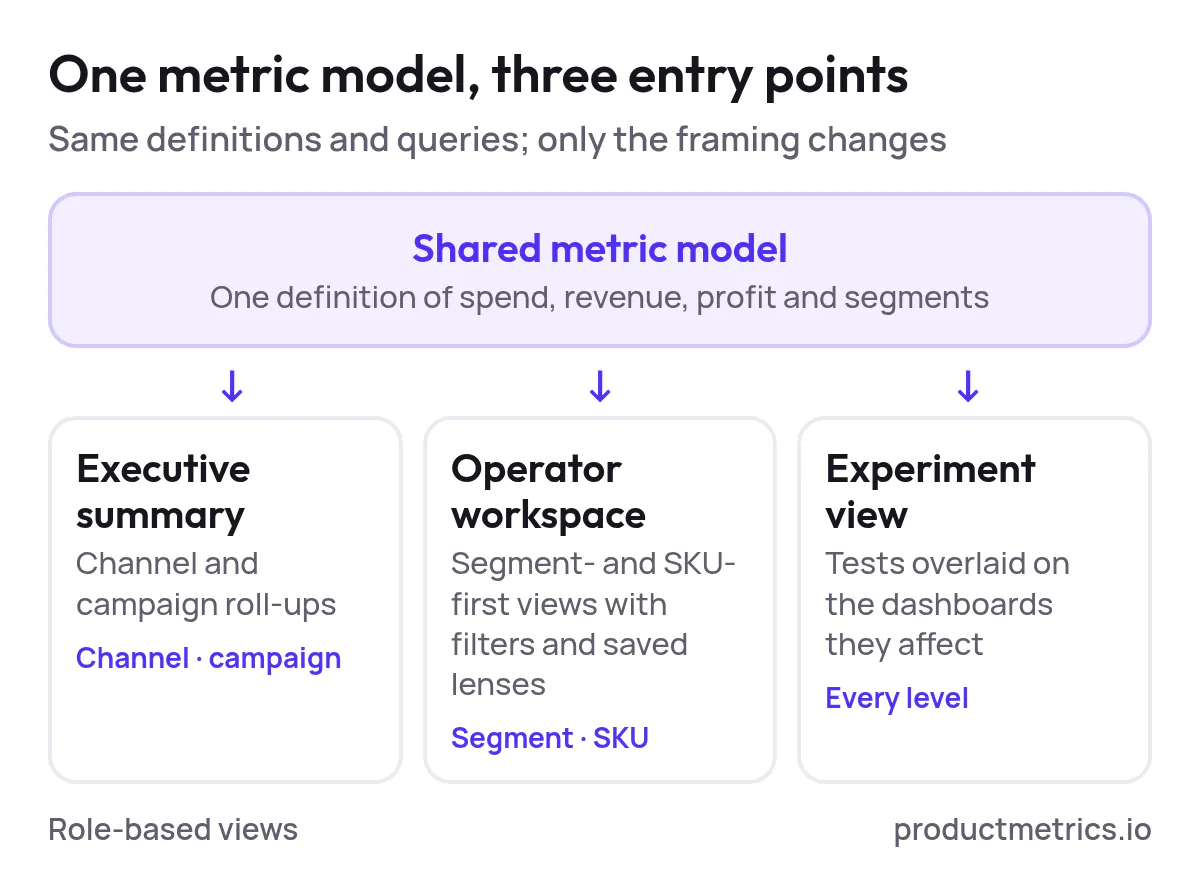
In Productmetrics.io, this typically means starting from a shared metric model and then building:
- Executive summary dashboards – Channel and campaign roll‑ups
- Operator workspaces – Segment and SKU‑first views with filters and saved lenses
- Experiment views – Dedicated panels that overlay tests on top of existing dashboards
The same queries power all of them; only the framing and emphasis changes.
5. Latency Targets How Fresh Does Each Metric Need To Be
Not every decision needs real‑time data. In practice, latency targets (how fresh the data must be) drive a lot of your implementation complexity.
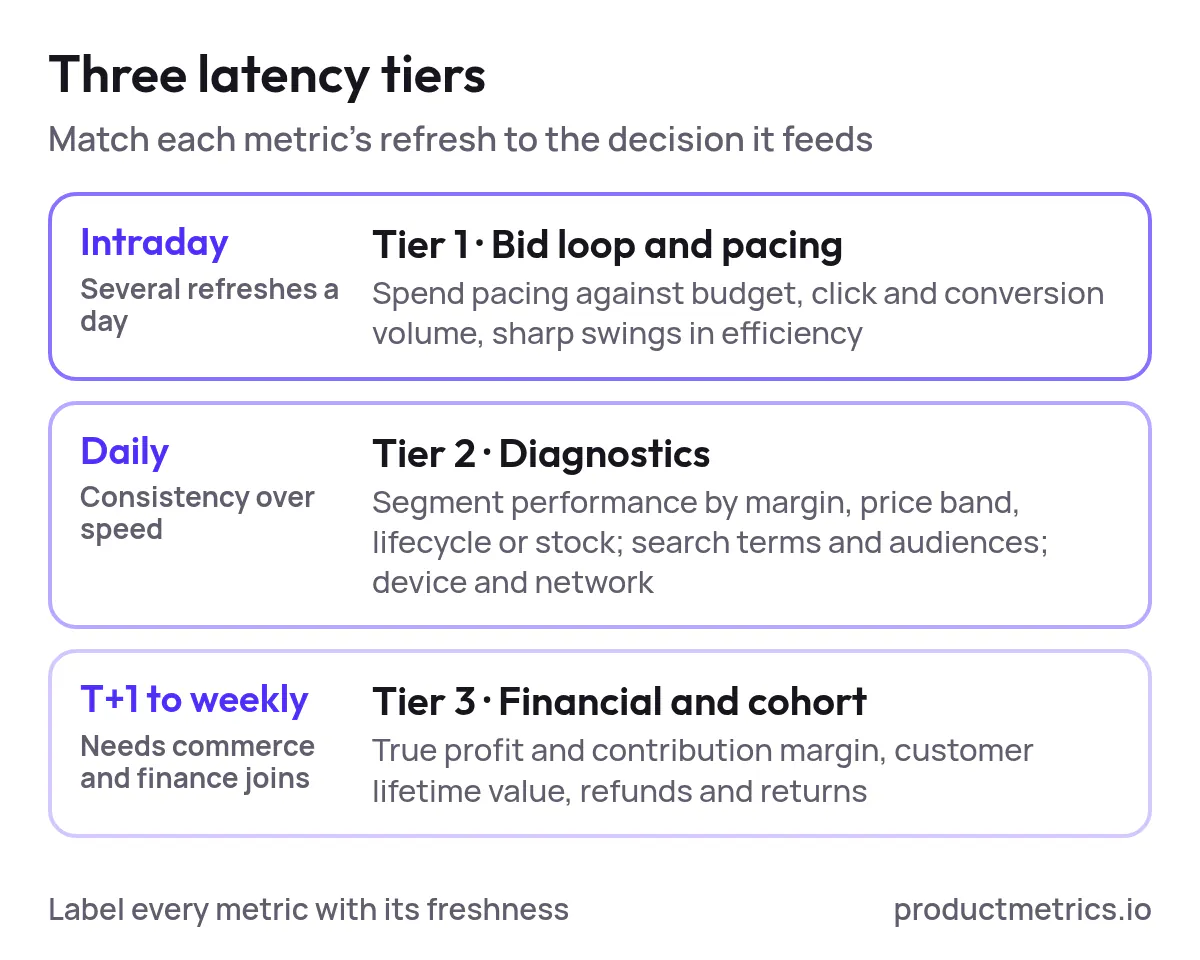
Design your dashboards around explicit latency tiers:
5.1 Tier 1 - Bid Loop And Pacing Metrics Intra Day
These are the signals you use to avoid overspending, underspending, or breaking campaigns:
- Spend pacing vs budget
- Click and conversion volume
- Major swings in efficiency at the campaign or segment level
Aim to refresh these multiple times per day so that channel managers can react quickly without waiting for next‑day data.
5.2 Tier 2 - Diagnostic Metrics Daily
These metrics explain why performance looks the way it does, but they don’t typically demand same‑hour reactions:
- Segment‑level performance by margin tier, price band, lifecycle, or inventory
- Search term or audience composition signals
- Cross‑device and cross‑network breakdowns
Daily refresh is usually enough here. The priority is consistency and reliability, not second‑by‑second precision.
5.3 Tier 3 - Financial And Cohort Metrics T+1 To Weekly
Finally, you have slower, more complex signals that require clean joins with your commerce and finance data:
- True profit and contribution margin by campaign, segment, and SKU
- Customer lifetime value indicators and new vs returning outcomes
- Refunds, returns, and post‑purchase behavior
These can update daily or even weekly, as long as stakeholders understand the cadence. The key is to design dashboards that clearly label which metrics are near‑real‑time and which are delayed, so no one misinterprets them.
When you implement a platform (whether custom or via a tool like Productmetrics.io), bake these latency tiers into your data pipelines and visualization layer from day one.
6. Embedding Experimentation Panels Into Your Dashboards
Most Shopping experimentation lives in slide decks and loose notes. Embedding experimentation directly into your dashboards makes tests part of your operating system, not a side project.
6.1 What An Experimentation Panel Should Show
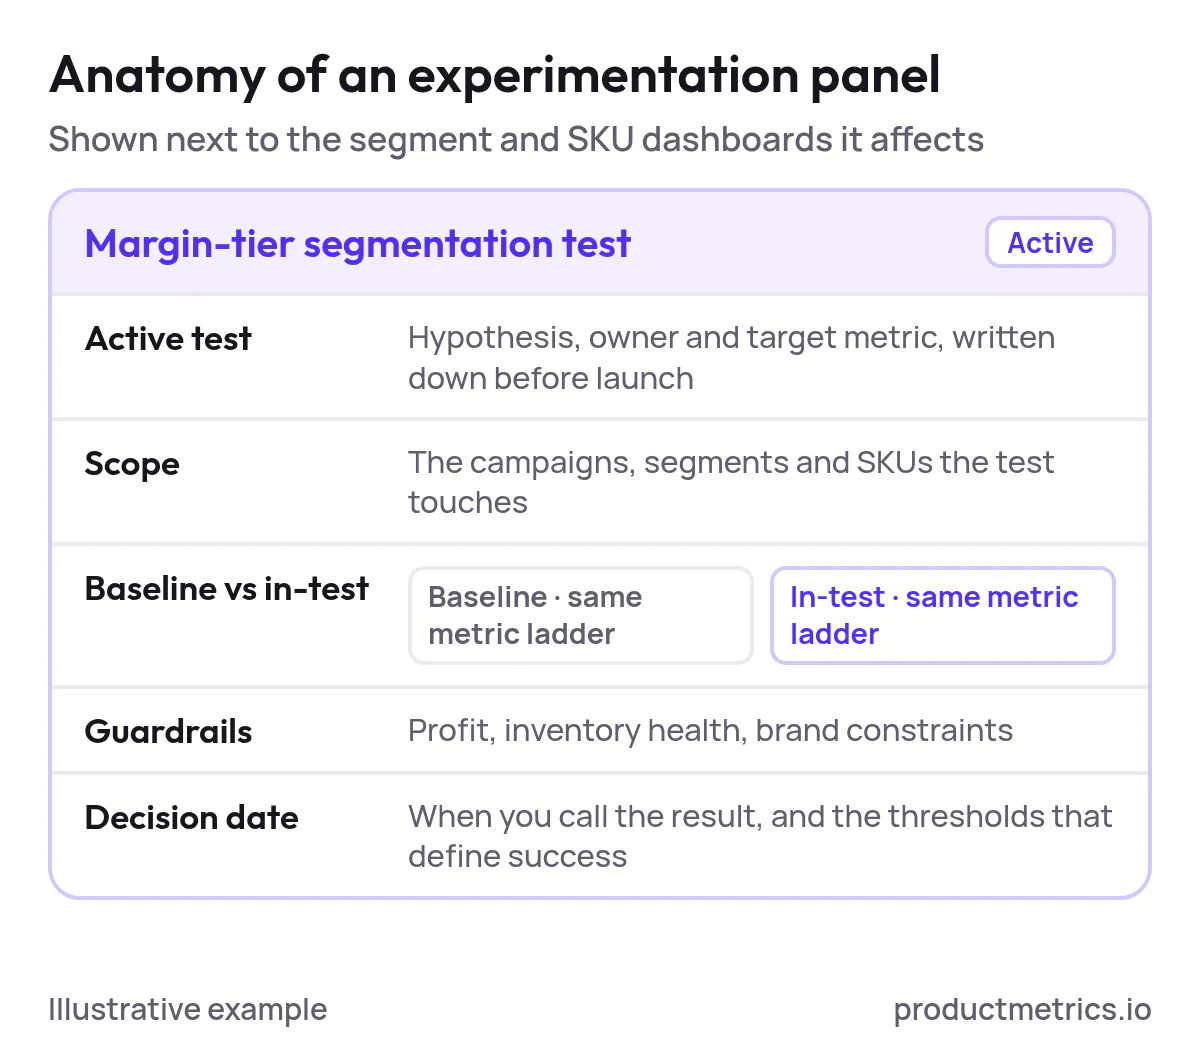
For any area of your Shopping program—campaign structure, bidding targets, pricing, or creative—you want a compact panel that surfaces:
- Active tests – Each with a clear hypothesis, owner, and target metric
- Scope – Which campaigns, segments, and SKUs the test touches
- Baseline vs in‑test performance – Using the same metric ladder as your core dashboards
- Guardrail metrics – Profit, inventory health, or brand constraints the team cares about
- Decision dates – When you’ll call the result and what thresholds define success
This panel should be visible alongside the performance views it affects. For example:
- A bidding‑strategy test panel lives next to your campaign and segment dashboards.
- A margin‑tier segmentation test panel lives next to your segment and SKU dashboards.
- A pricing or promotion test panel lives next to your merchandising and SKU dashboards.
6.2 Linking Tests To Your Metric Ladder
Experiments should be defined in the same language as your dashboards. For example:
- At the channel level, a test might target overall Shopping efficiency or incremental revenue.
- At the campaign level, it might target impression share or cost per incremental conversion.
- At the segment level, it might target profit per click or contribution margin.
- At the SKU level, it might target unit velocity or sell‑through.
By aligning tests to the metric ladder, you avoid situations where test results can’t be reconciled with your regular reporting.
7. Evaluating Tools For Granular Shopping Performance Tracking
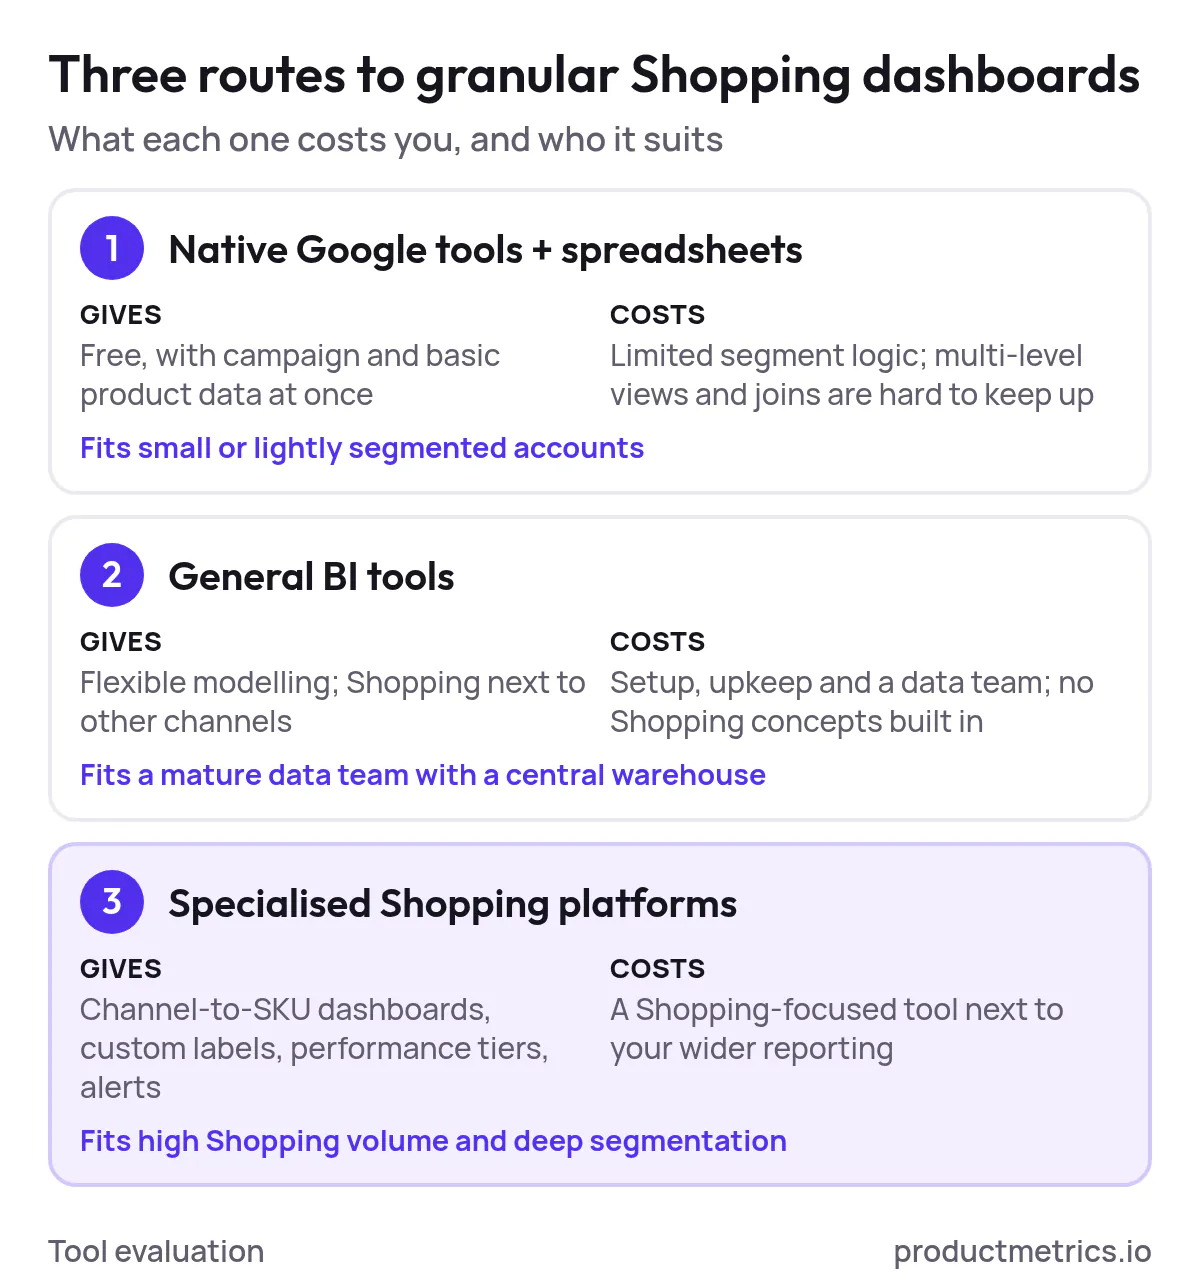
Searchers looking for Google Shopping campaign segmentation solutions with detailed performance dashboards are usually deciding between three broad options:
- Native UIs and spreadsheets
- General BI and analytics tools
- Specialized Shopping optimization platforms
Here’s how to think about each.
7.1 Native Google Tools + Spreadsheets
Pros:
- Free or already included in your stack
- Immediate access to campaign and basic product performance data
Cons:
- Limited ability to model custom segment logic (margin tiers, lifecycle stages, inventory, etc.) across all accounts
- Hard to maintain multi‑level views and consistent joins to commerce or finance systems
- Experiments and annotations tend to live outside the core reporting
This stack is workable for small catalogs or lightly segmented accounts, but it rarely scales for brands with serious volume and complexity.
7.2 General BI Tools
Business intelligence platforms can, in theory, do everything you need: connect ads, commerce, and finance data; build metric models; and visualize multi‑level dashboards.
Pros:
- Extremely flexible modeling and visualization
- Can show Shopping alongside other channels in one place
Cons:
- Significant setup and maintenance effort
- Requires ongoing data engineering and analytics resources
- No Shopping‑specific concepts out of the box (segments, feed attributes, Shopping vs PMax nuances)
This is a good route if you already have a mature data team and want to centralize every channel into a single warehouse.
7.3 Specialized Google Shopping Optimization Platforms
Dedicated Shopping optimization tools—including platforms like Productmetrics.io—focus specifically on granular performance tracking and campaign segmentation.
When comparing solutions for tracking segmented Google Shopping campaign performance at a granular level, look for:
- Multi‑level dashboards from channel to SKU, with consistent metric definitions
- First‑class support for product attributes and custom labels, so you can build segments around margin, price, lifecycle, brand, or inventory without custom engineering each time
- Built‑in performance tiers (e.g., top, stable, underperforming, unproven) with simple ways to re‑bucket SKUs as performance changes
- Experimentation panels and annotations baked into the dashboard experience
- Alerting and workflows that tie dashboards to actions (budget shifts, bid changes, feed edits)
If your current stack feels stretched by your Shopping volume and segmentation, evaluating tools for granular performance tracking in Google Shopping campaign segmentation is usually one of the highest‑ROI moves you can make.
8. Blueprint Implementing Multi Level Shopping Dashboards In 30–60 Days
Whether you build on top of Productmetrics.io or another stack, the implementation path tends to follow a similar pattern.
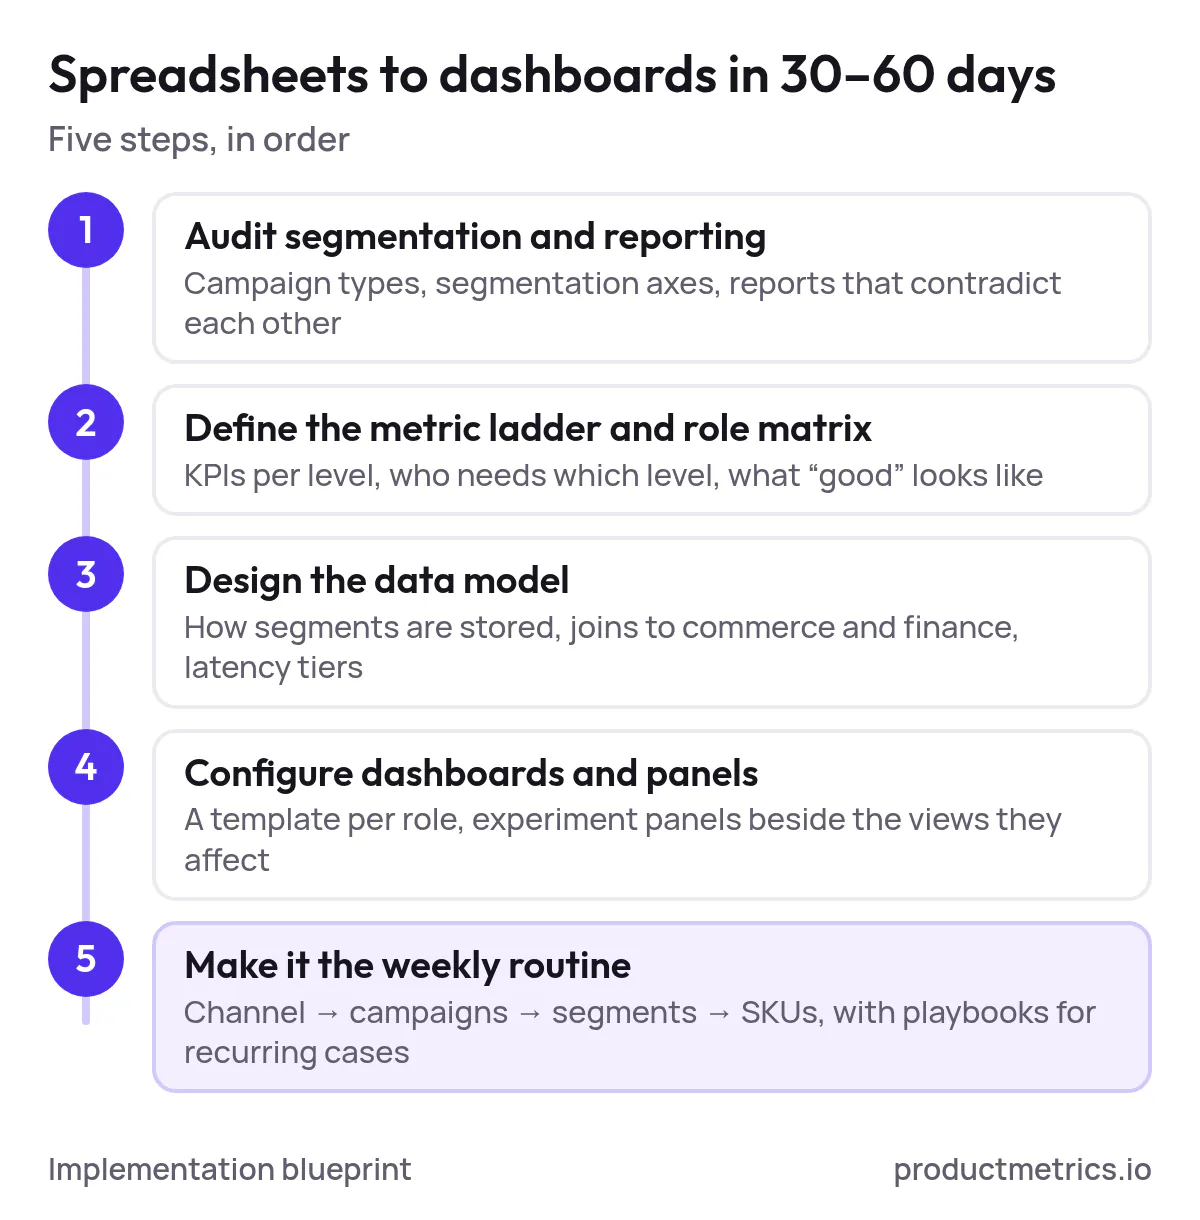
Step 1 Audit Your Current Segmentation And Reporting
- List all campaign types (Standard Shopping, PMax, remarketing) and their objectives.
- Document every major segmentation axis you use today (performance tiers, margin, price, lifecycle, inventory, brand, category).
- Inventory your existing reports and dashboards; note where they break or contradict each other.
Step 2 Define Your Metric Ladder And Role Matrix
- Agree on the small set of KPIs that matter at each level (channel, campaign, segment, SKU).
- Map which roles need which levels and which time horizons.
- Decide what “good” looks like for each KPI at each level (targets, thresholds, and alert conditions).
Step 3 Design Your Data Model
- Decide how you will represent segments (via custom labels, external lookup tables, or a dedicated product attributes store).
- Plan the joins between ad data, product catalog, commerce platform, and finance system.
- Define your latency tiers and which pipelines power which dashboards.
Step 4 Configure Dashboards And Experimentation Panels
- Build or configure templates for each role: executive, performance lead, channel manager, merchandising, analytics.
- Add experiment panels next to the dashboards they influence.
- Implement a lightweight taxonomy for naming tests so they’re searchable and consistent.
Step 5 Operationalize The Workflow
- Establish a weekly Shopping performance ritual: review channel → campaigns → segments → SKUs using the new dashboards.
- Create simple playbooks for recurring situations (e.g., segment significantly over target for two weeks → increase budget; under target → investigate SKU mix and bids).
- Train the wider team on how to use the dashboards and how to request new views or experiments.
Within one or two months, you should move from reactive, spreadsheet‑driven Shopping management to a system where performance, segmentation, and experimentation are all visible in one place.
9. Where Productmetrics.io Fits
Productmetrics.io is built for brands that treat Google Shopping as a system to design—not just a campaign to tweak.
In practice, that means helping you:
- Build multi‑level performance dashboards that mirror your campaign and segmentation strategy from channel to SKU.
- Turn your custom labels and product attributes into actionable performance segments, not just feed decorations.
- Layer experimentation panels directly onto your core views, so tests are part of your normal workflow.
If you’re actively searching for top‑rated Google Shopping optimization tools for granular campaign segmentation and tracking, or you’re simply outgrowing spreadsheets and native dashboards, it’s worth exploring whether Productmetrics.io can become the performance hub for your Shopping program.
Next step: Talk to the Productmetrics.io team about your current Google Shopping structure, and map it to a concrete dashboard and experimentation architecture. From there, you can decide whether to implement it in‑house or partner for a faster path to reliable, granular performance tracking.
Written by
Berend Vrakking, Founder of Product Metrics
1M+ products analysed · Nominated at the Dutch Search Awards for Best Measurement Campaign (2023) and Best Use of Data (2024)
Keep reading.
Custom Label Intelligence: Segment, Bid, and Measure Granularity In Google Shopping
Custom Label Intelligence for Google Shopping: a five-slot label schema, label-level dashboards and an experimentation ladder for Shopping and Performance Max.
The 2026 Buyer’s Guide to Google Shopping Campaign Segmentation Platforms (US)
The 2026 Buyer’s Guide to Google Shopping Campaign Segmentation Platforms: segmentation and SKU-level tracking for US Shopping teams.
Where to Buy Google Shopping Segmentation Software With Granular Analytics Pricing Trials And RFP Checklist
Where to buy Google Shopping segmentation software with granular analytics: four vendor types, pricing models, trial scope, onboarding and an RFP checklist.
See which of your products to push, fix or pause. Start with your own products, or a 30-second estimate.
Check one product first: work out its break-even ROAS in the calculator. Then see where all your products stand.
Questions, or want to spar about your products? Book a demo: a video call with Berend, then a demo account.