
SKU-Level Truth: Tracking Performance by Product, Product Group, and Segment in Google Ads
SKU-Level Truth in Google Ads: track Shopping and Performance Max per product, product group and segment, and reconcile Google Ads, GA4 and your warehouse.
When your Google Shopping campaigns are segmented by brand, price band, margin, audience, and lifecycle, performance can look great in aggregate—while a long tail of SKUs quietly bleeds budget.
SKU-level truth is what separates guesswork from confident, scalable growth. It means you can answer, in seconds:
- Which individual products are driving profit in each segment?
- Which product groups are subsidizing weak SKUs?
- How Google Ads, GA4, and your data warehouse disagree—and how to reconcile them.
This guide walks through a practical, platform-agnostic methodology for reliable SKU-level and product-group analytics in Google Shopping, then shows how ProductMetrics.io can operationalize it end-to-end.
1. Why SKU-Level Truth Is Non Negotiable for Segmented Shopping
Most ecommerce teams start with a single Shopping or Performance Max campaign, then add layers of segmentation over time:
- Brand vs. non brand
- High vs. low margin
- New arrivals vs. evergreen
- Price bands or collections
- Audience segments (remarketing, high LTV, etc.)
At that point, you’re no longer asking, “Is Shopping working?” You’re asking, “Which SKUs and segments are actually profitable?”
Two things usually go wrong:
- Reporting stays at the campaign or product-group level. Performance can look acceptable in the aggregate, while a handful of SKUs drive almost all returns and the rest of the catalog is dead weight.
- Optimization is done on incomplete data. Bids and budgets are adjusted on ROAS alone instead of margin, inventory, and lifetime value.
Without SKU-level truth across segments, you’re making six- and seven-figure budget calls on averages.
2. How Google Shopping Actually Organizes Your Catalog
Before designing tracking, you need a clear mental model of how Shopping sees your products.
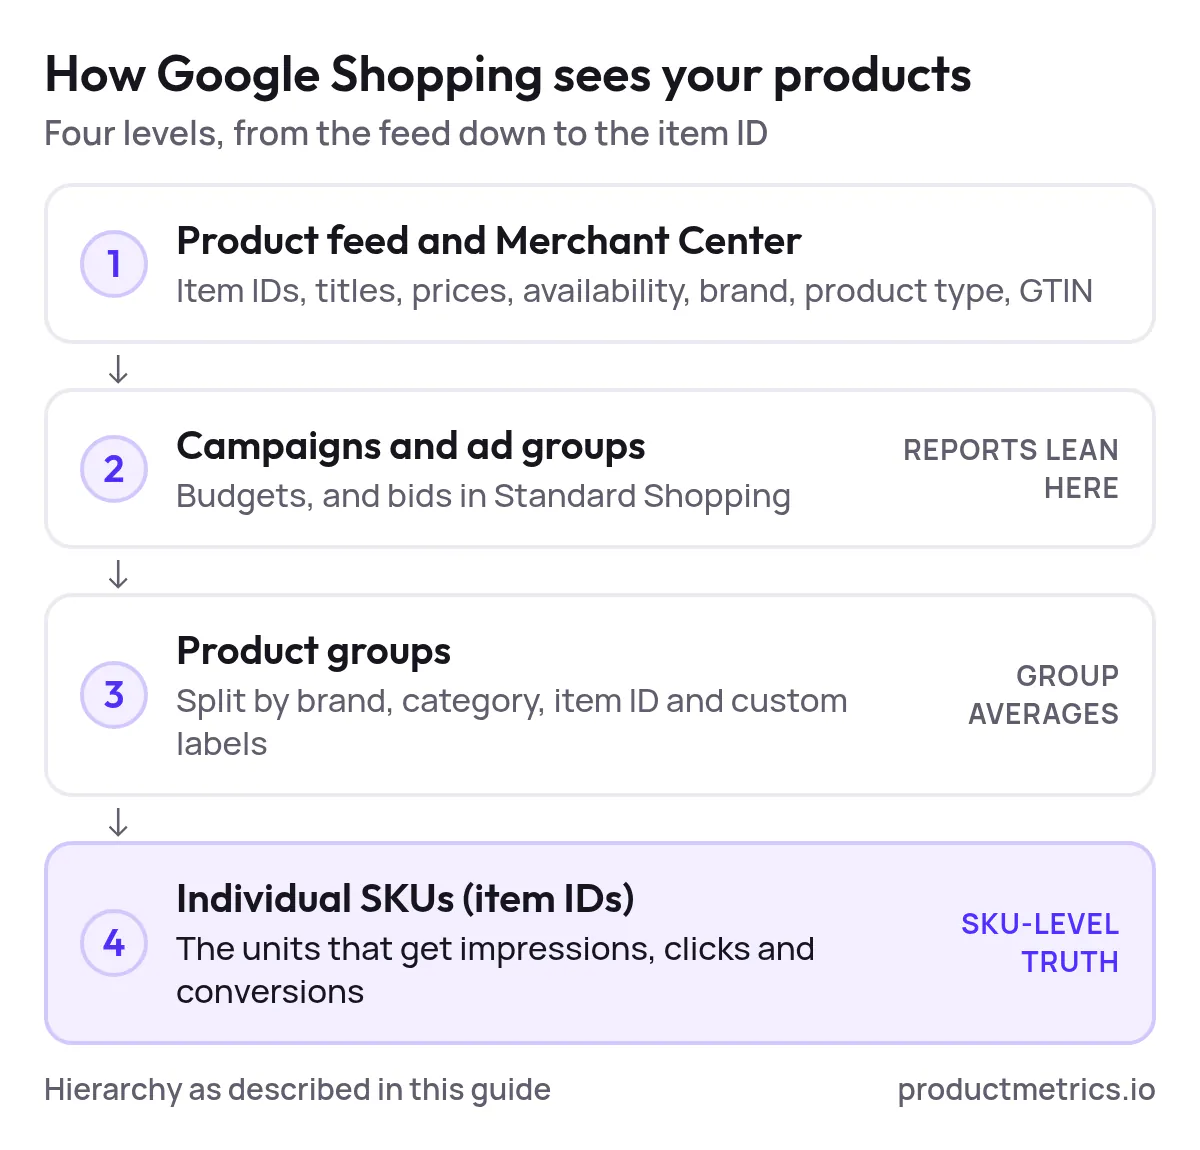
At a high level, the hierarchy looks like this:
- Product feed & Google Merchant Center – Your source of truth for product IDs, titles, prices, availability, and attributes (brand, product type, GTIN, etc.).
- Campaigns & ad groups – Where you set budgets and (for Standard Shopping) bids.
- Product groups – Subdivisions of your catalog within ad groups, typically created using attributes like brand, category, item ID, and custom labels.
- Individual SKUs (item IDs) – The atomic units that actually receive impressions, clicks, and conversions.
Best-practice account structures group SKUs into product groups based on your merchandising and profit model—for example by brand, product type, price band, or custom labels for margin tiers and lifecycle. This sets you up for granular bidding and budget control.
But Google Ads reporting still nudges you toward aggregated views: campaign, ad group, and product-group averages. To get real clarity, you need a tracking strategy that deliberately cuts across three layers of analysis.
3. The Three Layers of Performance Tracking
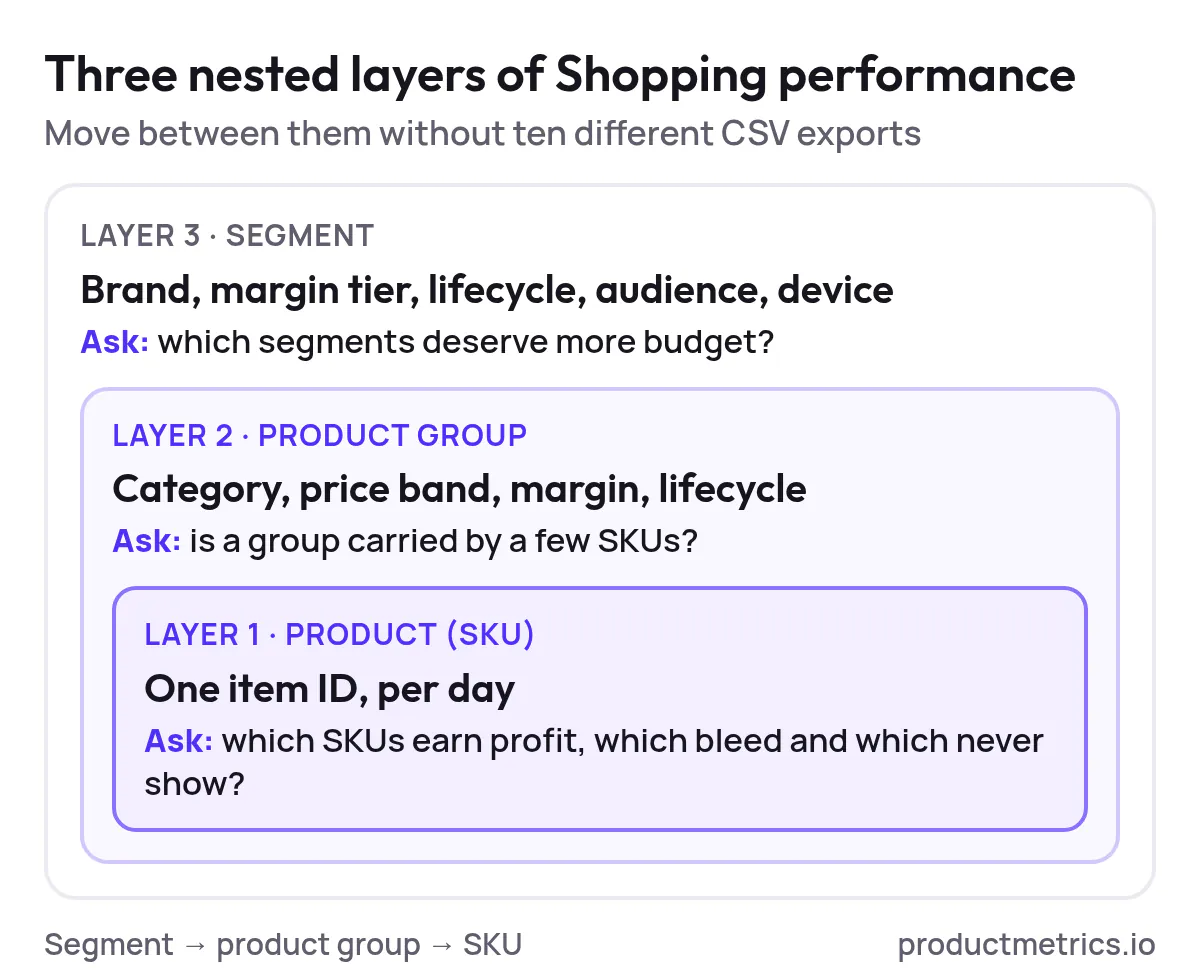
Think of Google Shopping performance in three nested layers:
3.1 Product (SKU) Level
Questions at this layer:
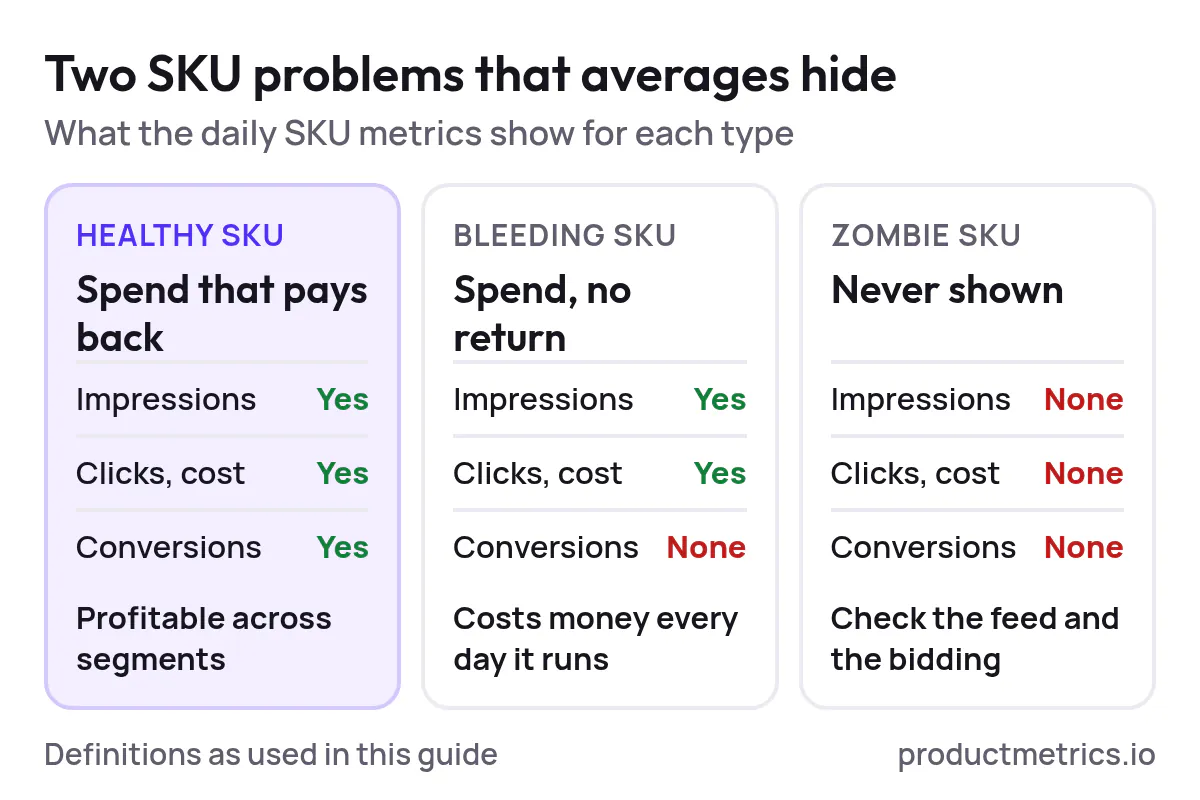
- Which SKUs are consistently profitable across segments?
- Which SKUs get spend but no conversions (“bleeding SKUs”)?
- Which SKUs never get impressions (“zombie SKUs”) and might have feed or bidding issues?
You need, per SKU and per day:
- Impressions, clicks, cost
- Conversions and revenue
- Margin (cost of goods, shipping, fees) where possible
- Any key merchandising attributes (brand, category, etc.)
3.2 Product Group Level
Product groups are where bidding decisions are usually made, especially in Standard Shopping. Well-structured product groups reflect how you actually sell and make money—by category, price band, margin, and lifecycle.
Key questions:
- Are bids and budgets aligned with the product group’s real profit potential?
- Are some product groups carried by a tiny subset of SKUs?
- Are there product groups where almost all SKUs underperform and should be restructured or excluded?
3.3 Segment Level
Segments cut across campaigns and product groups. Common segmentation dimensions:
- Brand vs. non brand
- Margin tier (high / medium / low)
- Lifecycle (new, evergreen, clearance)
- Audience (prospecting vs. remarketing)
- Device, geo, or channel (Search / Shopping tab / PMax mixes)
At this layer, you’re asking:
- Which segments deserve incremental budget?
- Where is Smart Bidding over favoring cheap clicks vs profitable SKUs?
- How do different segments respond to creative and bidding experiments over time?
Your tracking model should let you move fluidly between segment → product group → SKU, without exporting ten different CSVs every time.
4. Common Data Gaps That Break SKU-Level Analytics
When teams try to answer SKU-level questions with native Google Ads or GA4 alone, they usually run into at least three gaps:
- Inconsistent identifiers. SKUs in your ecommerce platform don’t always line up with
item_idin GA4 or item IDs in your Merchant Center feed. Any mismatch breaks joins across systems. - No reliable margin data. ROAS looks great on paper, but you’re not enriching ad performance with cost-of-goods or shipping data, so “profitable” campaigns might be losing money.
- Fragmented attribution. Google Ads, GA4, and your backend systems all have different attribution windows, models, and time zones. Without deliberate reconciliation, you’ll see conflicting revenue figures for the same campaigns.
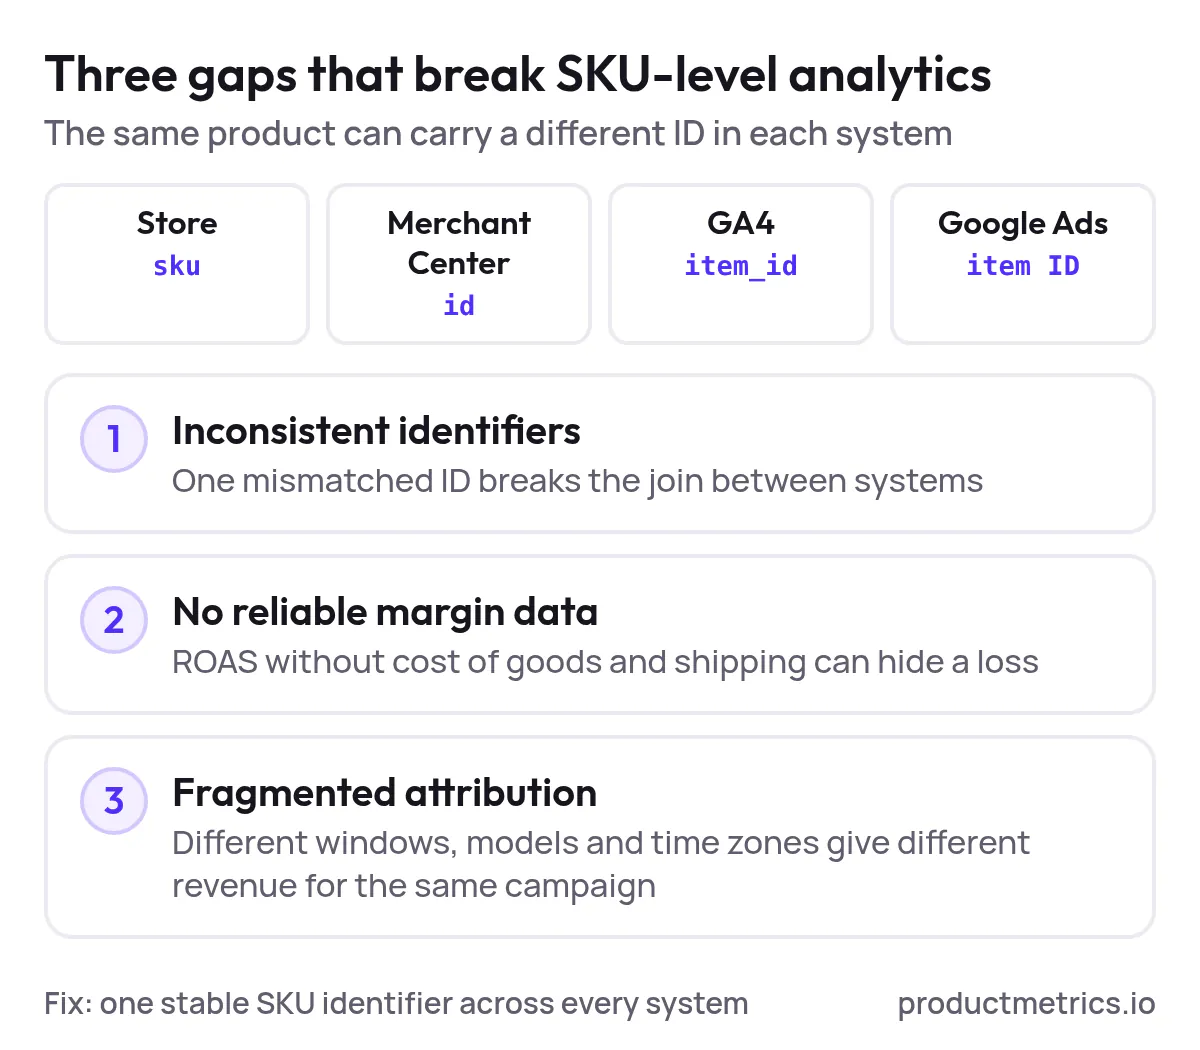
The solution is to design your tracking around a single, stable SKU identifier and treat each platform (Ads, GA4, BigQuery/warehouse) as a different “view” of the same underlying events.
5. Designing Reliable SKU-Level Tracking
Here’s a practical blueprint you can implement with or without a dedicated platform.
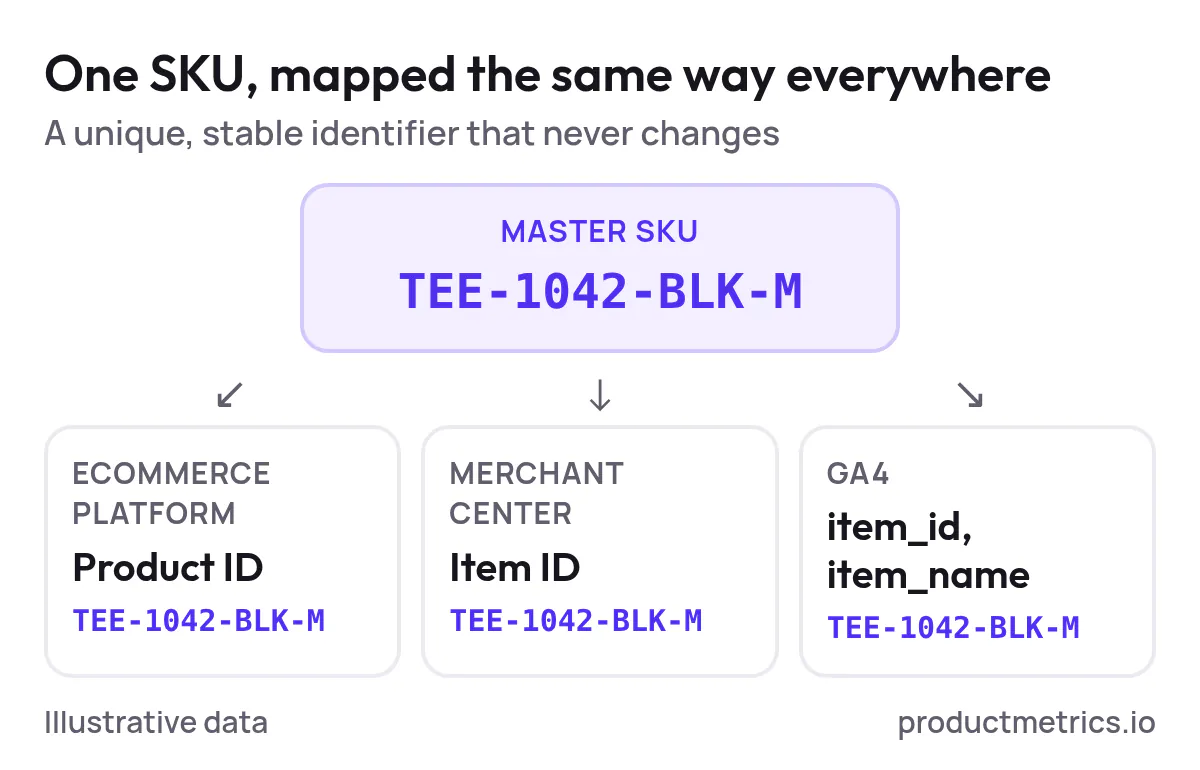
Step 1: Clean and Standardize Your SKUs
- Ensure every sellable product has a unique, stable SKU.
- Map that SKU consistently to:
- Ecommerce platform product IDs
- Merchant Center item IDs
- GA4
item_idanditem_name
- Avoid overloading SKUs with variant logic that changes over time; keep them as immutable identifiers wherever possible.
Step 2: Structure Product Groups for Analytics, Not Just Bidding
Leverage attributes like Brand, Product Type, Channel, and Custom Labels to organize product groups in a way that mirrors your merchandising strategy. This allows for more granular bid control and cleaner analytics by category, price band, and margin tier.
As you do this, define a segment taxonomy you’ll use everywhere:
segment_type(e.g., margin_tier, lifecycle, audience)segment_value(e.g., high_margin, clearance, remarketing)
Encode this consistently in custom labels so segments can be recreated in your reporting layer.
Step 3: Implement Robust Conversion Tracking
You can’t measure or optimize Shopping without trustworthy conversion tracking. Set up conversion actions that represent meaningful business outcomes—typically purchase events with revenue value—and ensure they fire reliably for all devices and channels.
For ecommerce, include:
- Order ID
- SKU(s) purchased
- Quantities and item-level revenue
- Taxes, shipping, and discounts if available
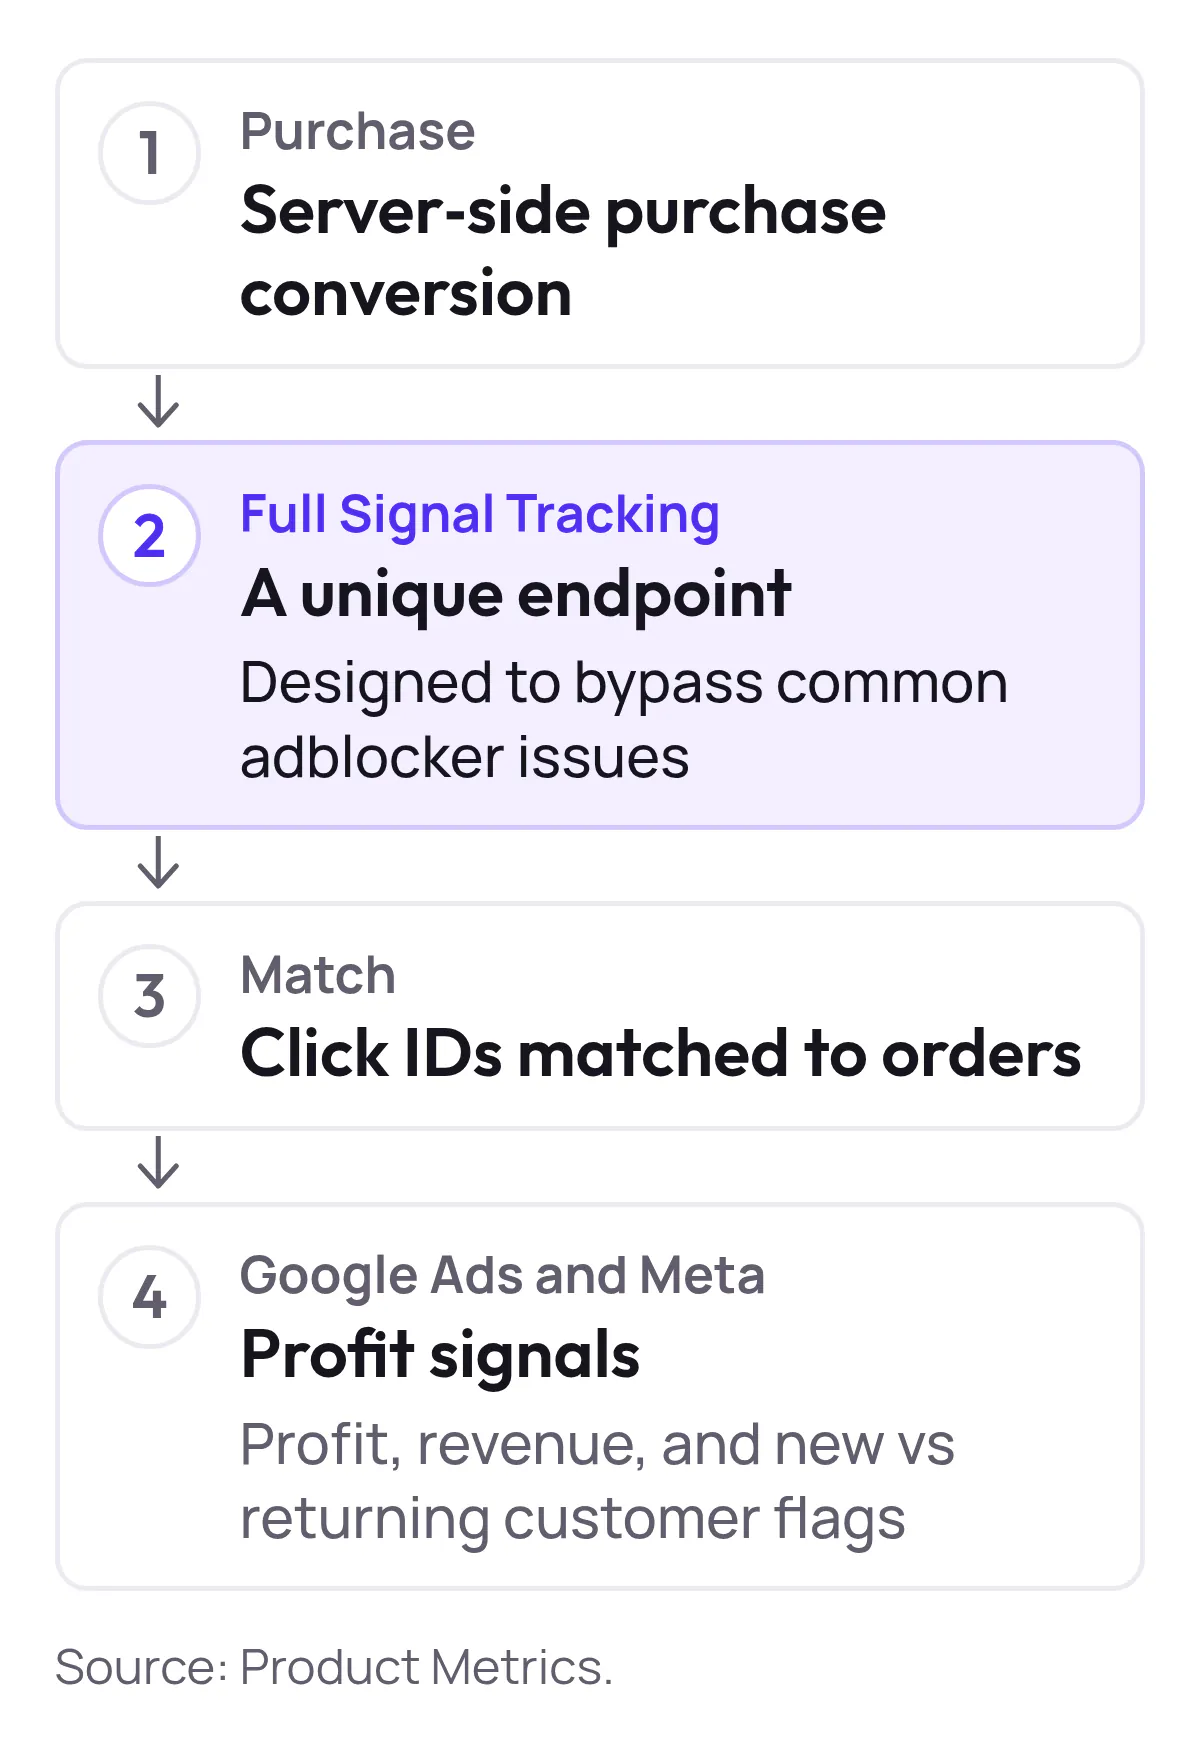
This data should be available both in Google Ads (for bidding) and in your analytics stack (GA4 and warehouse) for deeper analysis.
Step 4: Centralize Data in a Warehouse (e.g., BigQuery)
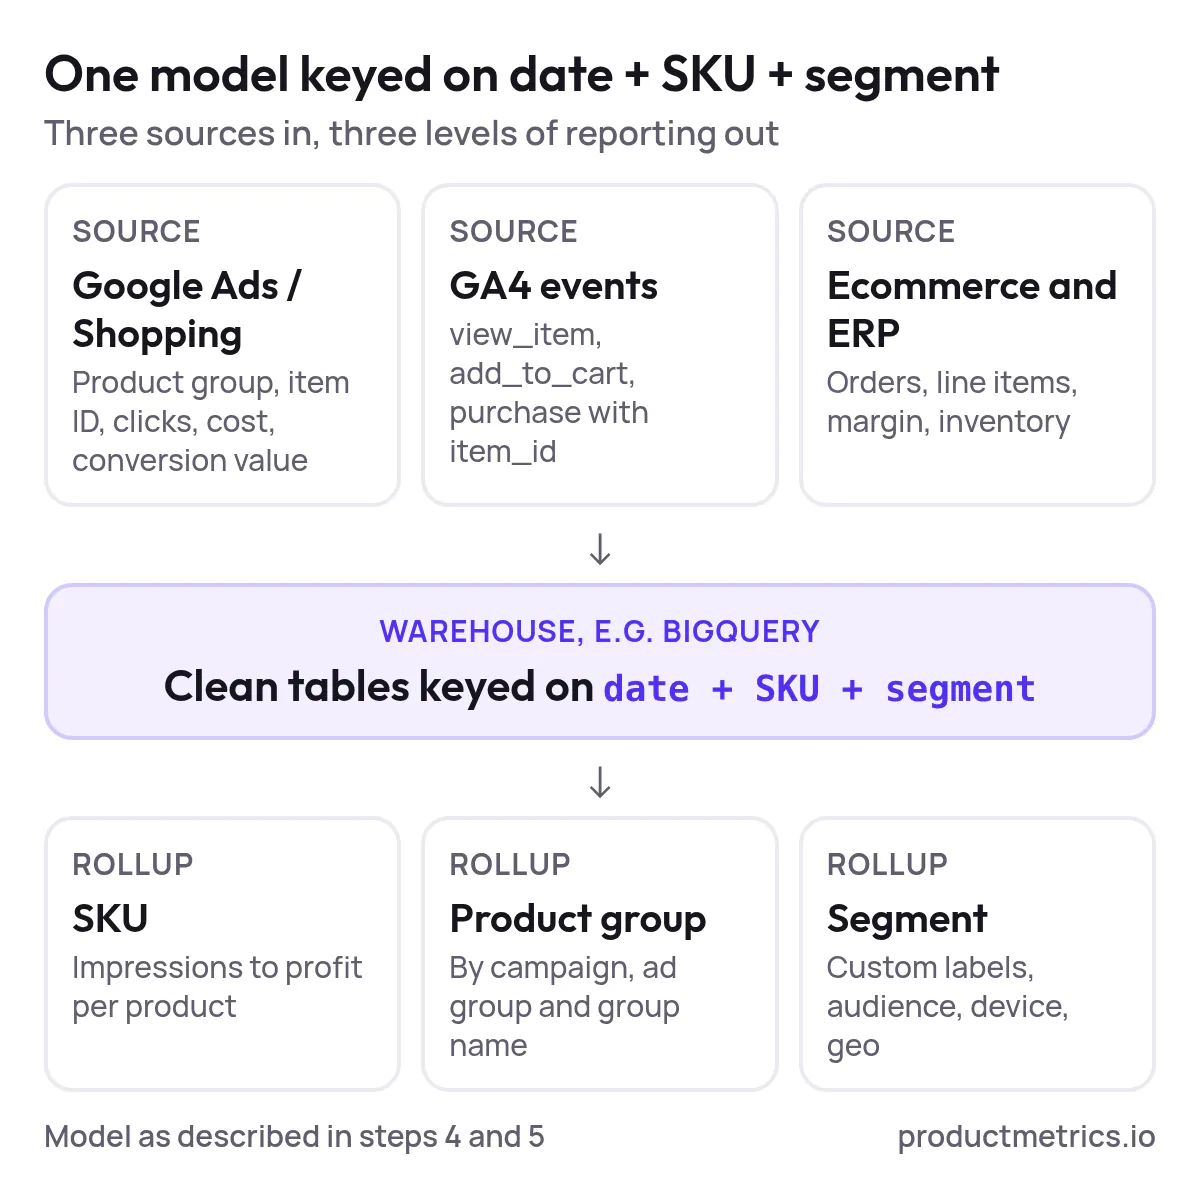
To reconcile metrics across systems and gain flexible reporting, push raw data into a central warehouse such as BigQuery:
- Google Ads / Shopping data – Campaign, ad group, product group, item ID, clicks, cost, conversions, conversion value.
- GA4 events – E commerce events (
view_item,add_to_cart,purchase) withitem_idand user/session attributes. - Ecommerce and ERP data – Orders, line items, margin, inventory, and customer records.
Model these into a set of clean tables keyed on date + SKU + segment. That’s the foundation for reliable multi-level reporting.
Step 5: Build a Multi Level Performance Model
With clean data in place, create a model (or let a platform do it) that can answer for any date range:
- SKU-level metrics: impressions, clicks, cost, conversions, revenue, profit.
- Product-group rollups: by campaign, ad group, and product-group name.
- Segment rollups: by custom-label segments, audience type, device, geo, etc.
Professional agencies commonly solve this with custom dashboards that pull data from Google Ads and ecommerce platforms, so stakeholders can see the correlation between ad spend and revenue at multiple levels in real time.
A platform like ProductMetrics.io bakes this logic in, so you don’t have to maintain custom SQL or BI pipelines.
6. Reconciling Google Ads, GA4, and BigQuery
Once you centralize data, you’ll notice that Google Ads, GA4, and your warehouse do not agree out of the box. That’s expected.
Design your reconciliation around these principles:
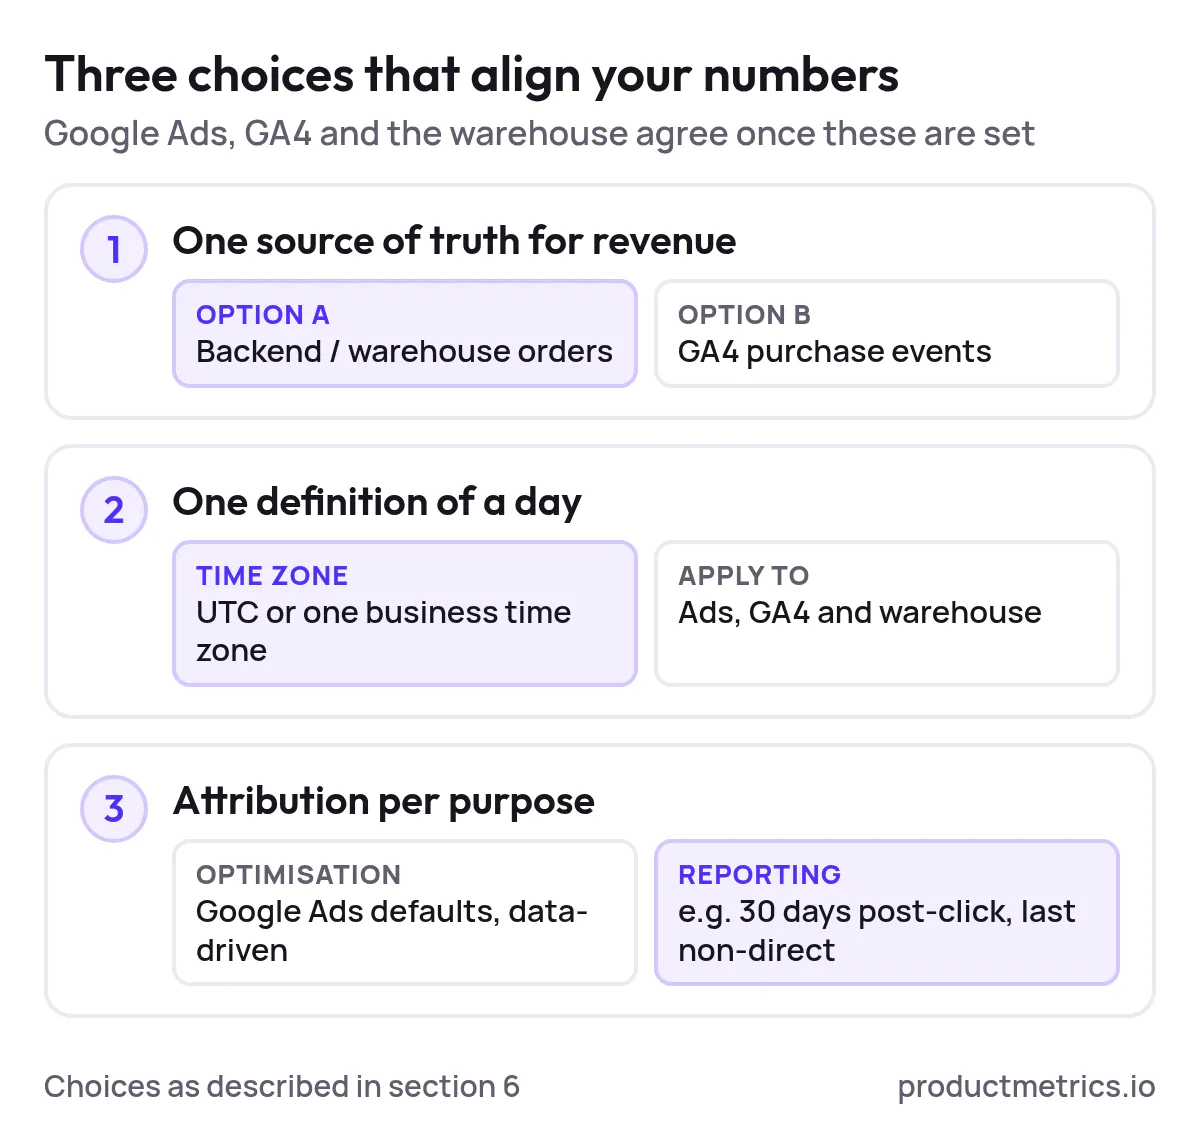
6.1 Pick a Primary Source of Truth for Revenue
We recommend one of two options:
- Backend/Warehouse truth: Use transactional data (orders from your ecommerce platform) as the master record for revenue and margin by SKU, then attribute it back to ads using click IDs or last non direct touch.
- GA4 truth: Use GA4’s purchase events as the master record for revenue, with Ads conversions used primarily for bidding feedback.
Whichever you choose, consistently align your dashboards and decision making to that source.
6.2 Normalize Time Zones and Date Logic
- Standardize all timestamps to UTC or a single business time zone.
- Decide whether a “day” in your reporting runs on the user’s local time, your store’s time zone, or Google Ads’ configured time.
- Apply that consistently across Ads, GA4, and the warehouse.
6.3 Align Attribution Windows and Models
- For optimization, you may let Google Ads use data driven attribution and its default conversion windows.
- For reporting, define a unified window (for example, 30 days post click) and a straightforward model (such as last non direct click) to compare SKUs and segments apples to apples.
Your warehouse becomes the place where all of these choices are made explicit rather than being hidden inside black box UIs.
7. Designing Experiments for Segmented Shopping Structures
With SKU-level truth and a reconciled data model, you can finally run serious experiments on your Shopping structure instead of debating hunches.
7.1 Define Clear Structural Hypotheses
Examples:
- Splitting high margin SKUs into their own campaigns will improve overall profit at the same ROAS.
- Separating branded from non branded queries (via campaign structure and negatives) will reveal under invested non brand SKUs.
- Moving top SKUs from Standard Shopping into a dedicated PMax campaign will increase new customer acquisition at acceptable CAC.
Each hypothesis should specify:
- Which SKUs or product groups are in scope
- What structural change you’ll make (campaign split, new product-group strategy, audience layering, etc.)
- The primary KPI (e.g., contribution margin per SKU, new customer ROAS)
7.2 Use Clean Control and Test Groups
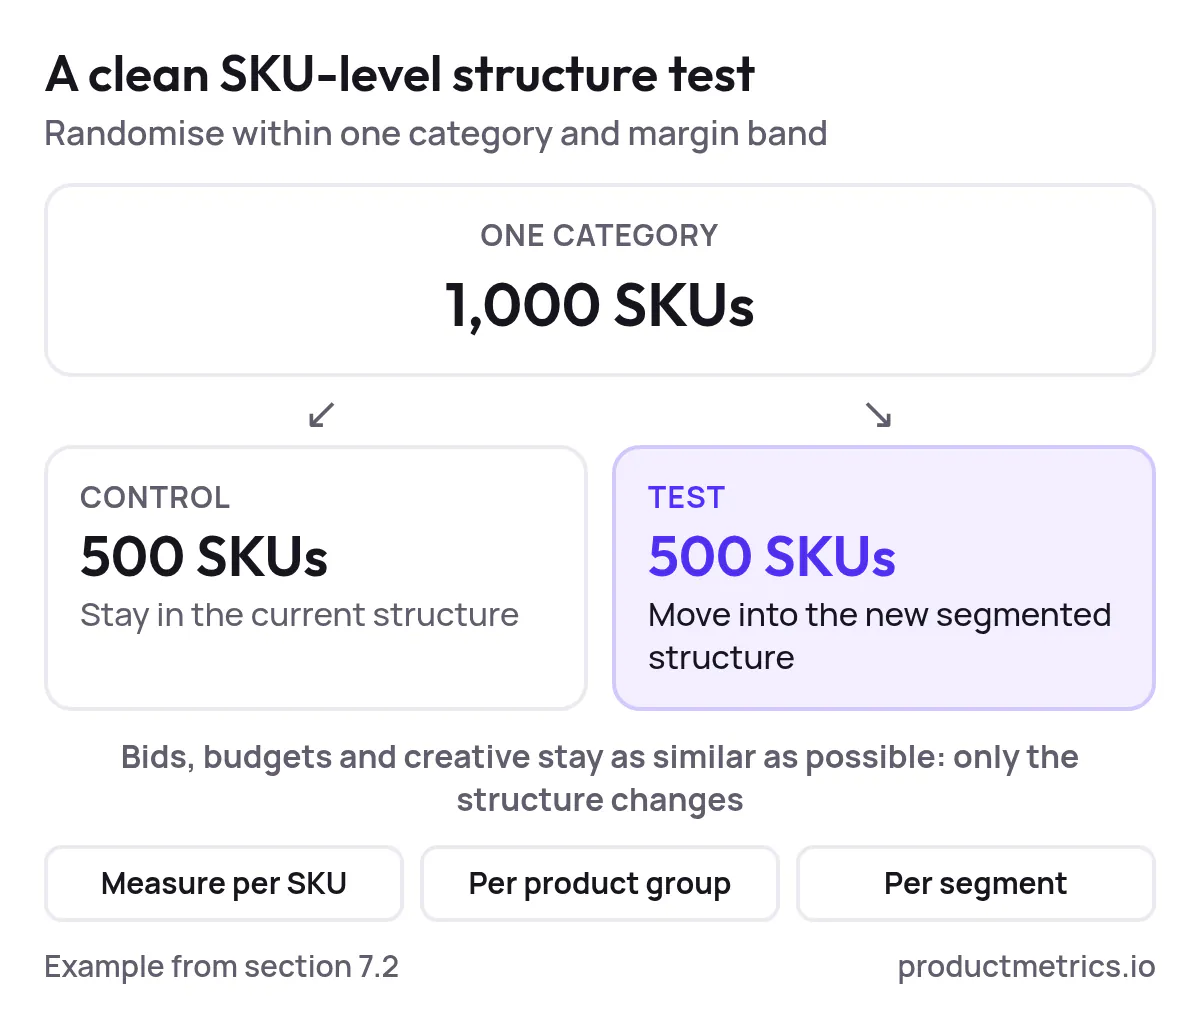
Whenever possible, randomize at the SKU or product group level within the same category and margin band to avoid bias.
Example:
- For a category of 1,000 SKUs, assign 500 SKUs to remain in the current structure (control) and 500 to move into a new segmented structure (test).
- Keep bids, budgets, and creative as similar as possible across control and test; only the structure changes.
7.3 Measure at the Right Layer
- SKU level tells you which products benefit or suffer most from the new structure.
- Product-group level shows whether your new grouping logic produces higher efficiency or just shuffles spend.
- Segment level reveals whether the structural change really helped the strategic segments you care about (e.g., high margin or new customer segments).
Advanced teams tie this directly to profit: agencies focused on high SKU catalogs routinely report on product level and SKU level attribution, margin, and seasonality in one view, then optimize budgets by product group, audience, and channel.
8. What to Look for in a Platform for Granular Google Shopping Tracking
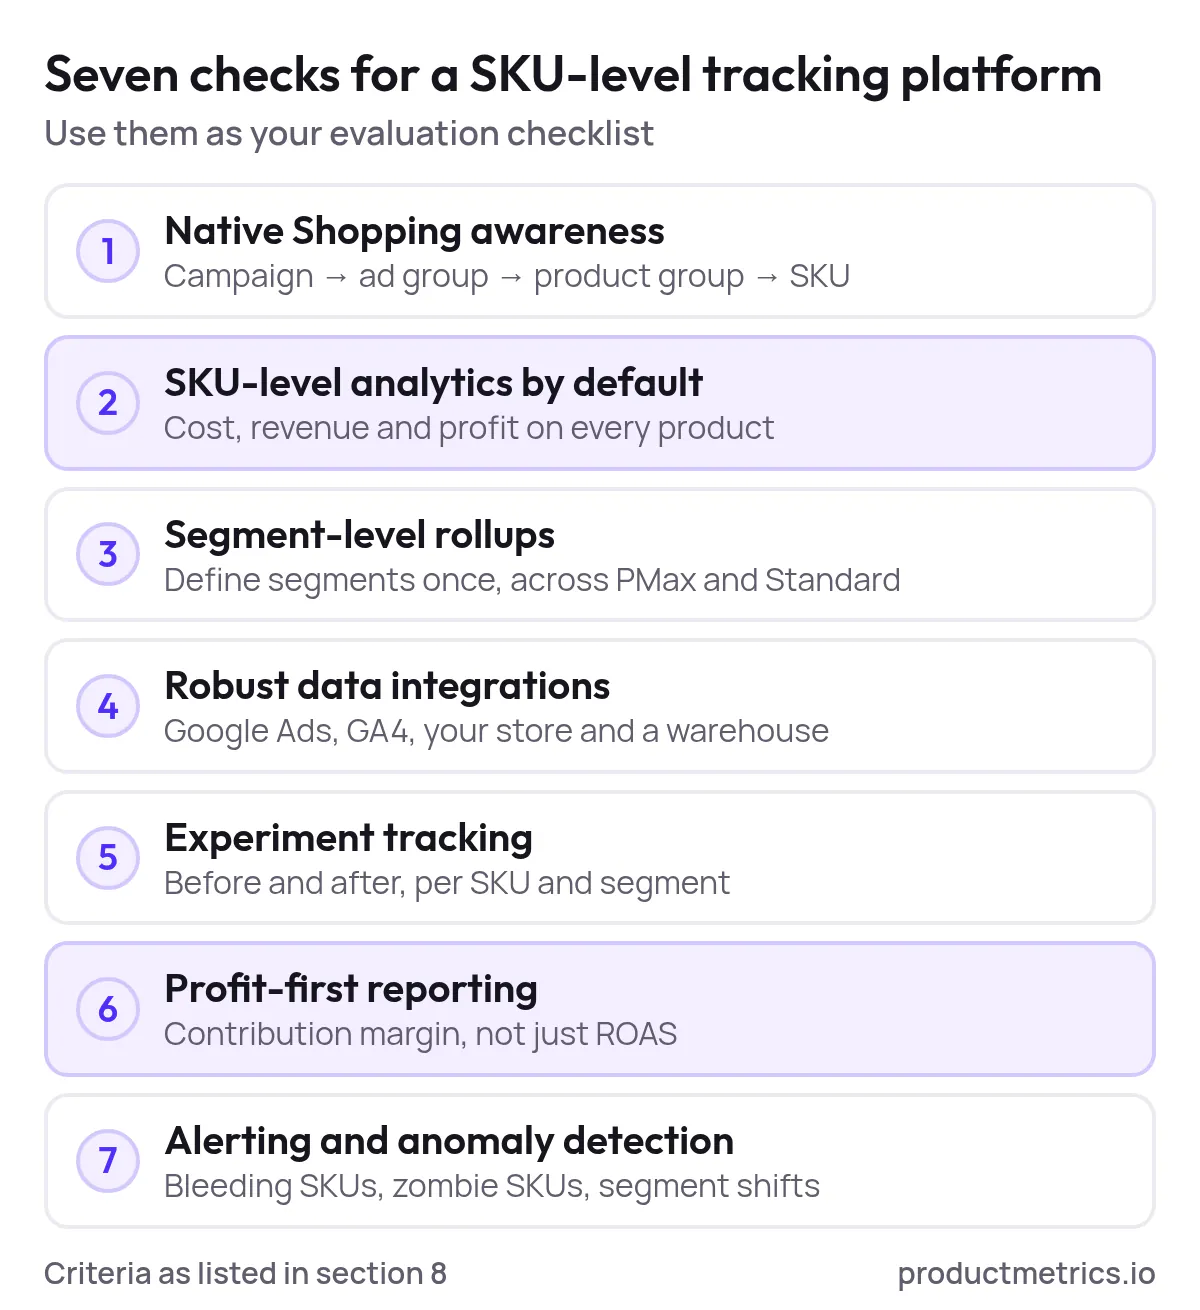
You can build all of the above manually with spreadsheets, exports, and SQL—but most teams outgrow that quickly. When evaluating platforms for granular performance tracking in segmented Google Shopping campaigns, look for:
- Native Shopping awareness
The platform should understand Google Shopping’s hierarchy (campaign → ad group → product group → SKU) and let you analyze performance at each level without complex setup. - SKU-level analytics by default
Every view should be drillable down to the individual SKU, with cost, revenue, and profit metrics at that level—not just campaign averages. - Segment-level rollups across structures
Ability to define segments once (e.g., margin tiers, lifecycle, audience) and instantly see performance by segment across all campaigns, PMax and Standard. - Robust data integrations
Connectors for Google Ads / Shopping, GA4, your ecommerce platform, and (ideally) a data warehouse like BigQuery, so you’re not stuck reconciling numbers by hand. - Experiment tracking
Tag structural experiments (campaign splits, new product-group strategies, PMax vs. Standard tests) and see pre post impact at SKU and segment levels without rebuilding reports each time. - Profit first reporting
Support for importing product costs and margin data so you can pivot on contribution margin, not just ROAS—similar to how sophisticated agencies already tie reporting to profit and SKU-level attribution. - Alerting and anomaly detection
Automatic flags for bleeding SKUs (high cost, no revenue), zombie SKUs (no impressions), and sudden shifts in key segments.
ProductMetrics.io is designed around exactly these needs.
9. How ProductMetrics.io Helps You Get to SKU-Level Truth, Fast
ProductMetrics.io takes the methodology above and turns it into a repeatable operating system for Google Shopping optimization.
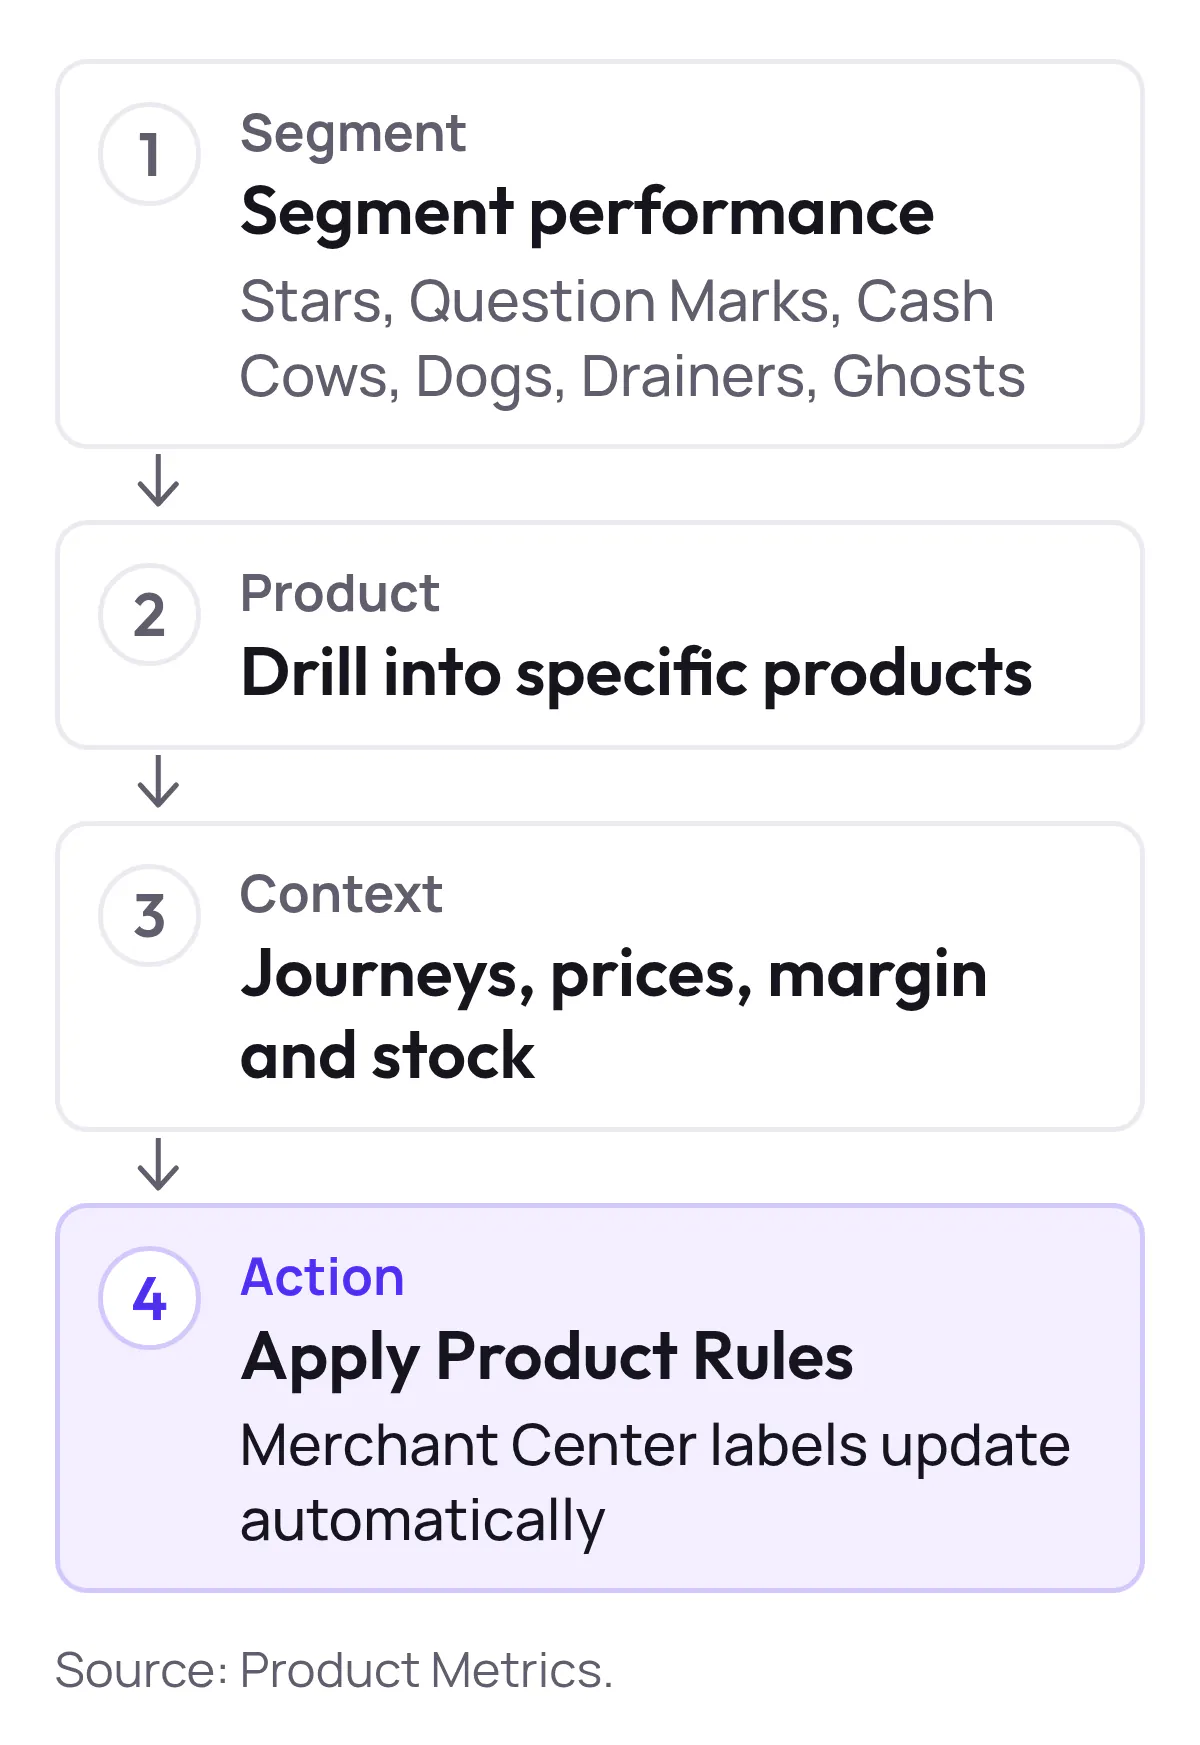
9.1 Multi Level Views SKU → Product Group → Segment
Instead of siloed reports in Google Ads, GA4, and BI tools, ProductMetrics gives you:
- SKU-level performance tables enriched with margin, inventory, and lifecycle metadata.
- Product-group dashboards that expose which groups are carried by a handful of SKUs—and which groups are dragging down results.
- Segment-level overviews that roll up performance by your custom label strategy (margin tiers, lifecycle, audiences, collections) across all campaigns.
You can move between these levels in a couple of clicks, making it trivial to see how a structural change or bid adjustment plays out all the way down to individual SKUs.
9.2 Clean Data, Without a Data Engineering Team
Using the integrations you configure, ProductMetrics can:
- Ingest Google Ads / Shopping data (including product groups and item IDs).
- Pull ecommerce and analytics data (orders, GA4 events, etc.) keyed by SKU.
- Normalize time zones, attribution windows, and identifiers into a single coherent model.
The result is a warehouse-grade data foundation without needing in house data engineers.
9.3 Experiment Tracking and Iteration
Because ProductMetrics knows about your campaigns, product groups, and segments, you can:
- Tag experiments directly in the UI (e.g., “High margin split,” “Brand vs. non brand Shopping,” “PMax isolation test”).
- Compare test vs. control at the SKU, product-group, and segment levels on a unified timeline.
- Quickly identify which SKUs or segments responded best and roll out successful structures to the rest of the catalog.
9.4 From Insight to Action
SKU-level truth only matters if it changes how you allocate budget.
ProductMetrics is built to support workflows like:
- Freezing bids or excluding consistently unprofitable SKUs while protecting proven winners.
- Reallocating spend from low margin segments into high margin ones without tanking volume.
- Surfacing SKUs with strong performance but limited impression share, so you can increase bids or break them into dedicated campaigns.
10. Next Steps Turn Your Catalog Into a Measured Growth Engine
If you’re serious about segmented Google Shopping campaigns, the question isn’t whether you need SKU-level truth and multi-layer tracking—you already do. The question is whether you’ll try to stitch it together with exports and spreadsheets, or run it on an analytics stack built for this exact challenge.
With ProductMetrics.io, you can:
- See true performance by SKU, product group, and segment in one place.
- Reconcile Google Ads, GA4, and warehouse data into a single, trusted view.
- Design and evaluate experiments on your Shopping structure with confidence.
Ready to see SKU-level truth for your own catalog?
Connect with the ProductMetrics.io team to walk through your current Shopping setup, identify your biggest blind spots, and map out a path to granular, profit driven optimization.
Written by
Berend Vrakking, Founder of Product Metrics
1M+ products analysed · Nominated at the Dutch Search Awards for Best Measurement Campaign (2023) and Best Use of Data (2024)
Keep reading.
Campaign Segmentation in Google Shopping - Principles, Pitfalls, and Governance
Campaign segmentation in Google Shopping - principles, pitfalls and governance for Shopping and Performance Max structures that keep enough data to learn.
Profit In Practice End-To-End COGS And Margin Integration For Google Shopping
How to collect COGS per product, model profit per order and send it to Google Ads as the conversion value, so Shopping and Performance Max bid on profit.
Custom Label Intelligence: Segment, Bid, and Measure Granularity In Google Shopping
Custom Label Intelligence for Google Shopping: a five-slot label schema, label-level dashboards and an experimentation ladder for Shopping and Performance Max.
See which of your products to push, fix or pause. Start with your own products, or a 30-second estimate.
Check one product first: work out its break-even ROAS in the calculator. Then see where all your products stand.
Questions, or want to spar about your products? Book a demo: a video call with Berend, then a demo account.