
How to Build a Google Shopping ROAS Dashboard That Actually Moves Revenue: Templates, Metrics and Workflows
How to Build a Google Shopping ROAS Dashboard That Actually Moves Revenue: the metric stack, drilldowns, alerts and experiment log, with templates.
Most Shopping “dashboards” are just prettier versions of the Google Ads UI.
You get 40 KPIs, zero narrative, and the same client question every month:
“So… did we actually make money?”
This guide walks through a repeatable workflow for building a Google Shopping ROAS dashboard that answers that question in minutes, not hours.
We’ll cover:
- The metric stack that actually moves revenue (MER, ROAS by query/product, contribution margin)
- How to structure investigative drilldowns so you can go from red KPI to root cause fast
- Alerting rules that turn your dashboard from a report into an operating system
- A simple experiment log so you never lose track of what you changed and why
- Copy‑paste templates and Loom‑style walkthrough outlines you can turn into shareable training content
Throughout, we’ll assume you’re using a tool like productmetrics.io – a Google Shopping optimization software with customizable reporting for ROAS tracking – but the workflow works in any stack.
Snapshot: The Google Shopping ROAS Dashboard Blueprint
If you only screenshot one thing from this article to share with your team, make it this.
Your Google Shopping ROAS dashboard should answer, at a glance:
- Are we hitting our profit targets?
- MER (blended) vs target
- Shopping ROAS vs target
- Contribution margin %
- Where is ROAS and profit leaking?
- By campaign / product type / brand
- By search query
- By product ID / SKU
- What changed recently?
- Bids, budgets, feed changes, promos, landing pages
- What should we do next?
- Ranked list of experiments and fixes
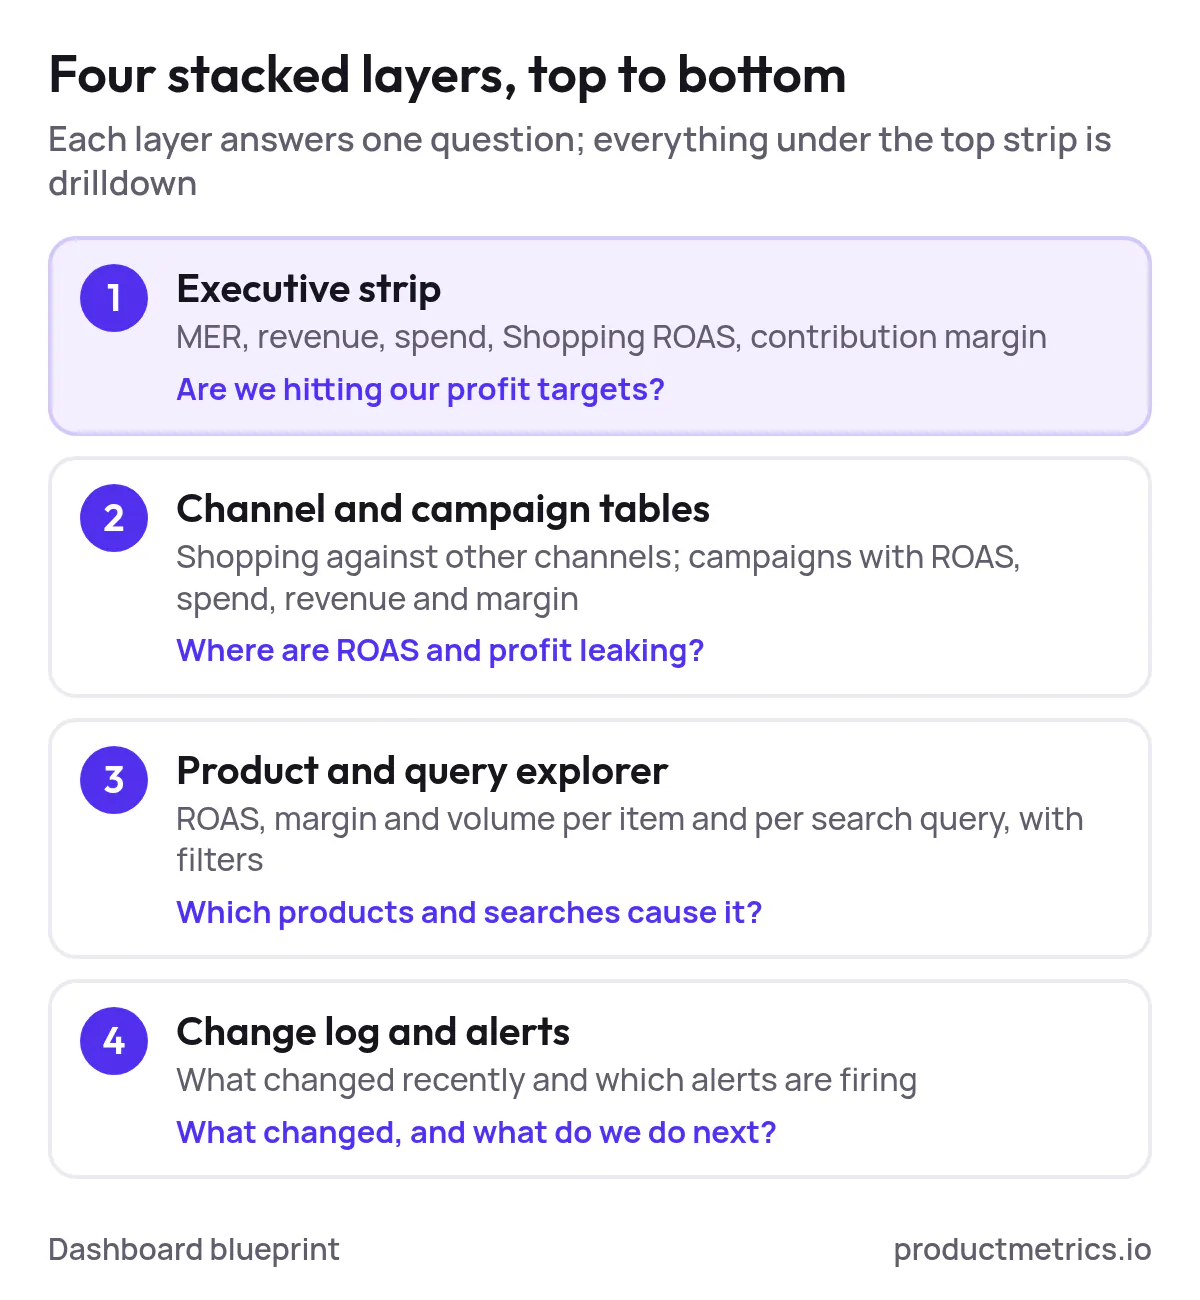
We’ll build toward four stacked layers:
- Executive strip – MER, revenue, spend, Shopping ROAS, contribution margin
- Channel & campaign tables – Shopping vs other channels; campaigns with ROAS, spend, revenue, margin
- Product & query explorer – ROAS, margin, and volume at item and query level with filters
- Change log & alerts – What changed; which alerts are currently firing
Step 1: Start With The Profit Question, Not The Widgets
Before dragging a single chart onto a canvas, lock in the one question your dashboard must answer:
“Where is our next $X of profitable Shopping revenue going to come from?”
That forces you to design from revenue and profit backward, instead of from whatever metrics the ad platform happens to expose.
For most ecommerce brands, this boils down to three core numbers:
- MER (Marketing Efficiency Ratio)
- Formula:
MER = Total Revenue ÷ Total Ad Spend - Use: Blended efficiency. Are we buying revenue at an acceptable cost across all channels?
- Formula:
- Shopping ROAS (Return on Ad Spend)
- Formula:
ROAS = Shopping Revenue ÷ Shopping Ad Spend - Use: Channel efficiency. Is Google Shopping pulling its weight versus other channels?
- Formula:
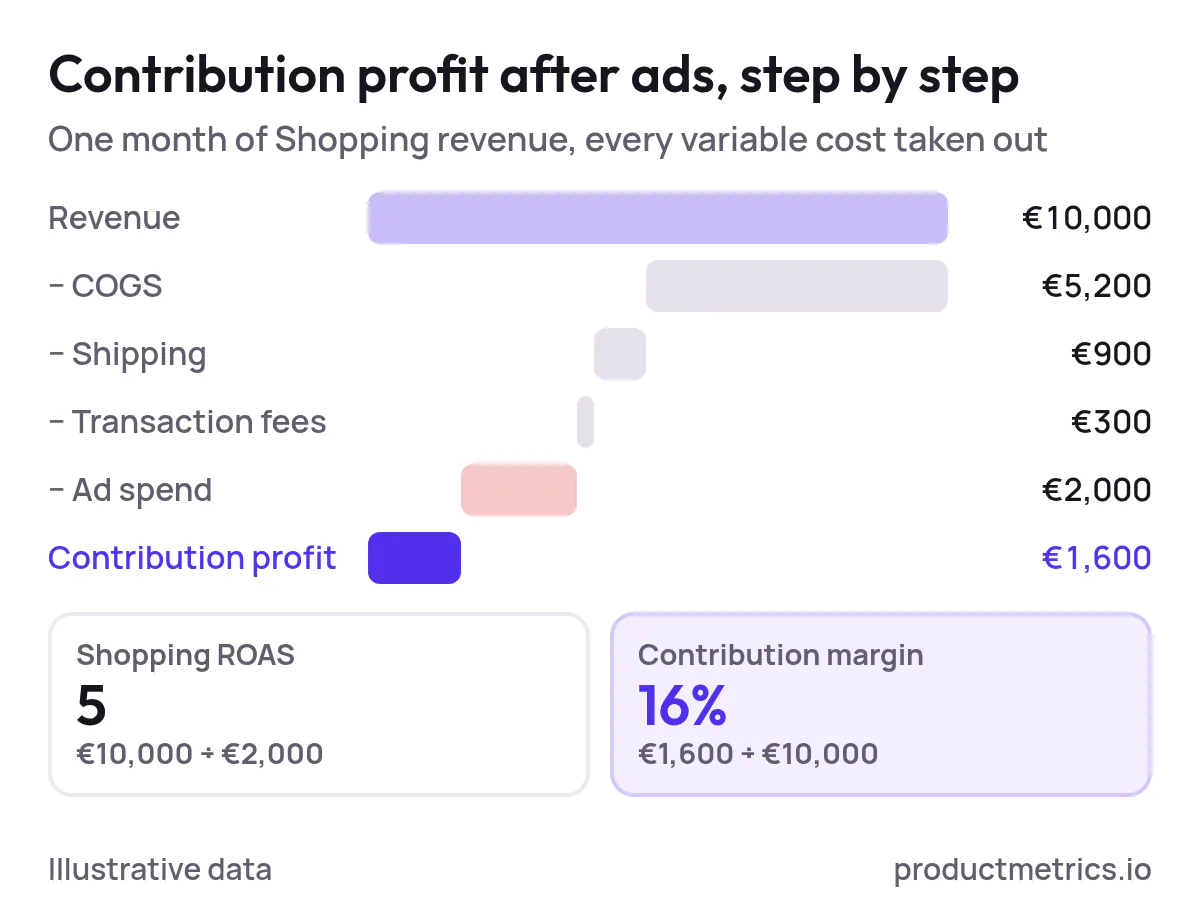
- Contribution Margin % (after ads)
- Contribution profit =
Revenue – COGS – Shipping – Transaction Fees – Ad Spend - Contribution margin % =
Contribution Profit ÷ Revenue - Use: True unit economics. Are we making enough per order to sustainably scale budgets?
- Contribution profit =
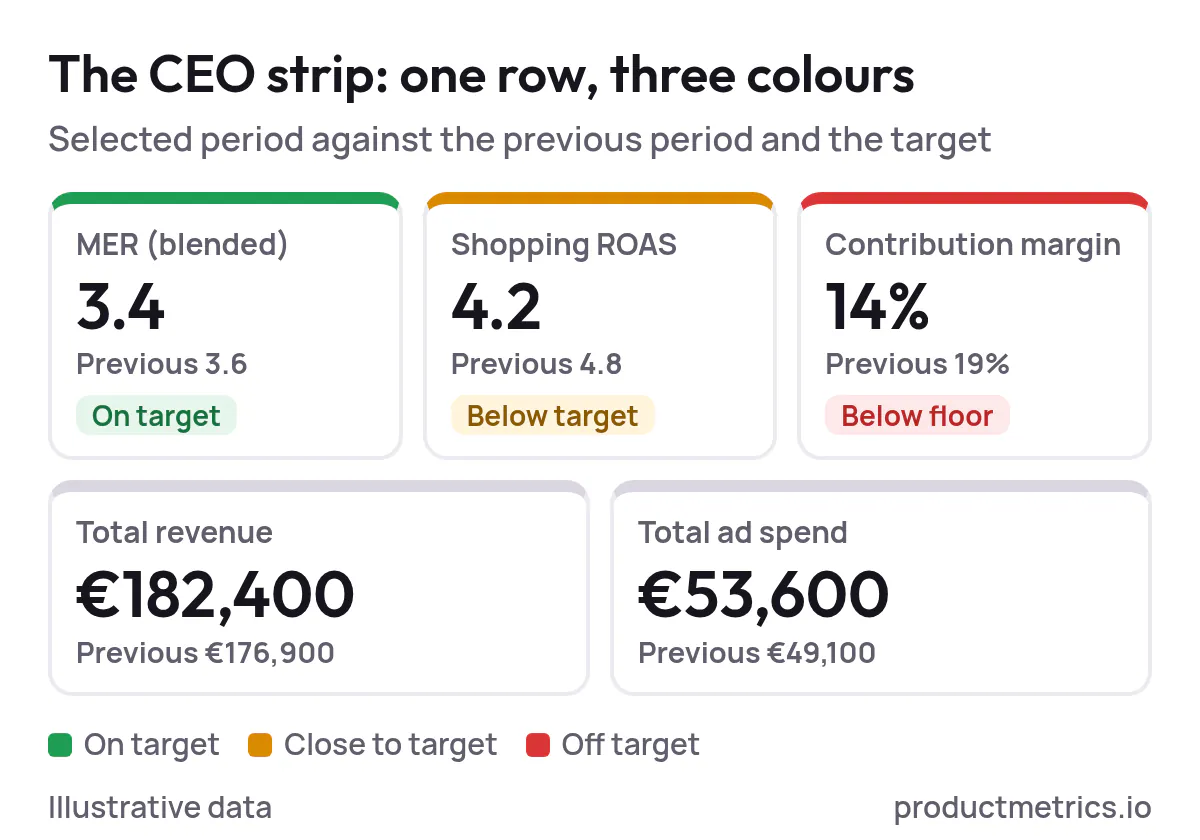
In your dashboard tool, create a top row that shows, for a selected date range:
- MER (current vs previous period)
- Shopping ROAS (current vs previous period)
- Contribution margin % (current vs previous period)
- Total revenue
- Total ad spend
Color‑code each metric versus target (green, amber, red). This is your “CEO strip” – everything else is drilldown.
Step 2: Build The Metric Stack That Underpins Every View
To make your dashboard actually useful day‑to‑day, you need a consistent metric dictionary. Here’s a minimal stack that works across executive, campaign, product, and query views.
Revenue & Cost Layer
- Revenue –
Sum(conversion_value)from Shopping campaigns - Ad spend –
Sum(cost)from Shopping campaigns - Orders –
Count(conversions)or your primary purchase event - COGS – Product‑level cost of goods (pulled from your catalog or a separate feed)
- Variable fees – Payment processing, marketplace fees, etc., if material
- Contribution profit –
Revenue – COGS – Variable Fees – Ad Spend
Efficiency Layer
- ROAS –
Revenue ÷ Ad Spend - CPA –
Ad Spend ÷ Orders - CTR –
Clicks ÷ Impressions - CVR (conversion rate) –
Orders ÷ Clicks
Structural Dimensions
You’ll slice those metrics by:
- Campaign / campaign type (Standard Shopping, Performance Max; where applicable)
- Brand vs non‑brand (via custom labels or regex on search terms)
- Product type / category
- Product ID / SKU
- Search query (from search terms report)
- Device
- Geo (country / region; more granular if you have volume)
Document this once in a KPI dictionary so your team and clients are all speaking the same language.
Step 3: Define The Key Shopping Views And Which Questions They Answer
Now you can think in terms of views instead of individual charts. For a PPC specialist, these are the ones you’ll live in.
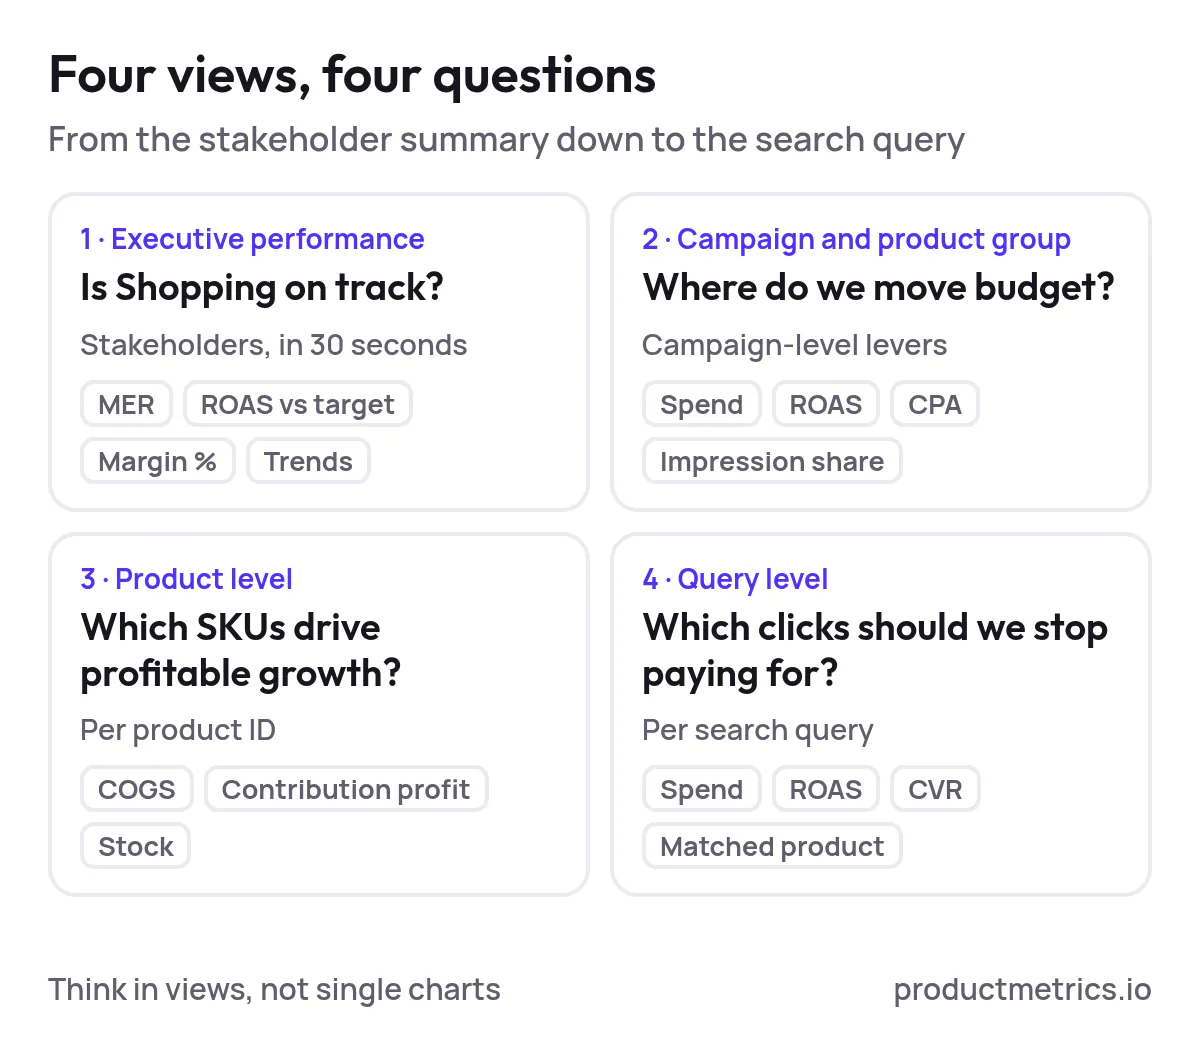
1. Executive Performance View
Purpose: Tell stakeholders in 30 seconds whether Shopping is on track.
Suggested widgets:
- MER vs target (blended, with Shopping called out)
- Shopping ROAS vs target
- Contribution margin % vs target
- Revenue & spend trend lines (last 30 / 90 days)
- Quick breakdown: Shopping revenue % of total
Questions it answers:
- Are we on track to hit revenue and efficiency targets?
- Is Shopping gaining or losing share in the mix?
- Did the latest promo / sale period actually improve profit, not just top‑line?
2. Campaign & Product Group View
Purpose: Decide where to move budget and which levers to pull at the campaign level.
Suggested table columns:
- Campaign name
- Impressions, clicks
- Spend
- Revenue
- ROAS
- CPA
- Orders
- Contribution margin % (if you can map COGS)
- Impression share (optional but powerful)
Add filters for:
- Brand vs non‑brand
- Device
- Geo
- Campaign type (Shopping vs Performance Max, if relevant)
Questions it answers:
- Which campaigns are over‑ or under‑spending relative to ROAS and margin?
- Where can we push more budget without destroying unit economics?
- Which product groups are subsidizing others?
3. Product Level View
Purpose: See which SKUs are actually driving profitable growth.
Suggested table columns:
- Product ID / SKU
- Product title
- Category / product type
- Impressions, clicks
- Spend, revenue, orders
- ROAS, CPA
- COGS
- Contribution profit, contribution margin %
- Inventory status (if available)
Questions it answers:
- Which products are ROAS darlings but low margin (and vice versa)?
- Which SKUs should get more budget or higher bids?
- Are we wasting budget on items with poor unit economics or low stock?
4. Query Level View
Purpose: Understand intent and stop paying for the wrong clicks.
Suggested table columns:
- Search query
- Matched product ID / product type
- Impressions, clicks
- Spend, revenue, orders
- ROAS, CPA, CVR
Questions it answers:
- Which queries are quietly killing ROAS?
- Where should we add negatives or restructure campaigns?
- What new high‑intent queries should influence feed titles and descriptions?
This is where user‑friendly, customizable reporting really matters. If you’ve ever wished you could shop for ROAS optimization dashboards for Google Shopping campaigns instead of babysitting CSV exports, this is the view you’re dreaming about.
Step 4: Wire Up Investigative Drilldowns From Alert To Action
A good dashboard doesn’t just show red numbers; it bakes in a workflow for what to do when things go red.
Here’s a simple investigative path you can teach your team and even turn into a Loom walkthrough.
Scenario: Shopping ROAS dropped from 5.0 to 3.2 while spend stayed flat.
- Start at the executive strip
- Confirm the drop in Shopping ROAS.
- Check whether MER and contribution margin also dropped. If MER is fine but Shopping ROAS is down, another channel may be compensating.
- Drill into campaign view
- Sort campaigns by change in ROAS vs previous period.
- Flag campaigns with: high spend, ROAS down, contribution margin down.
- Zoom into product‑level view for affected campaigns
- Filter to those campaigns; sort products by change in contribution profit.
- Identify:
- Products with rising spend but flat/declining revenue
- Products with margin compression (COGS increases, promo changes)
- Open the query‑level view for a bleeding product group
- Filter by product type or SKU.
- Sort queries by spend with ROAS below target.
- Add negatives or tighten structures around the worst offenders.
- Check feed & site factors
- Titles: Are we matching the winning queries?
- Pricing: Did competitors undercut us?
- Stock: Are we driving traffic to low‑stock or back‑ordered items?
- Decide and log an experiment
- Example actions: adjust bids, split out a new campaign, update titles, launch a promo.
- Log the change in your experiment log (more on that below).
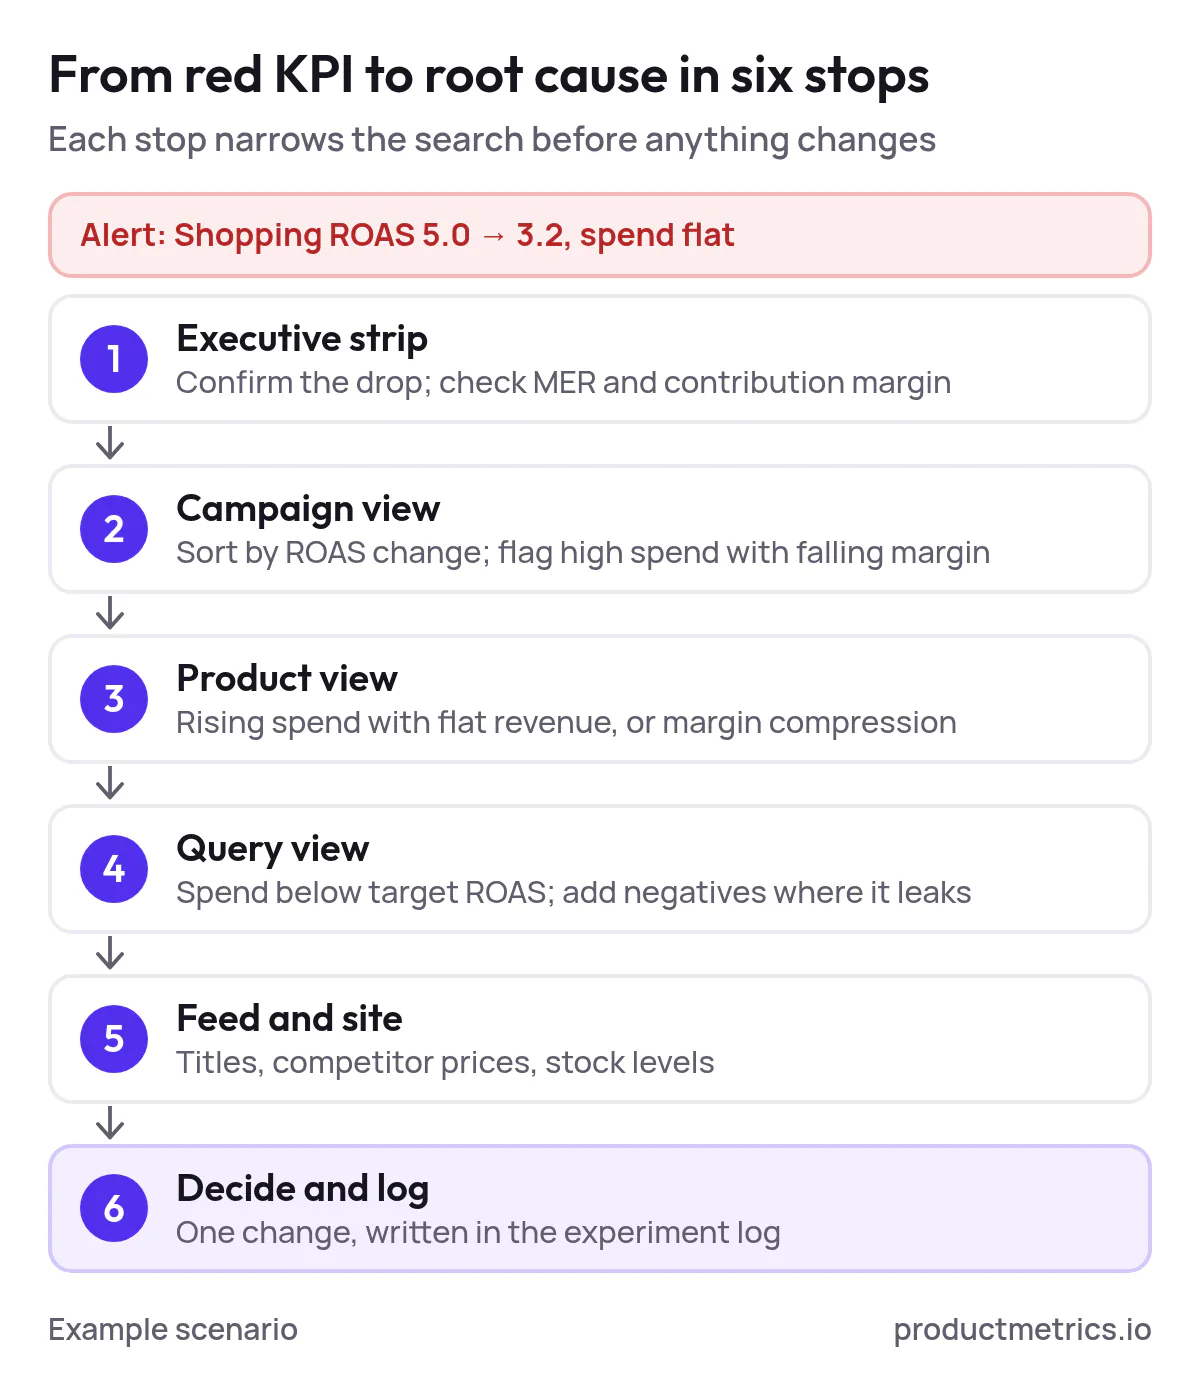
Teach this path once, and your dashboard becomes a playbook, not a screenshot.
Step 5: Add Alerting So You Don’t Live In The Dashboard
Customizable reporting dashboard software for Google Shopping ROAS management is only as good as its alerts. You shouldn’t have to stare at charts to know when something breaks.
Design a handful of simple, high‑signal alerts:
1. ROAS Vs Target Alerts
- Rule: If Shopping ROAS < target by X% for Y consecutive days and spend > threshold, fire alert.
- Use: Catch performance issues before they blow up a full month.
2. Contribution Margin Alerts
- Rule: If contribution margin % falls below floor (e.g., 20%) at campaign or product type level, alert.
- Use: Stops you scaling campaigns that look fine on ROAS but are killing profit.
3. Volume Drop Alerts
- Rule: If impressions or clicks drop by more than X% day‑over‑day or week‑over‑week for a top campaign, alert.
- Use: Early warning for feed disapprovals, budgets hitting caps, or bid strategy glitches.
4. Query Waste Alerts
- Rule: If a query spends more than $N with ROAS below floor and zero orders over last M days, alert.
- Use: Forces regular negative keyword and structural hygiene.
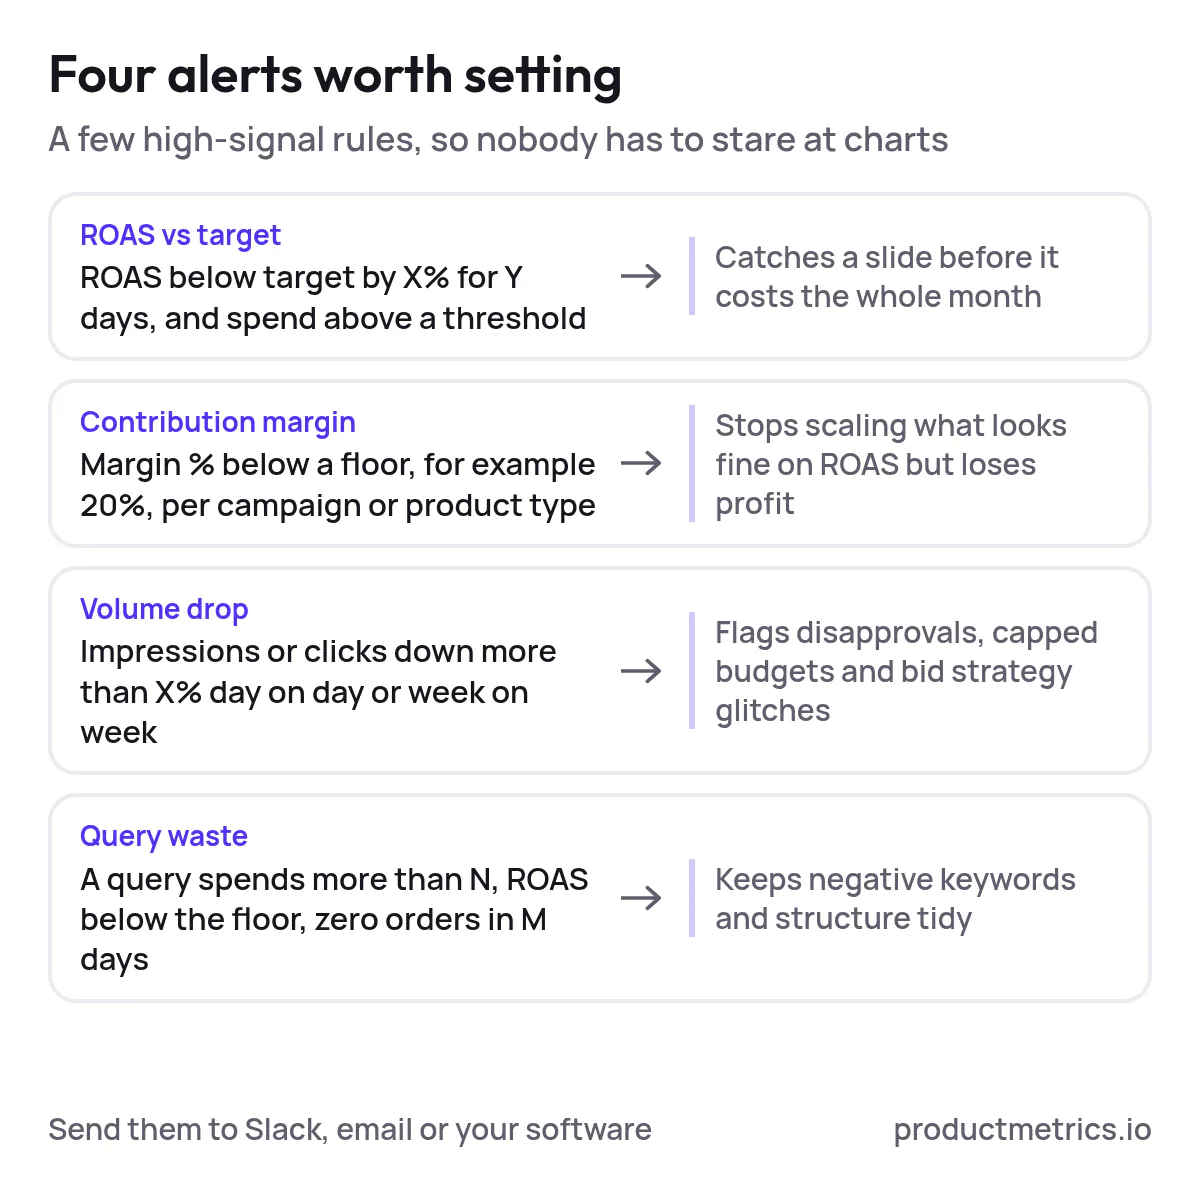
Send these to Slack, email, or within your optimization software – whatever your team actually watches. This is where google shopping ROAS optimization tools with user‑friendly customizable dashboards earn their keep.
Step 6: Log Experiments So You Can Connect Changes To Outcomes
If you’re making frequent changes, you need an experiment log next to your dashboard, not buried in someone’s notebook.
Create a simple table (inside your dashboard or in a linked doc) with these columns:
| Date | Owner | Change type | Description | Target (campaign / product / query) | Hypothesis | Primary KPI | Guardrails | Result (after X days) | Next action |
|---|---|---|---|---|---|---|---|---|---|
| 2026‑11‑01 | Alex | Bid strategy | Switched Campaign A to tROAS 400% | Campaign A | tROAS will improve ROAS with similar volume | ROAS, revenue | MER must stay > 3.0 | Pending | Review in 14 days |
Make it a habit:
- Any material change (bids, budgets, structures, feed, promos) must be logged.
- During weekly reviews, scroll through experiments, not just charts.
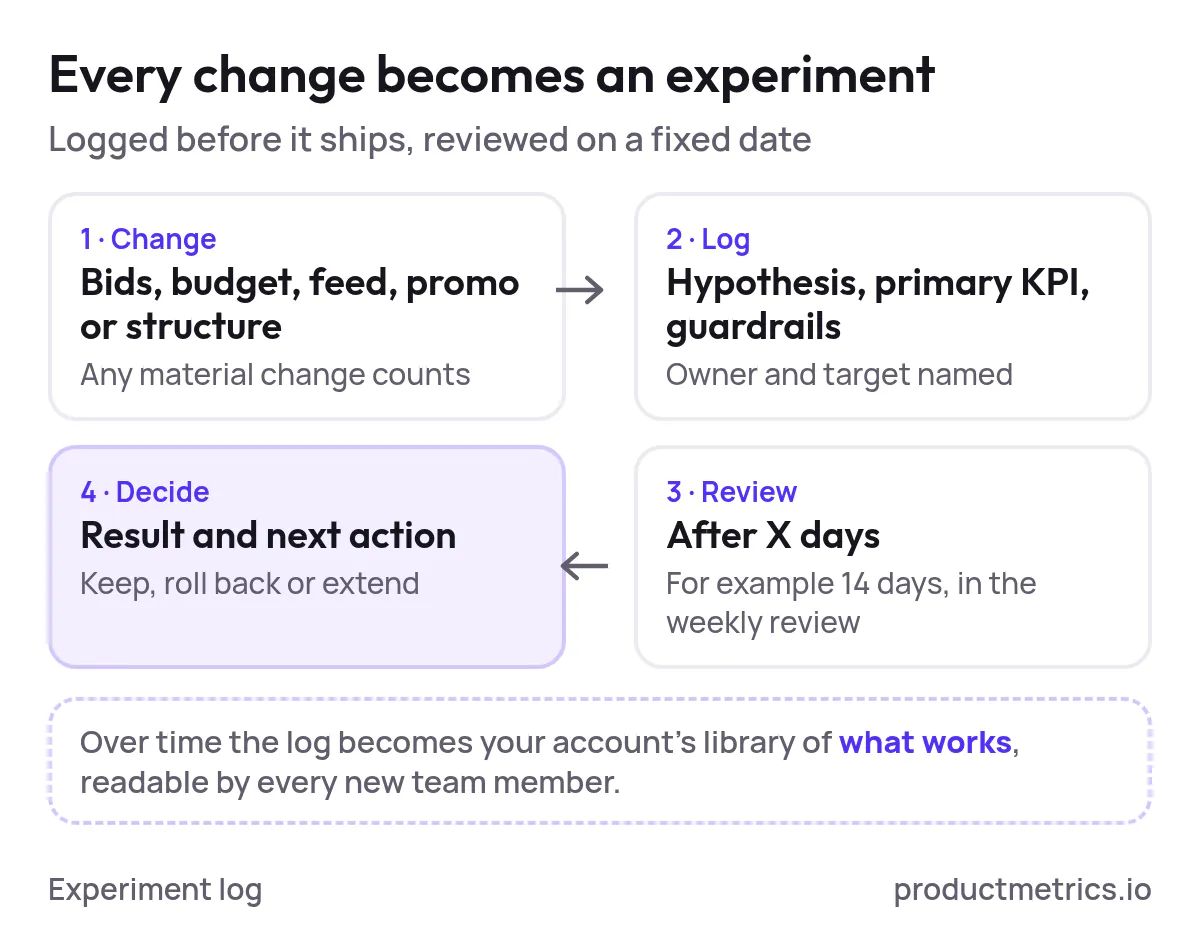
Over time, this becomes a library of “what works” for your account that new team members can learn from.
Templates You Can Copy
You may not have downloadable files wired up yet, but you can copy these straight into Sheets, Notion, or your BI tool.
1. KPI Dictionary Template
| Metric | Definition | Formula | Level (Exec / Campaign / Product / Query) | Notes |
|---|---|---|---|---|
| MER | Blended efficiency of all paid media | Total revenue ÷ total ad spend | Exec | Track by month and by major promo period |
| Shopping ROAS | Revenue efficiency of Google Shopping | Shopping revenue ÷ Shopping ad spend | Exec, Campaign | Set different targets for prospecting vs brand |
| Contribution profit | Profit after COGS, fees, and ads | Revenue – COGS – variable fees – ad spend | Product, Campaign | Use latest COGS; update when suppliers change pricing |
| Contribution margin % | Contribution profit as % of revenue | Contribution profit ÷ revenue | Exec, Product | Floor should reflect your minimum acceptable margin |
| Query ROAS | ROAS at search term level | Revenue ÷ ad spend at query level | Query | Use for negatives and feed title decisions |
Fill this out once per account and share it with your team and clients.
2. Dashboard Layout Template
Use this as a wireframe for your customizable reporting dashboards.
| Zone | Position | Widget type | Metrics / fields | Primary question |
|---|---|---|---|---|
| 1 | Top strip | KPI tiles | MER, Shopping ROAS, contribution margin %, revenue, spend | Are we on target overall? |
| 2 | Upper left | Time series | Revenue, spend, ROAS over time | Are we trending up or down? |
| 3 | Upper right | Channel breakdown | Revenue, spend, ROAS by channel | Is Shopping carrying its weight vs other channels? |
| 4 | Middle | Campaign table | Spend, revenue, ROAS, margin by campaign | Which campaigns deserve more or less budget? |
| 5 | Lower left | Product table | SKU, title, spend, revenue, ROAS, margin | Which products drive (or drain) profit? |
| 6 | Lower right | Query table | Query, spend, revenue, ROAS, orders | Which search terms should we amplify or block? |
| 7 | Bottom | Experiment log | As defined above | What did we change, and what happened? |
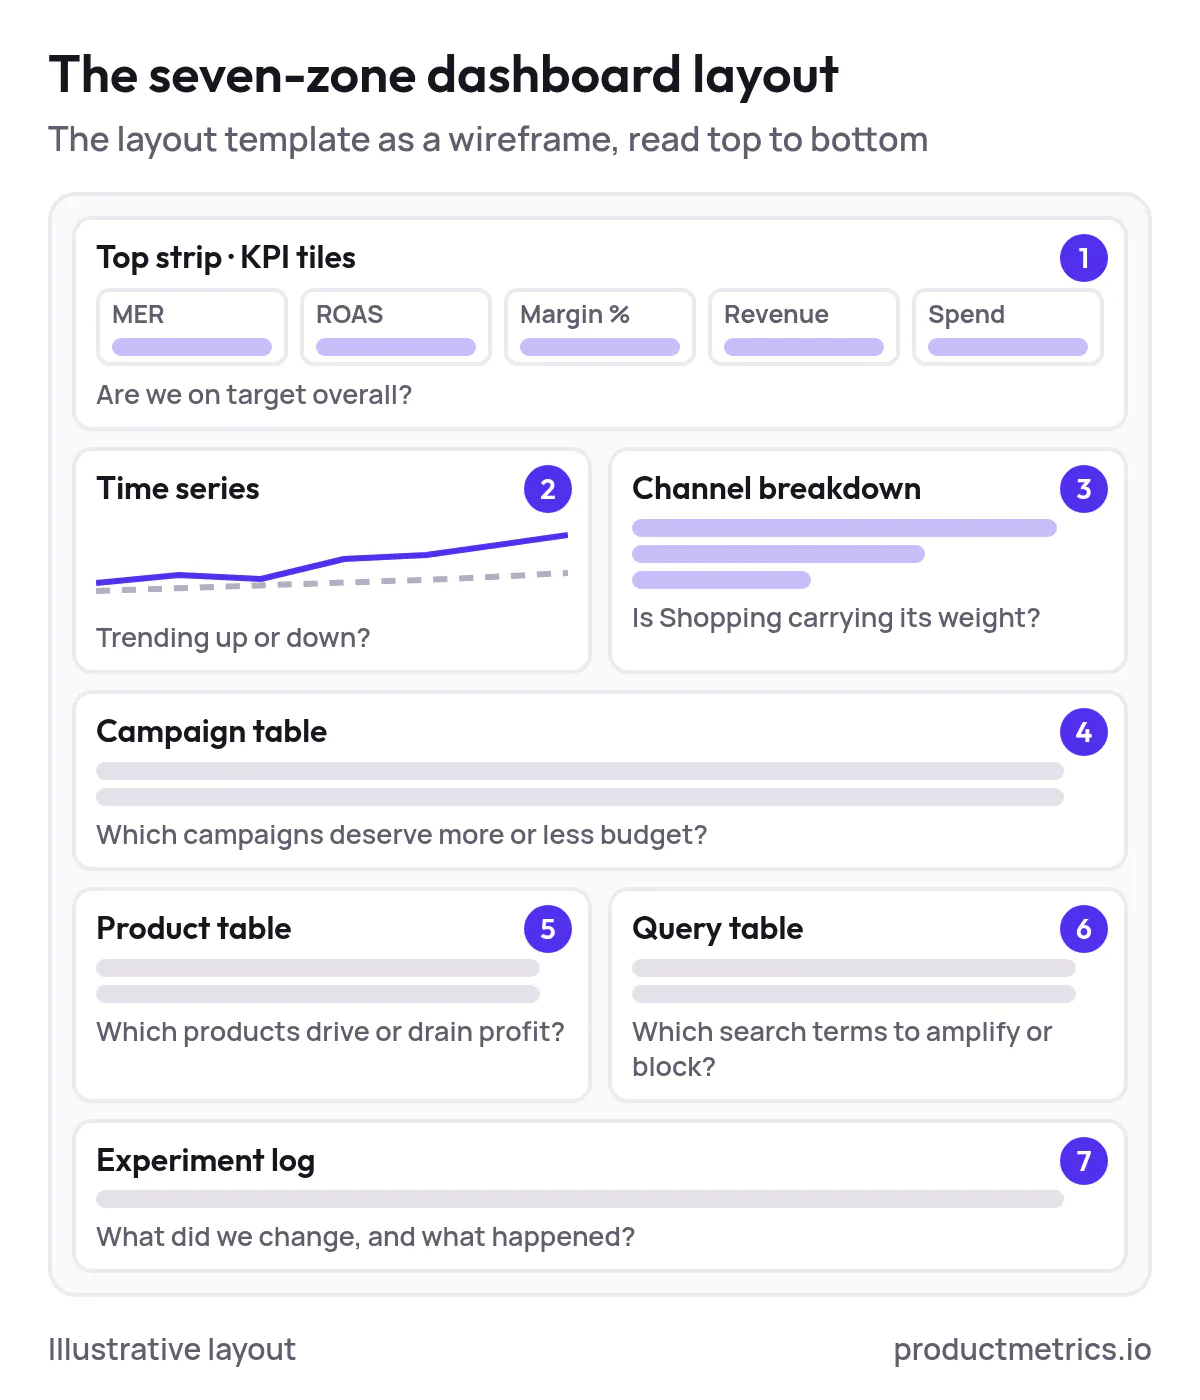
If you’re evaluating google shopping optimization software with customizable reporting for ROAS tracking, check whether it can support this exact layout without hacky workarounds.
3. Experiment & Change Log Template
You can keep this in‑tool or in a shared Sheet.
Date:
Owner:
Change type: (bids, budget, feed, promo, structure, other)
Target: (campaign / ad group / product group / SKU / query)
Hypothesis:
Primary KPI:
Guardrails:
Implementation notes:
Review date:
Result:
Next action:
This is boring in the best way possible. The more religiously you keep it, the easier your monthly and quarterly narratives become.
Loom Style Walkthroughs You Can Record
To make this article truly shareable across your org and client base, turn the workflow into short Looms. Here’s a ready‑made outline.
Loom 1 — “Executive Strip & MER/ROAS Basics” (5–7 minutes)
- Who this dashboard is for
- What MER, ROAS, and contribution margin mean in your specific business
- How to read the top strip in under 30 seconds
- Example: how a promo weekend shows up in these metrics
Loom 2 — “Finding Profit Leaks By Campaign, Product And Query” (8–10 minutes)
- Starting from a ROAS drop alert
- Drilling into the campaign table to find problem areas
- Jumping to product‑level view to spot low‑margin or low‑stock SKUs
- Using the query table to add negatives and identify title opportunities
Loom 3 — “Alerts, Experiments And Weekly Workflow” (8–10 minutes)
- Walk through your live alert rules and where they post (Slack/email)
- Show your experiment log and how to fill it out
- Demo a full weekly optimization routine in 10–15 minutes
- End with how to request new dashboard views or metrics
Share these videos alongside the dashboard so new team members, clients, and stakeholders can onboard themselves.
Where Productmetrics.io Fits In
If you’re trying to find ROAS optimization solutions for Google Shopping with real‑time customizable dashboards, your life gets much easier when your reporting layer is built with this exact workflow in mind.
Tools like productmetrics.io are designed as Google Shopping ROAS optimization tools with user‑friendly customizable dashboards, so you can:
- Build the executive strip once and reuse it across accounts
- Spin up product and query explorers without living in exports
- Layer in MER and contribution margin alongside ROAS in every view
- Configure alerts that map directly to your targets and guardrails
Instead of stitching together half a dozen generic reports, you get a single customizable reporting dashboard software for Google Shopping ROAS management that mirrors how PPC specialists actually work.
The end result: fewer “What happened this month?” conversations, more “Here’s exactly where we’ll find the next $50k in profitable revenue” discussions.
Set up the dashboard once, then let your alerts, drilldowns, and experiment log turn it into a living, breathing optimization system.
(Source: productmetrics.io)
Written by
Berend Vrakking, Founder of Product Metrics
1M+ products analysed · Nominated at the Dutch Search Awards for Best Measurement Campaign (2023) and Best Use of Data (2024)
Keep reading.
The 2026 Ecommerce ROAS Optimization Tools Landscape - How Performance Teams Evaluate, Pilot, and Scale
The 2026 ecommerce ROAS optimization tools landscape - how performance teams evaluate, pilot and scale Google Shopping tools with custom dashboards.
Best Tools For Google Shopping ROAS Optimization With Customizable Dashboards
Six Google Shopping ROAS dashboard tools scored on five criteria: Google Ads native, Product Metrics, Optmyzr, ProfitMetrics, Channable Insights and GoDataFeed.
Customizable Reporting For Google Shopping ROAS - Real-Time, Drag-And-Drop, And Personalized Dashboards In ProductMetrics
Customizable reporting for Google Shopping ROAS - real-time, drag-and-drop and personalised dashboards, built on product segments, labels and POAS.
See which of your products to push, fix or pause. Start with your own products, or a 30-second estimate.
Check one product first: work out its break-even ROAS in the calculator. Then see where all your products stand.
Questions, or want to spar about your products? Book a demo: a video call with Berend, then a demo account.