
Where to Buy Google Shopping Segmentation Software With Granular Analytics Pricing Trials And RFP Checklist
Where to buy Google Shopping segmentation software with granular analytics: four vendor types, pricing models, trial scope, onboarding and an RFP checklist.
If you’re responsible for procurement, finance, or growth, you’re likely hearing the same complaints from your PPC team:
- “We can’t see performance at a granular enough level to move budget confidently.”
- “Product groups and Performance Max are black boxes—spend follows clicks, not profit.”
- “We’re stitching reports from Google Ads, Merchant Center, and GA4 in spreadsheets.”
This guide is written for the moment when you’re ready to purchase software for advanced Google Shopping campaign segmentation with granular performance tracking—not just to read another tactics article.
You’ll find:
- The types of tools that actually deliver SKU‑level and segment‑level analytics for Shopping and Performance Max.
- How vendors price these platforms (spend‑based, SKU‑based, seat‑based) and what that means for your budget.
- What a serious trial or POV should include so you can prove value before committing.
- Typical onboarding timelines and dependencies.
- A practical RFP checklist you can paste straight into your procurement doc.
Throughout, we’ll use Product Metrics as a reference point for what “good” looks like in product‑level Google Shopping segmentation and analytics.
1. What You’re Actually Buying - Granular Google Shopping Segmentation & Analytics
Before you shop for tools, it helps to define what “granular performance tracking in Google Shopping segmentation” really means in practice.
1.1 Native Capabilities - Where Google Stops
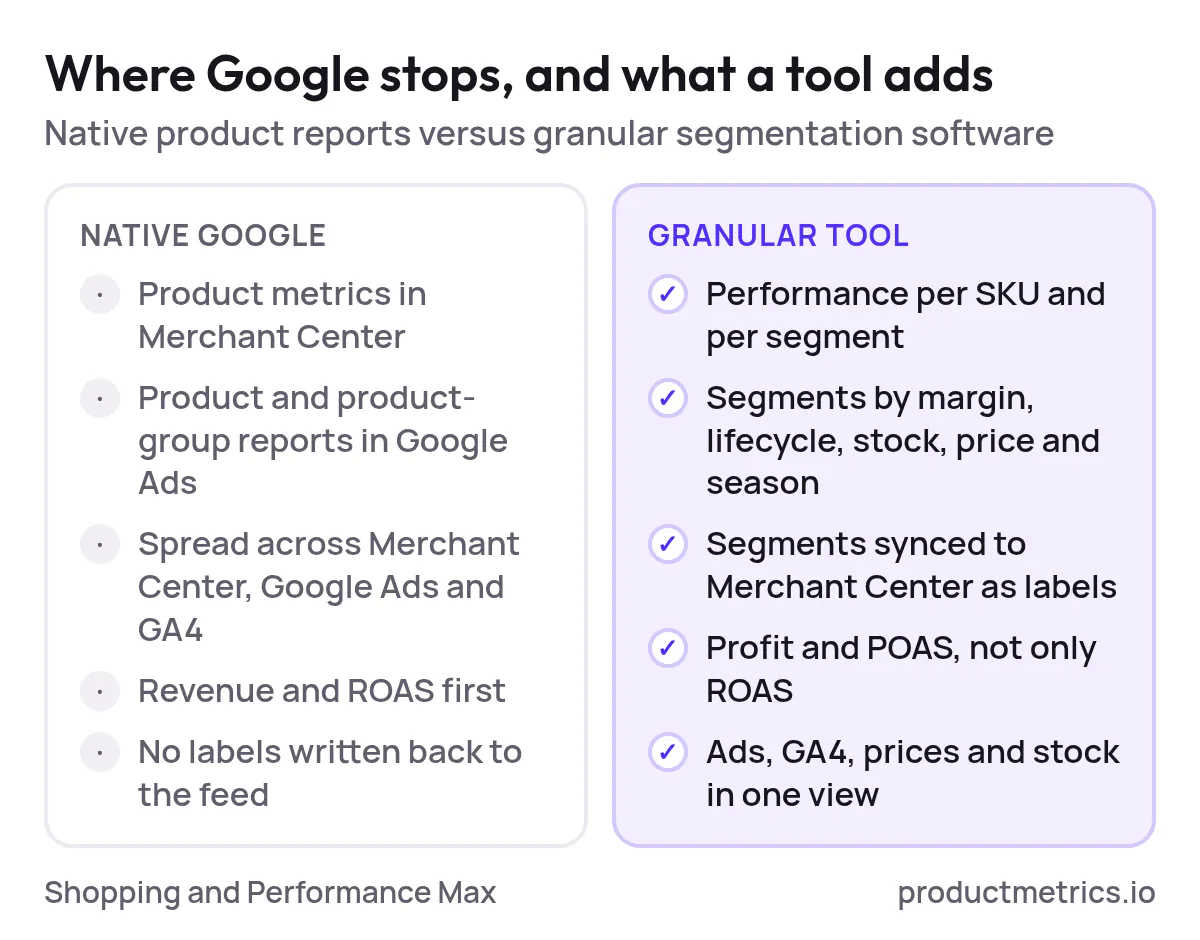
Out of the box, Google gives you partial visibility:
- Google Merchant Center can show product‑level metrics such as clicks, impressions, and conversions for items in your feed. (Source: Google Merchant Center Help)
- Google Ads and the Google Ads API can report Shopping performance at the product or product‑group level, including product clicks and conversion metrics. (Source: Google Ads API documentation)
These views are helpful, but limited:
- They’re spread across multiple properties (Merchant Center, Google Ads, GA4), which makes cross‑referencing slow and manual. (Source: AI Advantage Agency Google Shopping guide)
- They’re usually revenue- and ROAS‑first, not profit‑ or POAS‑first, unless you invest in custom margin tracking.
- They don’t automatically turn insights into feed labels or campaign structures that your bid strategies can act on.
1.2 What “Granular Tracking” Should Mean in a Tool
When you evaluate vendors, you’re looking for software that goes beyond the native stack and gives you, at minimum:
- SKU‑level and segment‑level performance for Shopping and Performance Max (not just at campaign or ad group level).
- Segmentation by business reality, not just Google’s structures: margin bands, lifecycle stage, inventory status, price competitiveness, and seasonality.
- Automatic labelling or syncing to Merchant Center so that segments become real levers in your campaigns.
- Profit and POAS visibility, not only revenue and ROAS.
- Cross‑source context by combining Google Ads, GA4, pricing, and inventory, so you see why each product performs as it does.
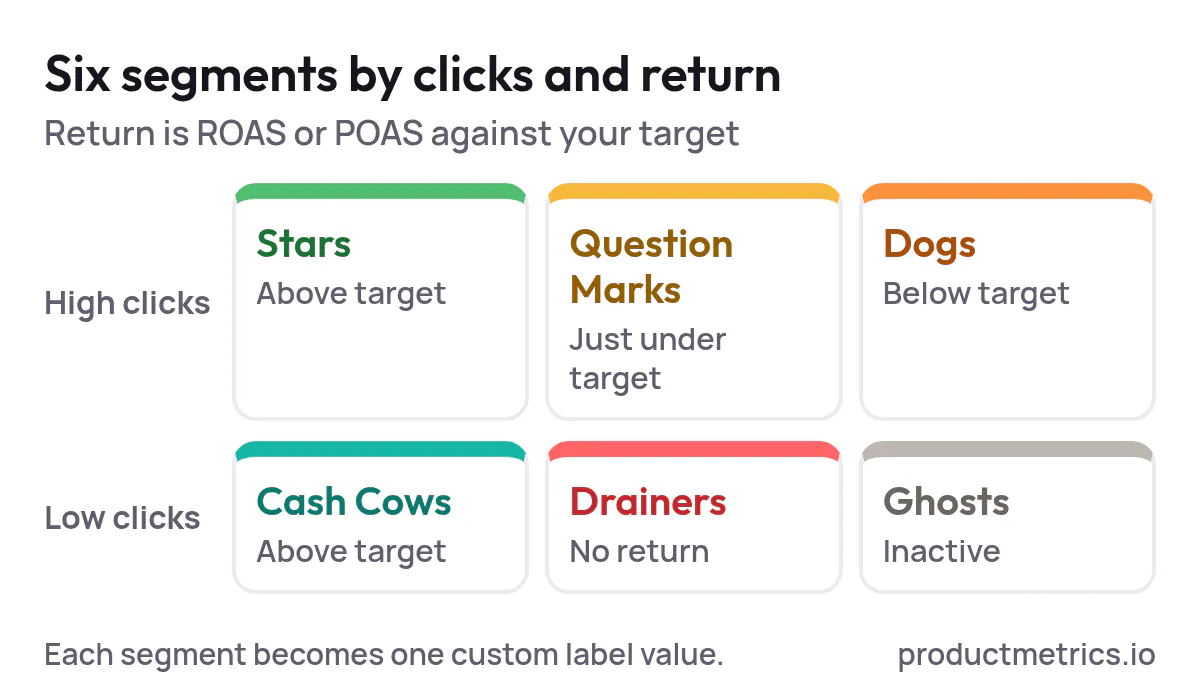
Specialist platforms like Product Metrics are built for exactly this use case: they segment products into six ML‑driven segments (Stars, Cash Cows, Question Marks, Dogs, Drainers, Ghosts) based on product‑level volume and return, then write those segments back as labels to Merchant Center so your campaigns can act on them. (Source: Product Metrics)
2. Where to Buy - The Main Categories of Google Shopping Segmentation Tools
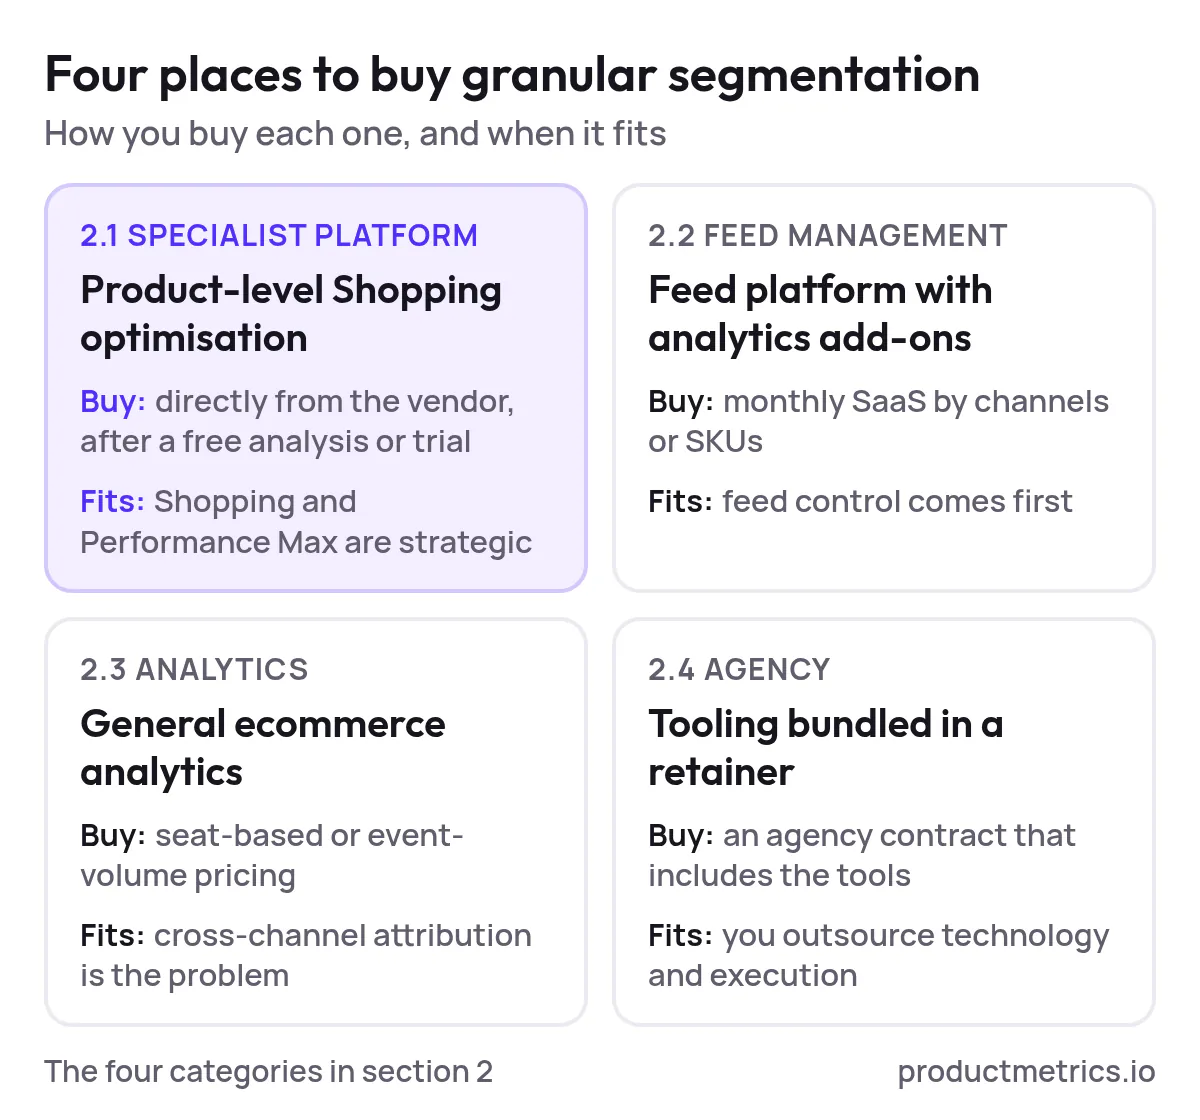
When stakeholders ask, “Where do we buy software for advanced campaign segmentation and granular analytics in Google Shopping?”, they’re usually choosing between four categories of solutions.
2.1 Specialist Product‑Level Google Shopping Optimization Platforms
What they are
SaaS platforms built specifically for product‑level Google Shopping and Performance Max optimization. They ingest your Google Ads, Merchant Center, web analytics, pricing, margin, and inventory data into one workspace, then turn it into segmentation, labels, and actions. (Source: GetApp overview of Product Metrics)
Example: Product Metrics
Product Metrics is a cloud-based platform focused on product‑level intelligence for Google Shopping and Performance Max. It:
- Connects Google Ads, GA4 (optional), pricing, margin, and inventory data in one place. (Source: GetApp overview of Product Metrics)
- Uses machine learning to segment every product by click volume and return into six standard segments.
- Shows product context like journeys (what else is bought after an initial click), competitor prices, margins, and stock levels.
- Automatically writes approved segment labels to Merchant Center for your Shopping or Performance Max campaigns to use—without custom scripts. (Source: Product Metrics)
Buying pathway
You typically:
- Contract directly with the vendor via their website or sales team.
- Start with a free analysis or trial connected to your own data, then move to a paid plan once you see uplift. Product Metrics, for example, offers a free analysis, a 30‑day trial, and then charges a graduated share of your rolling 30‑day Google Shopping spend, with the first segment of spend free every month. (Source: Product Metrics)

Show the dataHide the data
| Rolling 30-day Google Shopping spend | Monthly fee (excl. VAT) |
|---|---|
| €10K | €0.00 |
| €25K | €97.50 |
| €50K | €247.50 |
| €100K | €547.50 |
Best when
- You want to purchase analytics tools for granular performance tracking in Google Shopping segmentation, not a general analytics suite.
- Your team is already invested in Shopping/Performance Max and needs a dedicated product‑level control layer.
2.2 Feed Management Platforms With Analytics Add‑Ons
These tools start from product feed creation and channel syndication, then add Shopping dashboards, rules, and sometimes profit‑based bidding guidance. (Source: GoDataFeed Google Shopping handbook)
Buying pathway
- You license the platform on a monthly SaaS plan, often based on number of channels or SKUs, and enable additional analytics modules as add‑ons.
- Some include basic profit analytics if you enrich the feed with COGS. (Source: GoDataFeed launch guide)
Where they fit
- Good if you need feed control first and are comfortable doing more of the analysis and segmentation logic yourself.
- Less ideal if your primary goal is to buy software for campaign segmentation with high‑granularity performance tracking that’s ready out of the box.
2.3 General Ecommerce Analytics and Attribution Platforms
Analytics platforms and attribution tools (for example, those focused on cross‑channel performance or first‑party tracking) sometimes include Shopping performance views. They’re powerful, but broad. (Source: AI Advantage Agency Google Shopping guide)
Buying pathway
- Usually licensed on seat‑based or event‑volume pricing, managed by marketing or data teams.
- Google Shopping is one slice of a much larger analytics deployment.
Where they fit
- When your core problem is cross‑channel attribution, not product‑level Shopping control.
- You have in‑house analysts to build Shopping‑specific views and segments.
2.4 Agencies and Consultancies Bundling Tooling
Many agencies and performance consultancies include proprietary scripts, feeds, or white‑label tools in their retainers.
Buying pathway
- You sign an agency contract that includes tooling as part of service.
- The license usually doesn’t travel with you if you switch agency.
Where they fit
- When you want to outsource both technology and execution.
- Less ideal if you want ownership of your segmentation logic and analytics stack.
3. Pricing and Commercial Models - How Vendors Charge for Granular Tracking
As you compare tools for segmenting Google Shopping campaigns with granular performance analytics, you’ll see a few common pricing patterns.
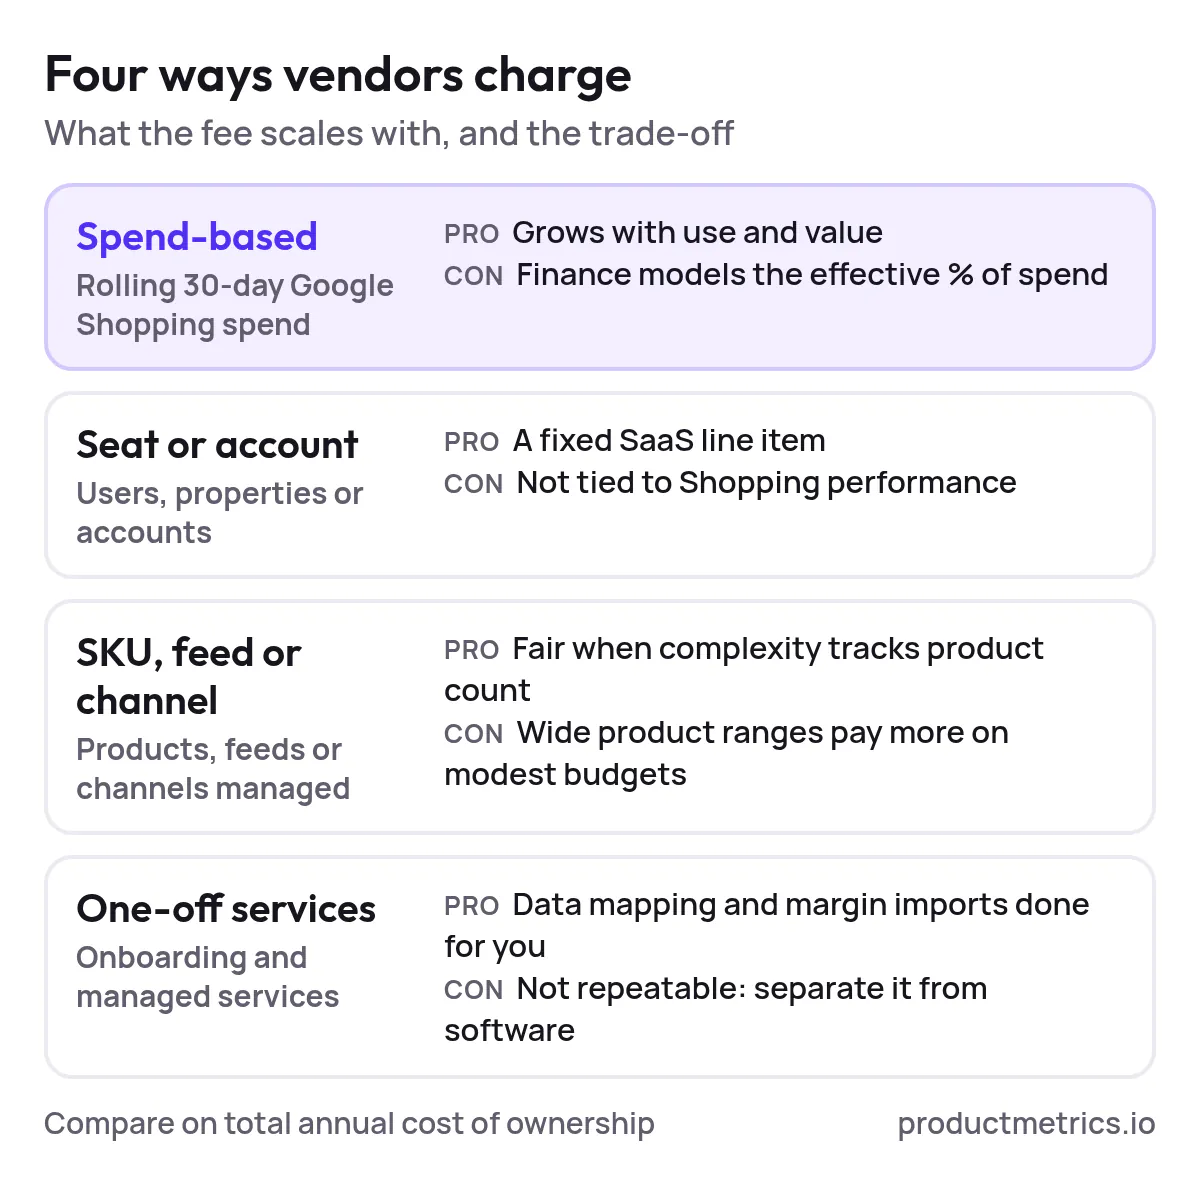
3.1 Spend‑Based Pricing
Often used by Shopping‑specific optimization platforms:
- Fees are a percentage of your rolling 30‑day Google Shopping ad spend, sometimes on a tiered schedule where the effective rate drops at higher spend.
- Vendors may include a free spend band each month and no seat limits. Product Metrics, for example, gives merchants a free band of Google Shopping spend each month before applying a small graduated percentage. (Source: Product Metrics)
Pros
- Scales with your actual use and value; low risk at the beginning.
- No need to predict seats or event volume up front.
Cons
- Requires finance and procurement to model effective % of media spend and compare it to lift.
3.2 Seat‑ or Account‑Based SaaS Pricing
Common among broader analytics platforms:
- Pricing is based on number of users, properties, or accounts, sometimes with feature tiers.
- Google Shopping is typically one part of the feature set. (Source: Google Analytics 4 overview)
Pros
- Easier to forecast as a fixed SaaS line item.
Cons
- May not correlate well with Shopping performance or product count.
3.3 SKU‑ Feed‑ or Channel‑Based Pricing
Feed‑centric tools often price by number of SKUs, feeds, or channels you manage across Google and other marketplaces. (Source: GoDataFeed launch guide)
Pros
- Fair when your complexity truly scales with catalog size.
Cons
- Can penalize wide catalogs even when budgets are modest.
3.4 One‑Off Implementation and Services
Some vendors add:
- Onboarding or implementation fees for data mapping, margin imports, or custom reporting.
- Optional managed service retainers for ongoing optimization.
How to compare proposals
When you receive quotes:
- Normalize to total annual cost of ownership at your current and forecast ad spend.
- Ask vendors to model break‑even uplift (e.g., “we need +X% profit from Shopping to pay for this”).
- Compare how much of the fee is software vs. services, so you know what’s repeatable vs. one‑off.
4. Trials Pilots And POVs - What “Good” Looks Like
If you’re going to shop for Google Shopping campaign segmentation tools with detailed analytics features, the trial is where you de‑risk the decision.
4.1 Minimum Scope for a Serious Trial
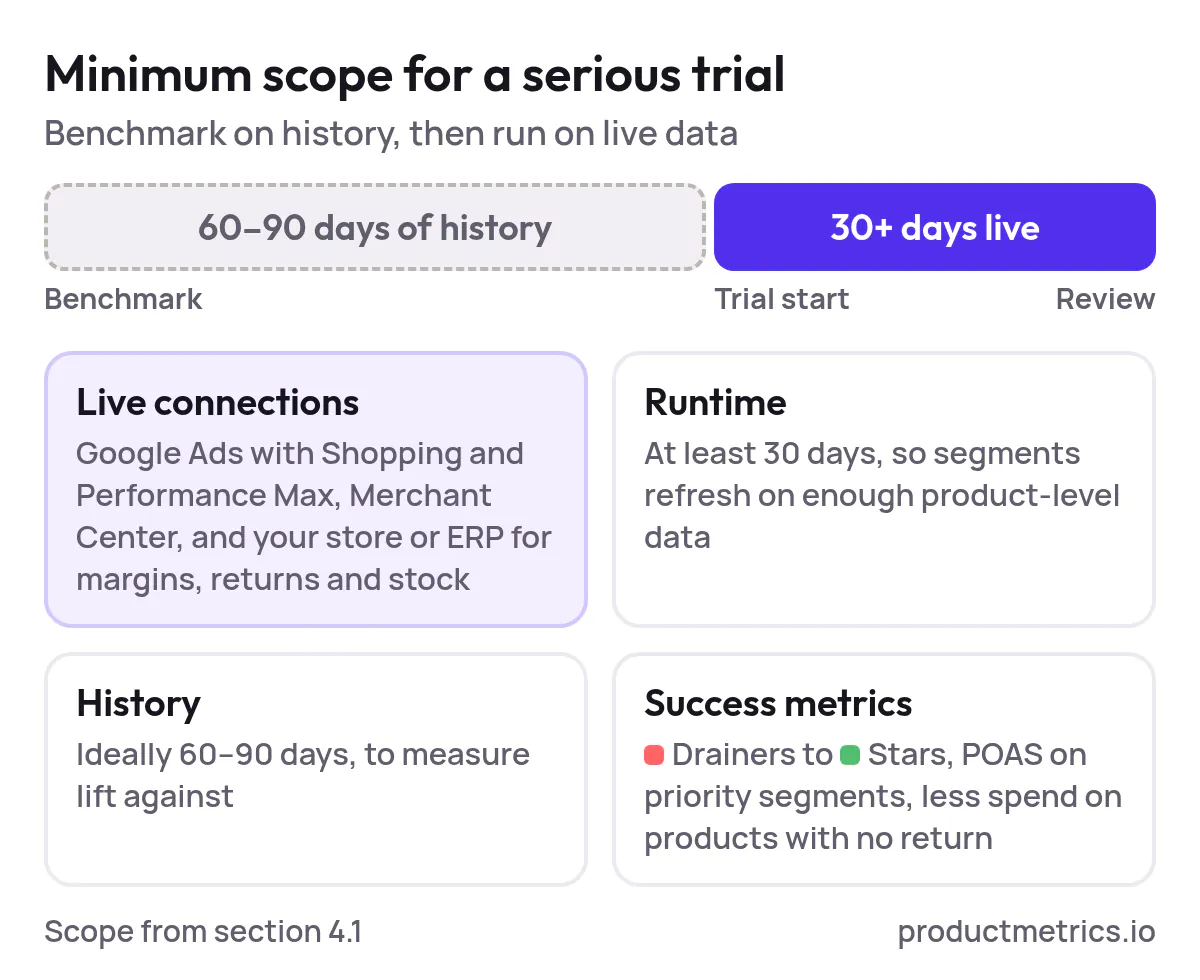
For tools promising granular tracking and segmentation, your POV should include:
- Live connections to :
- Google Ads (including Shopping and Performance Max).
- Google Merchant Center.
- Your ecommerce platform/ERP for margins, returns, and inventory where possible.
- At least 30 days of runtime, so the system can accumulate enough product‑level data and refresh segments.
- Access to historical data, ideally 60–90 days, to benchmark lift.
- Clear success metrics, such as:
- % of spend reallocated from “Drainers” to “Stars” (or equivalent segments).
- Improvement in product‑level ROAS/POAS on priority segments.
- Reduction in wasted spend on products with no return.
Platforms like Product Metrics combine advertising, journeys, competitor prices, margin, and inventory into one product view, which makes these tests straightforward: you can see how label changes and budget shifts affect contribution profit per product. (Source: Product Metrics)
4.2 Evaluation Questions During a POV
During a trial, ask vendors to demonstrate:
- How easily can you drill down from segment to SKU and see the context behind performance?
- Can the tool track profit or POAS, not just revenue, once you provide margins? (Source: AI Advantage Agency Google Shopping guide)
- How are labels written back to Merchant Center? Is it API‑driven, or do you maintain feed rules/scripts yourself?
- Does the platform include reliable tracking, such as server‑side or enhanced conversion setups, to mitigate signal loss? (Source: Product Metrics)
- What’s their recommended rollout playbook from “analysis only” to live campaign changes?
If a vendor can’t show real data from your account, they’re not ready for procurement‑grade evaluation.
5. Onboarding And Timelines - What to Expect After You Sign
Assuming you proceed from trial to contract, here’s a realistic onboarding flow for advanced campaign segmentation and granular performance tracking tools.
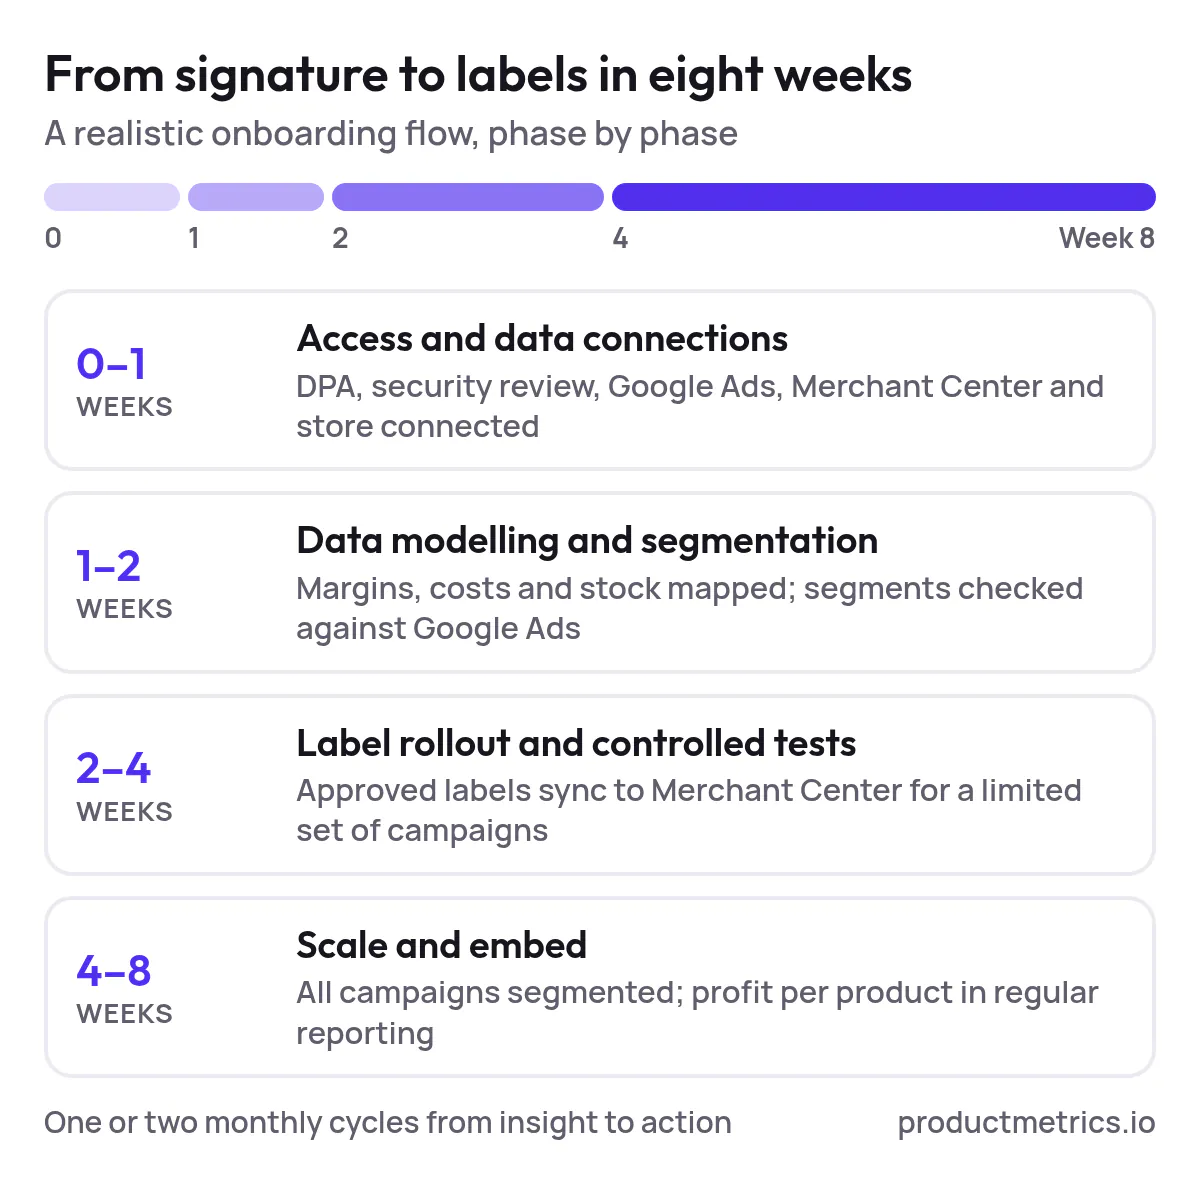
Week 0–1 - Access And Data Connections
- Finalize DPA, security review, and access model (direct or via MCC).
- Connect Google Ads, Merchant Center, and your ecommerce platform/analytics.
- Align on which properties and accounts are in scope.
Week 1–2 - Data Modelling And Segmentation Setup
- Map margins, product costs, and inventory fields where available.
- Configure or validate segmentation schema (e.g., Stars, Cash Cows, Drainers) aligned to your business.
- QA product‑level figures against Google Ads / Merchant Center reports for sanity. (Source: Google Merchant Center Help)
Week 2–4 - Label Rollout And Controlled Tests
- Approve which labels should sync to Merchant Center.
- Roll out segmentation to a limited set of campaigns or markets first.
- Monitor impact on impression share, ROAS/POAS, and wasted spend per segment.
Week 4–8 - Scale And Embed
- Expand segmentation to remaining campaigns.
- Train local teams on reading product‑level dashboards and taking action.
- Bake KPIs like profit per product and spend share by segment into regular performance reporting. (Source: AI Advantage Agency Google Shopping guide)
A well‑run onboarding should move you from “we see granular analytics” to “we act on them in campaigns” within one or two monthly cycles.
6. RFP Checklist For Granular Google Shopping Segmentation & Analytics
Use this section as a template when you issue an RFP or evaluate vendor proposals for Google Shopping optimization platforms with advanced segmentation and granular tracking.
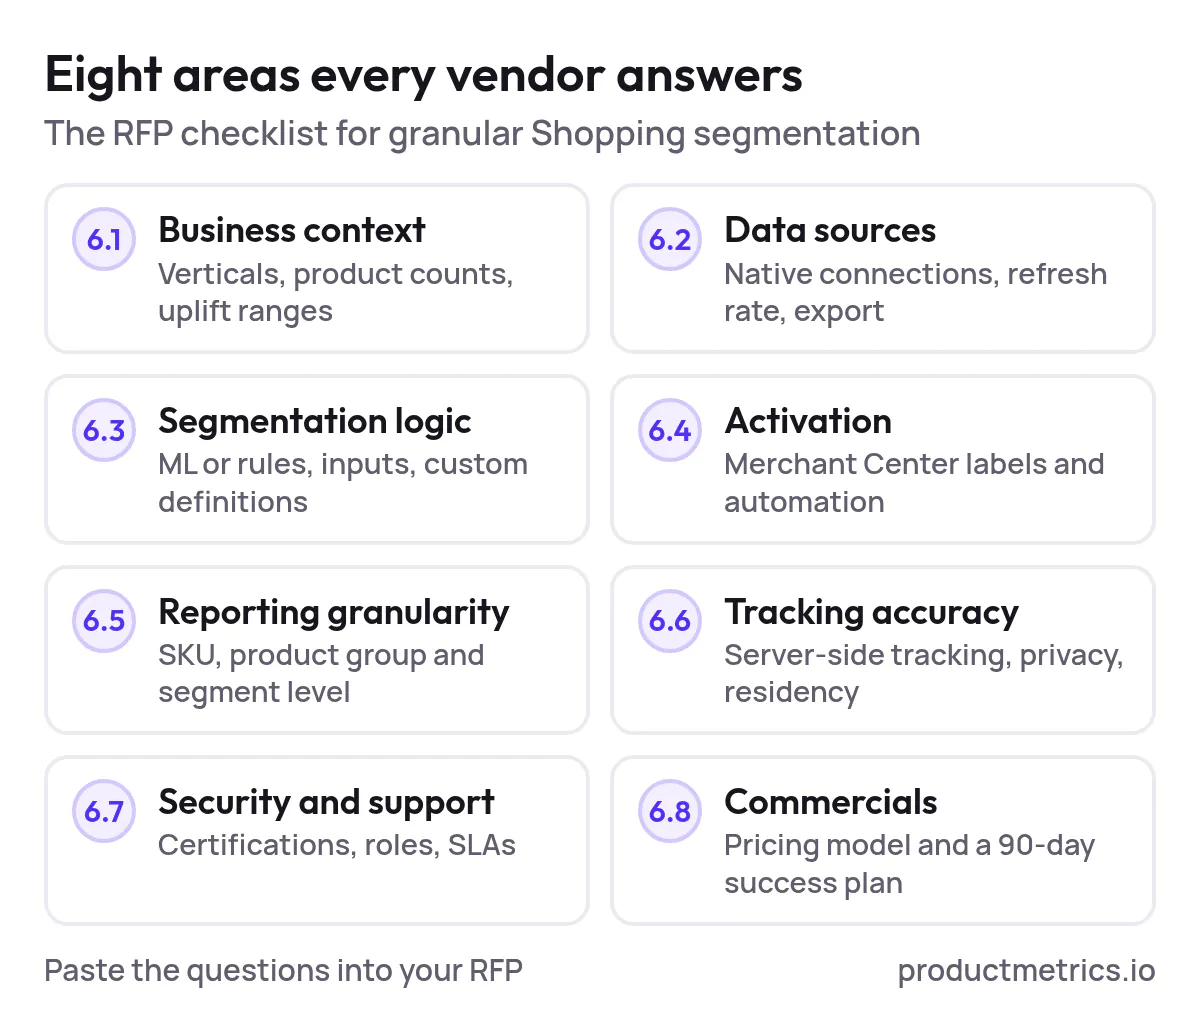
6.1 Business Context
Ask vendors to respond to:
- Which verticals and catalog sizes (SKUs, markets) they typically support.
- Typical uplift ranges they see on:
- Product‑level ROAS/POAS.
- Reduction in wasted Shopping spend.
- Time saved vs. manual spreadsheet analysis.
- Case studies relevant to your AOV, margins, and channels.
6.2 Data Sources And Integrations
Questions for vendors
- Which of the following do you connect to natively?
- Google Ads (including Performance Max).
- Google Merchant Center.
- GA4 or other analytics.
- Ecommerce platform/ERP for costs and inventory. (Source: GetApp overview of Product Metrics)
- How frequently do you refresh product‑level data (e.g., daily, intra‑day)?
- Can we export raw data to our warehouse if needed?
6.3 Segmentation Logic And Customization
Require clarity on
- How products are segmented (ML, rules, or both) and which inputs are used.
- Whether you can customize segment definitions (e.g., different margin thresholds or POAS targets by category).
- Whether the tool supports multi‑level segmentation (e.g., by lifecycle, profitability, stock status, and price position simultaneously).
Ask vendors like Product Metrics to show how they assign products into segments such as Stars, Cash Cows, and Drainers, and how stable those segments remain over time. (Source: Product Metrics)
6.4 Activation - Labels Campaigns And Automation
Key requirements
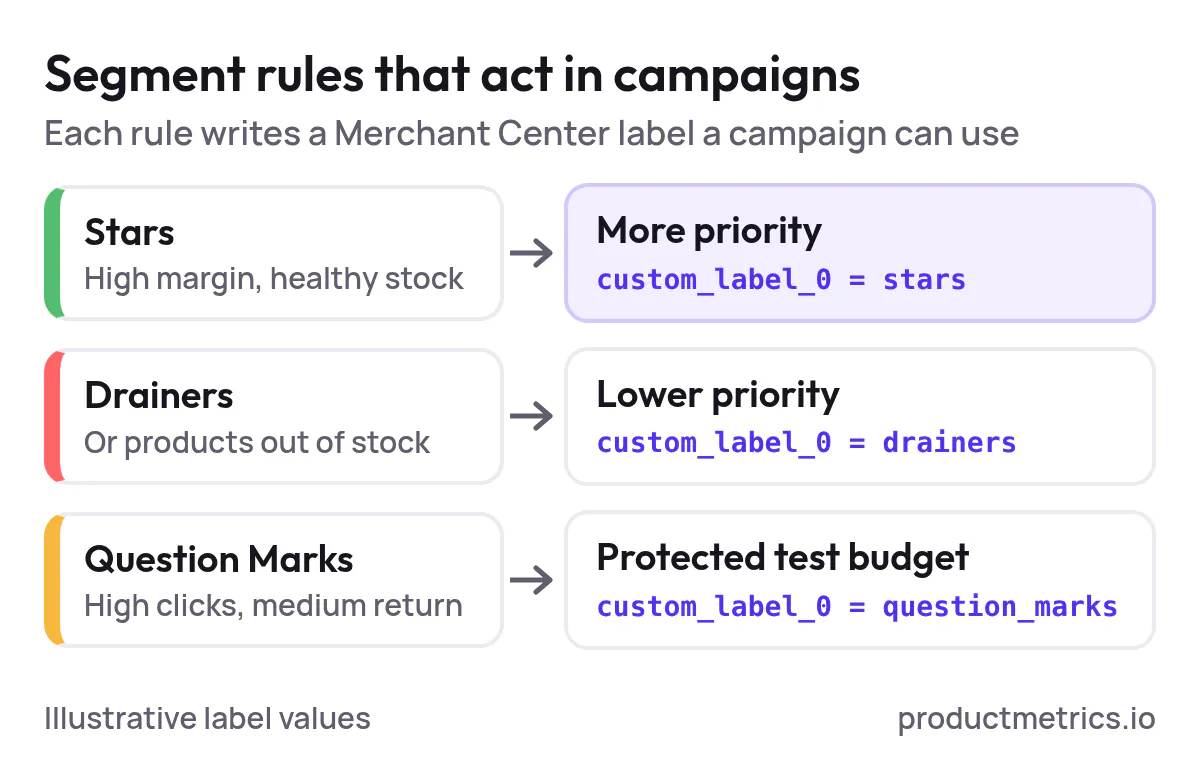
- Automatic Merchant Center label writing based on segment assignments.
- Compatibility with your existing campaign structure (standard Shopping, Performance Max, or mixed). (Source: Google Ads API documentation)
- Support for rules like:
- Increase bids or budgets for high‑margin Stars with healthy stock.
- De‑prioritize Drainers or out‑of‑stock products.
- Protect exploration budgets for promising Question Marks.
Clarify whether automation happens inside the platform or you need to maintain scripts and feed rules yourself.
6.5 Analytics And Reporting Granularity
Ensure the platform can:
- Report at SKU level, product‑group level, and custom segment level.
- Slice performance by:
- Device, location, audience lists where available.
- Margin bands and inventory thresholds.
- Price competitiveness vs. key rivals.
- Track profit and POAS once you supply margins, not just revenue/ROAS. (Source: AI Advantage Agency Google Shopping guide)
Ask for example dashboards or a live environment with anonymized data to validate.
6.6 Tracking Accuracy And Privacy
Probe for:
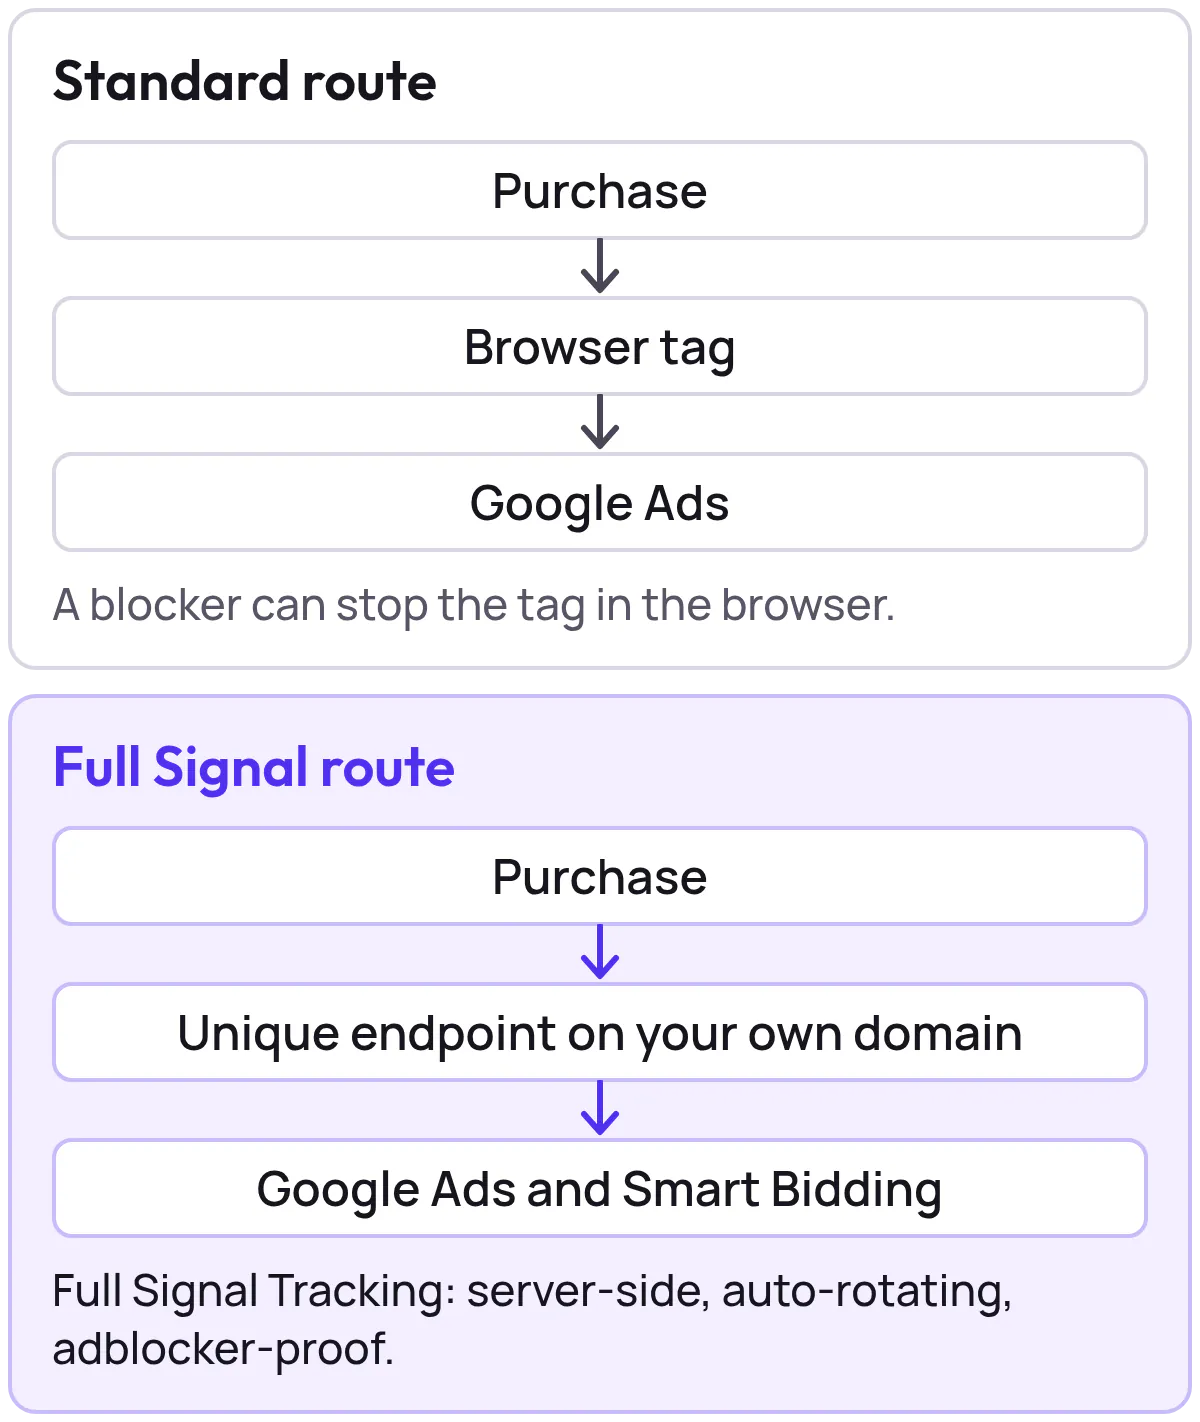
- Support for server‑side tracking or enhanced conversions, to mitigate cookie loss and ad‑blockers.
- How conversion data feeds back into Google Ads to improve bidding. (Source: Google Analytics 4 overview)
- Data residency, retention policies, and alignment with your compliance requirements.
Platforms like Product Metrics include server‑side tracking options to maintain signal quality for product‑level decisions, which is critical when segmentation relies on accurate conversion data. (Source: Product Metrics)
6.7 Security Governance And Support
Include questions on:
- Certifications, pen‑testing cadence, and access controls.
- Role‑based permissions (e.g., who can approve label changes vs. view analytics only).
- Support model: chat, email, CSM, implementation specialists.
- SLAs for uptime and issue response.
6.8 Commercials And Success Plan
Ask every vendor to provide:
- Clear pricing for:
- Software subscription (specify if spend‑based, SKU‑based, or seat‑based).
- Onboarding/implementation.
- Optional managed services.
- A 90‑day success plan covering:
- Milestones from connection to first spend reallocation.
- KPIs and reporting cadence.
- Joint responsibilities (your team vs. vendor).
7. Turning This Into a Shortlist And Decision
By this point, you should have:
- A clear definition of the granularity you need (SKU, segment, profit, and context like journeys and inventory).
- A view of where to buy:
- Specialist platforms like Product Metrics when Google Shopping is strategic.
- Feed tools if feed control is your top concern.
- Broad analytics if Shopping is one piece of a larger data initiative.
- An understanding of pricing trade‑offs between spend‑based, seat‑based, and SKU‑based models.
- An RFP framework that forces vendors to prove they can deliver real, product‑level control—not just prettier reports.
If Google Shopping and Performance Max already command a meaningful share of your media budget, the risk is no longer buying “too much” granularity. It’s staying stuck at campaign‑level views while competitors shift spend toward the products that actually drive profit.
Next Step - See Granular Segmentation in Your Own Data
To move from theory to numbers, plug your accounts into a specialist platform and see how your catalog looks when it’s segmented by return, margin, and stock rather than just clicks.
You can start by connecting Google Ads and Merchant Center to Product Metrics for a free analysis and trial, then use the RFP checklist above to benchmark it against any alternatives you’re considering. (Source: Product Metrics)
That way, your procurement decision is grounded not in slideware, but in your own product‑level performance data.
Written by
Berend Vrakking, Founder of Product Metrics
1M+ products analysed · Nominated at the Dutch Search Awards for Best Measurement Campaign (2023) and Best Use of Data (2024)
Keep reading.
The 2026 Buyer’s Guide to Google Shopping Campaign Segmentation Platforms (US)
The 2026 Buyer’s Guide to Google Shopping Campaign Segmentation Platforms: segmentation and SKU-level tracking for US Shopping teams.
Custom Label Intelligence: Segment, Bid, and Measure Granularity In Google Shopping
Custom Label Intelligence for Google Shopping: a five-slot label schema, label-level dashboards and an experimentation ladder for Shopping and Performance Max.
Designing Multi‑Level Performance Dashboards For Segmented Google Ads From Campaigns To SKUs
Designing Multi‑Level Performance Dashboards For Segmented Google Ads From Campaigns To SKUs: metric ladders, role views and latency tiers for Shopping and PMax
See which of your products to push, fix or pause. Start with your own products, or a 30-second estimate.
Check one product first: work out its break-even ROAS in the calculator. Then see where all your products stand.
Questions, or want to spar about your products? Book a demo: a video call with Berend, then a demo account.