
Customizable Reporting For Google Shopping ROAS - Real-Time, Drag-And-Drop, And Personalized Dashboards In ProductMetrics
Customizable reporting for Google Shopping ROAS - real-time, drag-and-drop and personalised dashboards, built on product segments, labels and POAS.
If you manage Google Shopping or Performance Max, you probably live in dashboards already. Google Ads, Merchant Center, GA4, a BI tool, maybe a profit app on the side. Each shows a slice of ROAS, but none tells the whole story at the product level.
Customizable reporting dashboards are how you turn all of that into one decision layer: which products to push, which to fix, and which to pause today.
This guide shows how to build that layer around Product Metrics, with:
- Up-to-date, product-level ROAS and POAS widgets
- Drag-and-drop dashboard layouts in your reporting stack
- Personalized views for PPC, merchandising, and finance
- Blended data from Google Ads, Merchant Center, GA4, and your store
Along the way, we will map these concepts to the actual Product Metrics features you can use right now.
Why Generic Shopping Dashboards Keep Failing ROAS Decisions
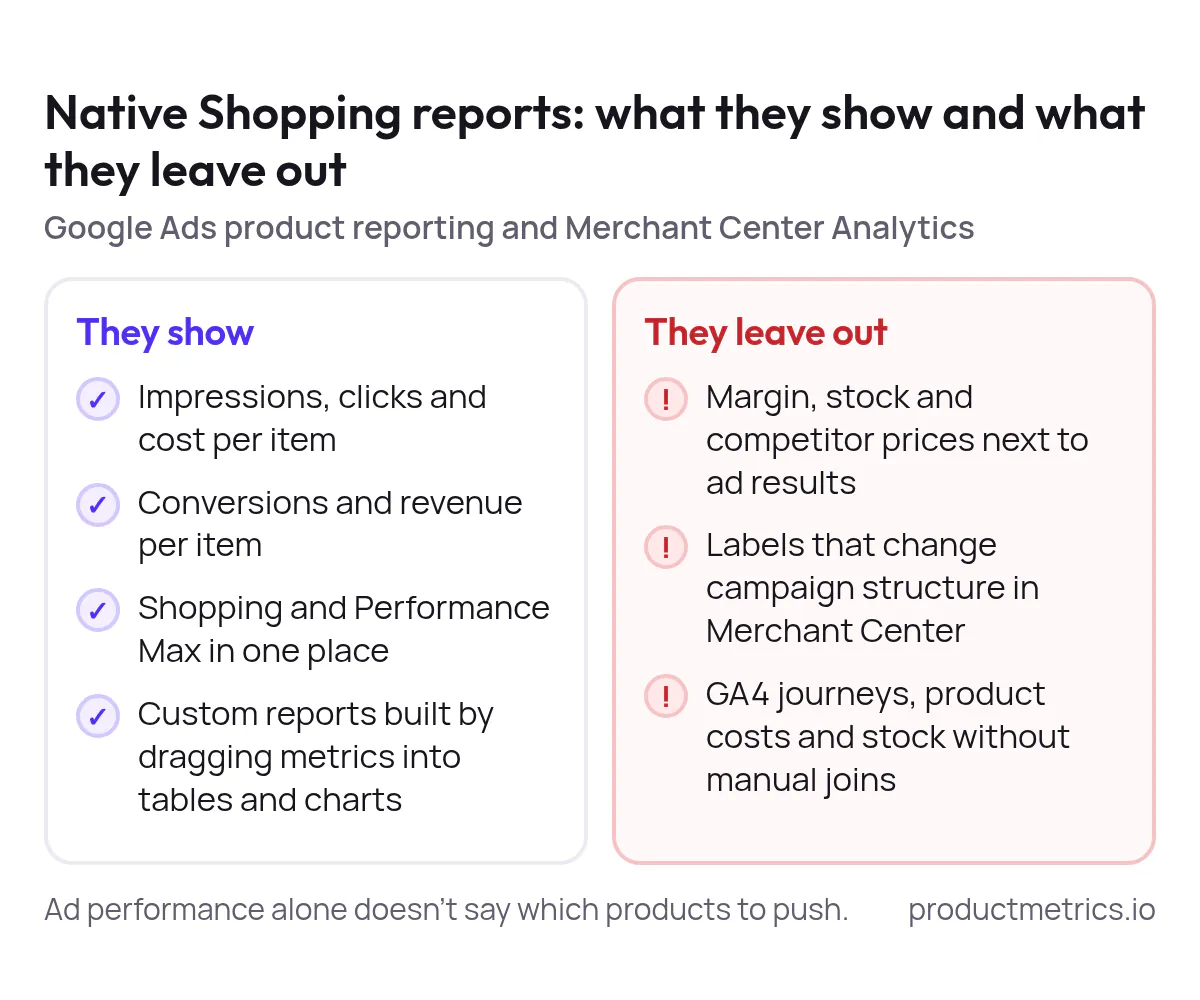
Google Ads already offers product reporting that centralizes Shopping and Performance Max performance across campaigns. You can see impressions, clicks, cost, conversions, and revenue per item from your linked Merchant Center account. (Source: Google Ads Help)
Merchant Center now adds its own Analytics section, with Custom Reports and dashboards you can build by dragging metrics like clicks, impressions, and click-through rate into tables and charts. (Source: Merchant Center Help)
Those tools are essential but limited when you are trying to optimise ROAS at the product level:
- They show ad performance, not margin, inventory, or competitor prices next to it.
- They do not automatically translate insights into campaign structure or Merchant Center labels.
- They require manual joins if you want GA4 journeys, product costs, and stock in the same view.
That is the gap Product Metrics is built to fill: a SaaS workspace that pulls together Google Ads, GA4, pricing, inventory, returns, and margin data so ecommerce brands and PPC specialists can optimise Shopping and Performance Max at the product level. (Source: GetApp overview of Product Metrics) The core platform provides advertising analytics, campaign insights, optimisation tools, and performance dashboards. (Source: Product Metrics – Terms)
What A Customizable ROAS Dashboard Should Actually Do
When people search for Google Shopping optimisation tools offering customizable reporting dashboards for ecommerce, they are rarely asking for prettier charts. They are asking for control.
A useful Google Shopping ROAS dashboard should deliver four capabilities.
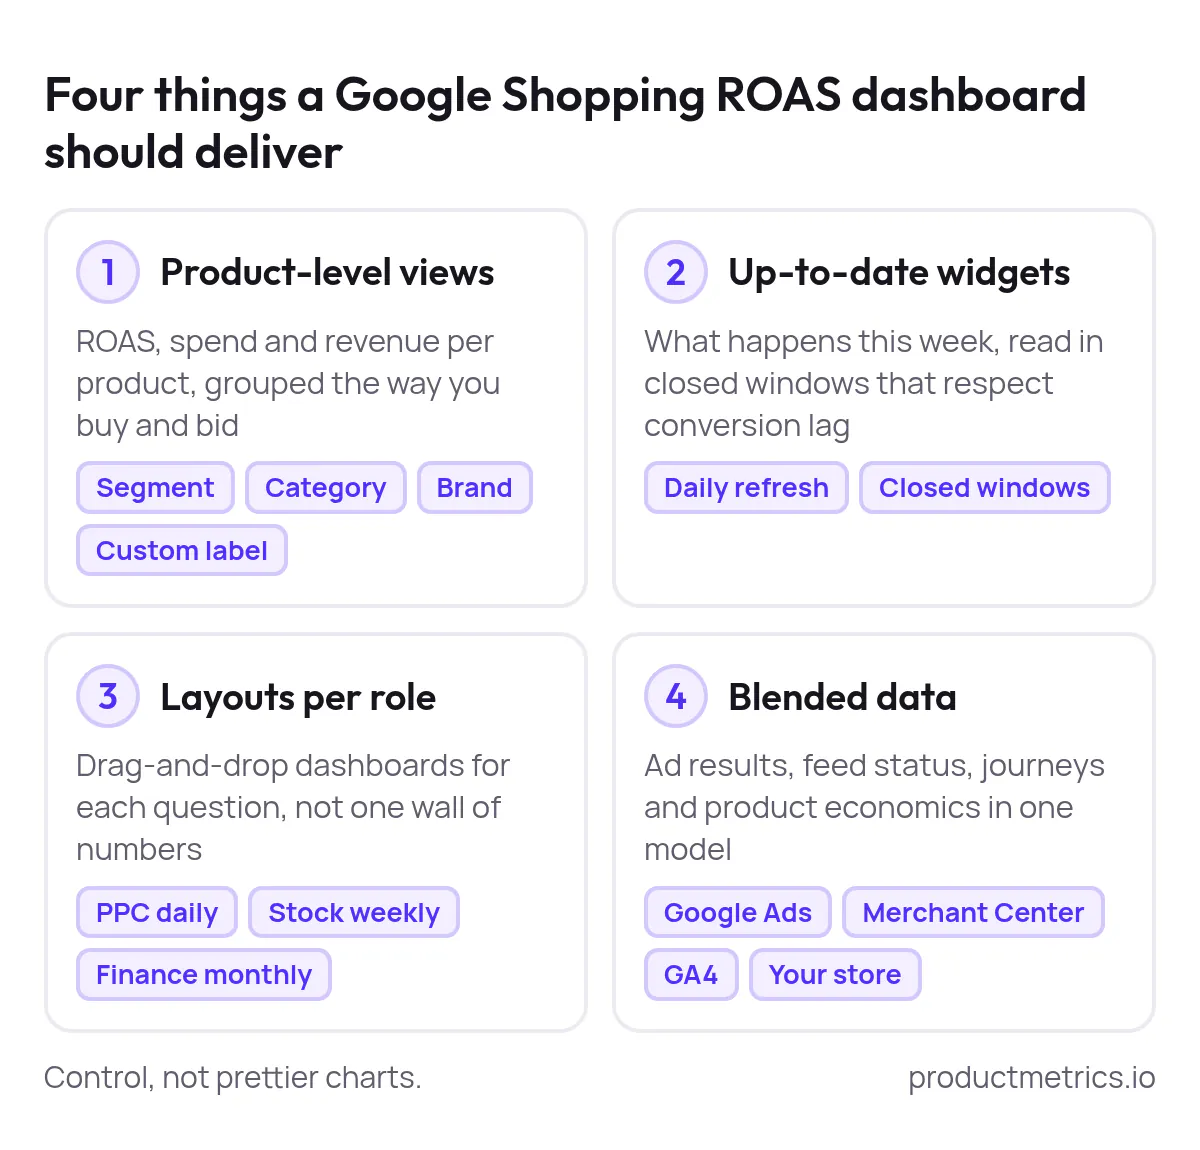
1. Product-Level Views That Match How You Buy And Bid
At a minimum you need ROAS, spend, and revenue per product, but most decisions are made one layer up:
- Product segment: stars, question marks, cash cows, dogs, drainers, ghosts
- Category or brand
- Custom labels driven by margin, stock, or price position
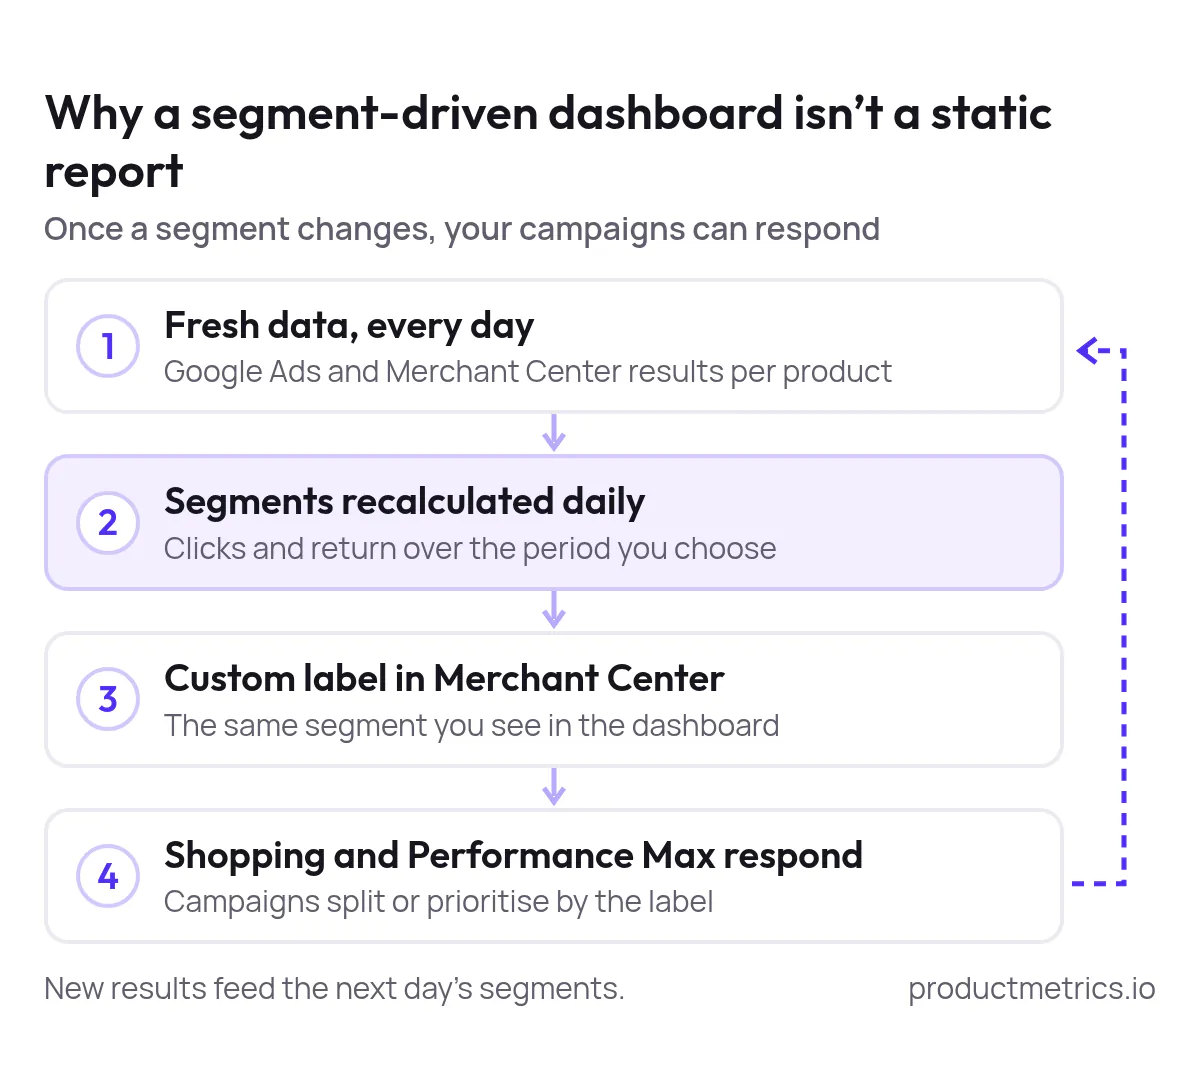
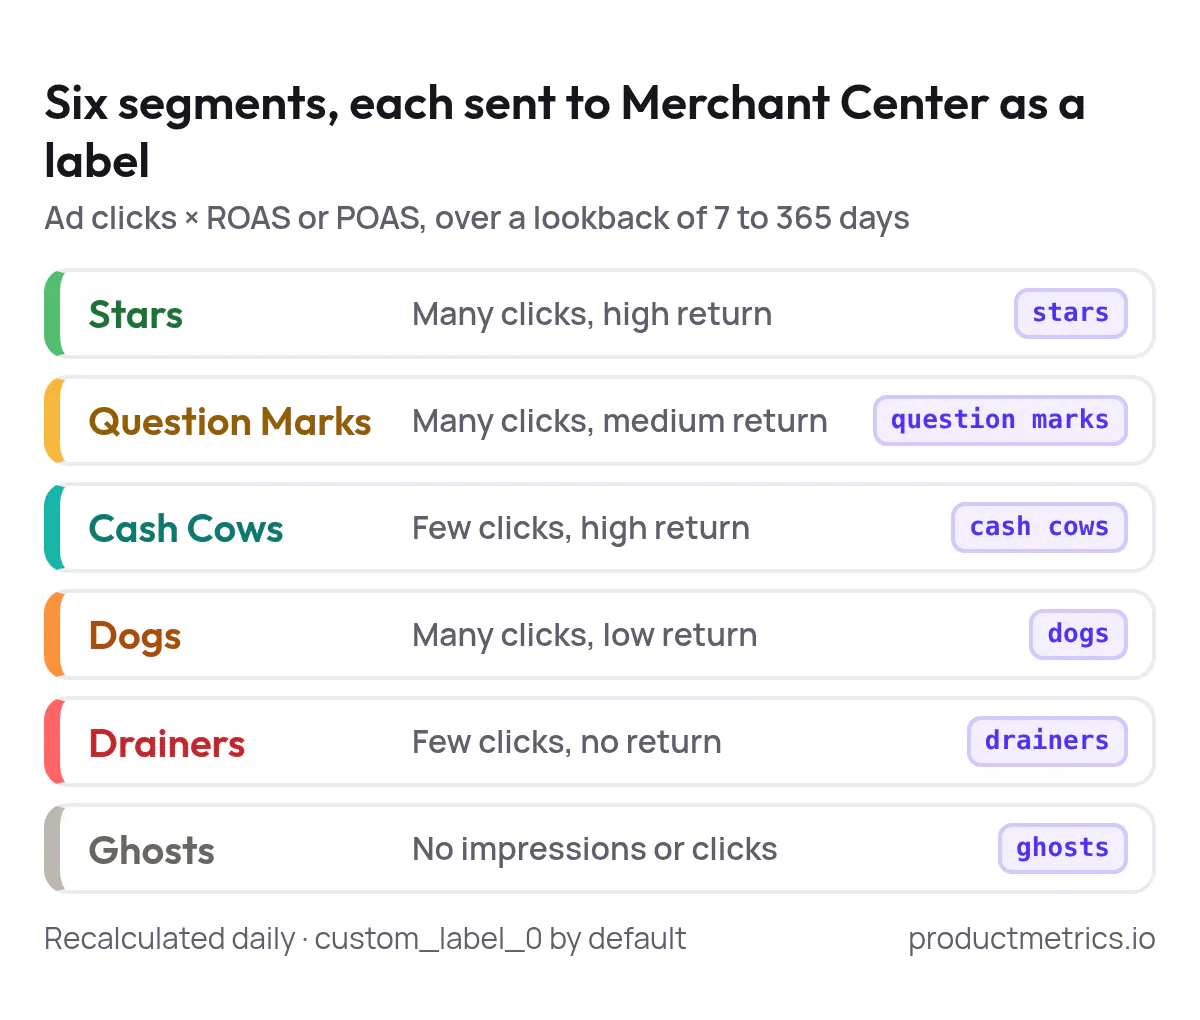
Product Metrics does this by grouping products into six machine-learning segments based on clicks and return, recalculated daily over a period you choose, and then writing those segments into Merchant Center custom labels you can use in Shopping and Performance Max. (Source: Product Metrics – Performance Max)
That is the key difference from a static report: once a segment changes, your campaigns can respond.
2. Up-To-Date Widgets Instead Of Last Month’s PDF
Google Ads and Merchant Center both update their product performance data continuously, and GA4 offers real-time and near-real-time reporting on visitor behaviour and conversions. (Source: Google Ads Help) (Source: Niche – Mastering GA4)
Product Metrics builds on that by:
- Reading fresh Google Ads and Merchant Center data daily
- Bringing in margin and stock cover from your ecommerce platform
- Feeding back product-level labels to Merchant Center so Shopping and Performance Max see the same segments you do in the dashboard (Source: Product Metrics homepage)
You still respect conversion lag and closed windows for analysis, but the point is that widgets should reflect what is happening this week, not what happened in last quarter’s deck.
3. Drag-And-Drop Layouts And Role-Specific Views
You do not need every stakeholder staring at the same wall of numbers.
Tools like Merchant Center Custom Reports and most BI platforms let you drag metrics into tables and charts, resize tiles, and build dashboards for specific questions. (Source: Merchant Center Help) In GA4 and modern product analytics tools, each user can save dashboards and reports tailored to their objectives. (Source: UXCam – Custom dashboard tool)
For Shopping ROAS, that usually means distinct layouts for:
- Daily PPC execution
- Weekly inventory and pricing
- Monthly finance and leadership
Product Metrics fits underneath as the product-level truth layer: segments, labels, journeys, and stock context that you can visualise in its own dashboards and mirror in whatever drag-and-drop reporting surface your team prefers. (Source: Ecommerce analytics platforms – Product Metrics)
4. Blended Data - Google Ads, Merchant Center, GA4, And Your Store
To really understand ROAS, you need all of these in one model:
- Ad cost and clicks from Google Ads
- Eligibility and benchmark price from Merchant Center product reporting or the Merchant Reports API (Source: Shopping product reporting – Google Ads API) (Source: Merchant Reports API – Google)
- Journeys, cross-sell, and on-site behaviour from GA4
- Margin, refunds, and stock from your ecommerce platform
Product Metrics brings those together per product:
- Product Journeys ties GA4 ecommerce events exported to BigQuery back to the Merchant Center item id, showing what a click on each product sells directly and as cross-sell. (Source: Product Journeys – Product Metrics)
- Inventory Insights projects demand, computes stock cover, flags slow-moving stock, and turns inventory status into labels that campaigns can act on. (Source: Inventory Insights – Product Metrics)
- Full Signal Tracking sends every confirmed order from your own domain to Google Ads and Meta, including revenue, profit, and customer type, so POAS and LTV-based bidding become reliable. (Source: Product Metrics – WooCommerce) (Source: Enhanced conversions vs server-side tracking – Product Metrics)
The result is a customizable reporting layer where ROAS widgets are built on real profit and product context, not just platform-attributed revenue.
Layer 1 - The Product Metrics Foundation For Customizable ROAS Reporting
Before you worry about layouts and widgets, you need a clean, connected foundation. A typical setup looks like this.
Step 1 - Connect Google Ads, Merchant Center, GA4, And Your Shop
Product Metrics connects directly to Google Ads and Merchant Center, plus your ecommerce platform (Shopify, WooCommerce, Magento, Lightspeed, Shopware 6). GA4 is optional but recommended when you want Product Journeys. (Source: Product Metrics homepage) (Source: Product Journeys – Product Metrics)
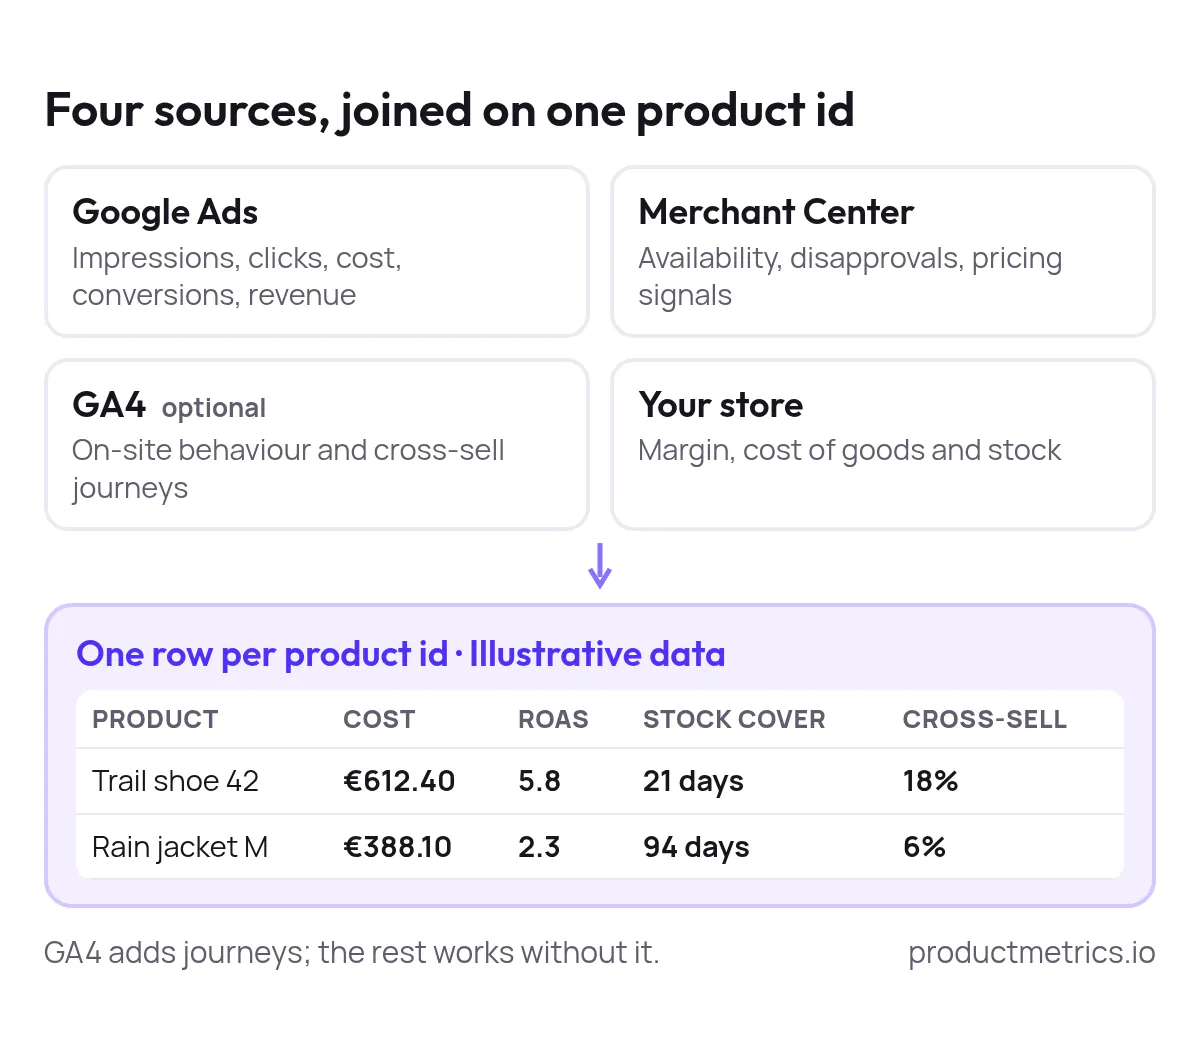
This gives you, for every product id:
- Impressions, clicks, cost, conversions, and revenue from Shopping and Performance Max
- Merchant Center availability, disapprovals, and pricing signals
- On-site behaviour and cross-sell journeys from GA4
- Margin, cost of goods, and stock from your store
Step 2 - Turn Signals Into Product Segments And Labels
Product Segmentation uses machine learning to group products into six segments based on clicks and return, then writes those segments to Merchant Center as custom labels. You choose the lookback window (7 to 365 days) and Product Metrics recalculates segments daily. (Source: Performance Max – Product Metrics)
These labels become the backbone of your dashboards and your campaign structure:
- Stars: high return, worth more budget
- Question marks: promising, need testing
- Dogs and drainers: low return, candidates for lower priority
- Ghosts: no recent spend or impressions
Step 3 - Validate Tracking And Switch To POAS When Ready
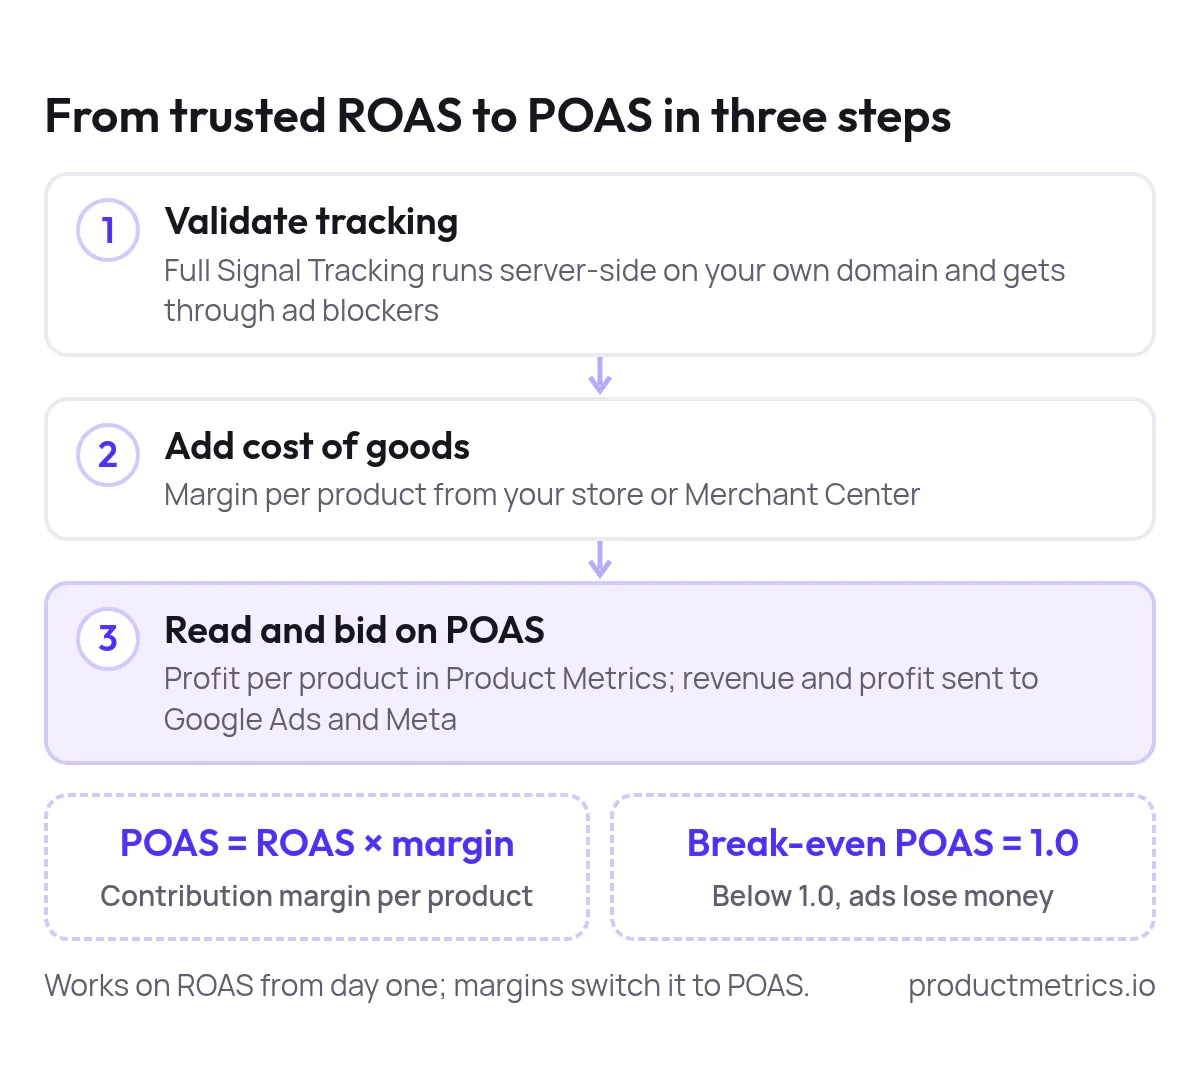
Full Signal Tracking runs server-side on your domain, getting through ad blockers and shortening the gap between real orders and what ad platforms see, while respecting consent. (Source: Enhanced conversions vs server-side tracking – Product Metrics)
Once revenue tracking is trusted, you can add cost of goods and move from ROAS to POAS and profit per product inside Product Metrics, while still feeding standard conversion values back to Google Ads and Meta. (Source: Magento platform page – Product Metrics)
That is the data basis your customizable dashboards will sit on.
Layer 2 - Dashboard Pattern 1 – Daily Shopping And PMax Cockpit
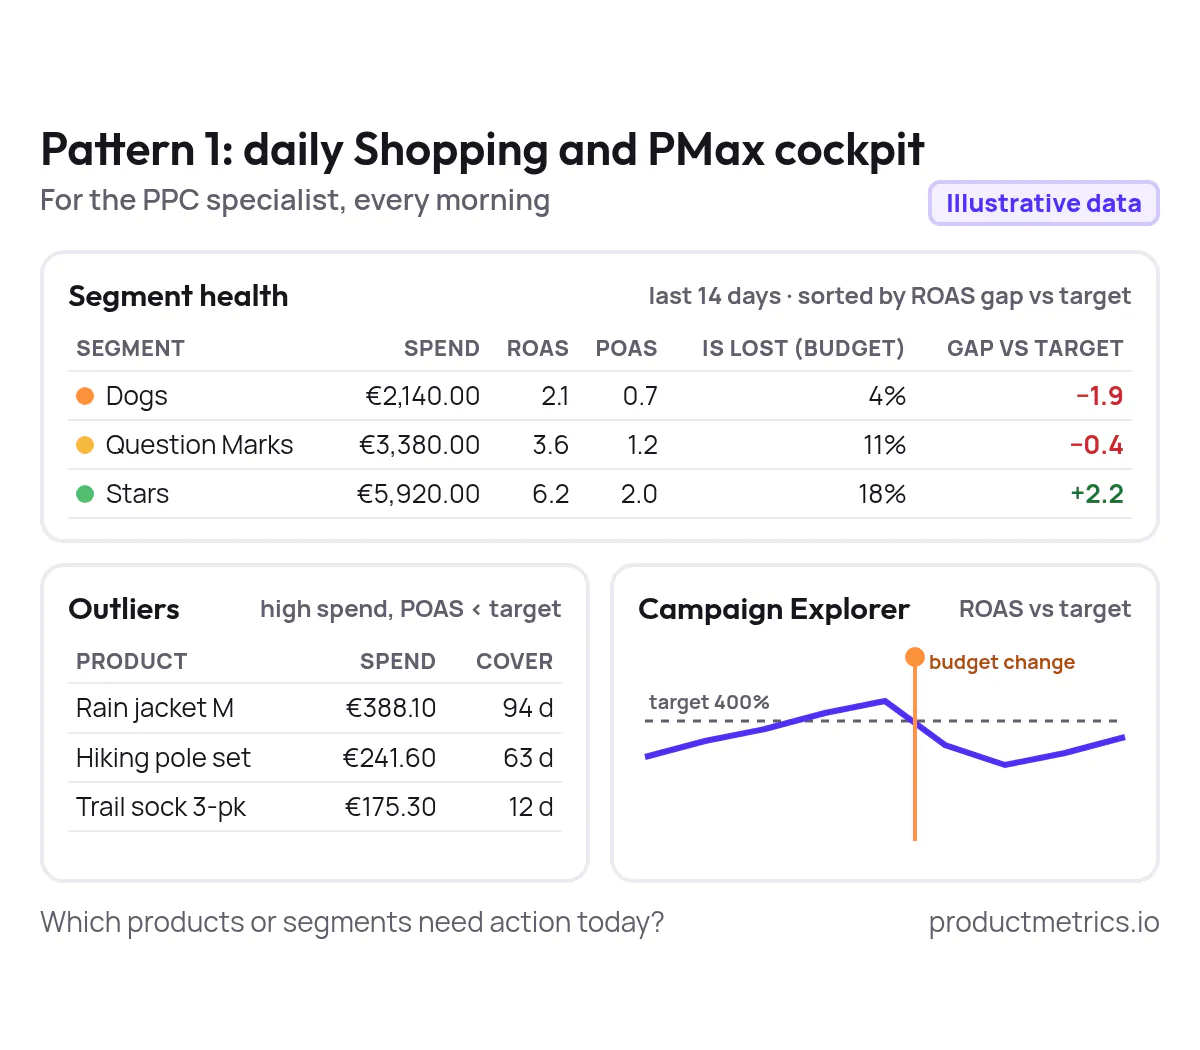
This pattern is for the PPC specialist who logs in every morning and asks: where is spend going, and which products or segments need action today?
You can build this view directly in the Product Metrics dashboard and mirror it in your BI tool or Merchant Center Custom Dashboards.
Core Widgets
-
Segment health table
- Dimensions: product segment, category, brand
- Metrics (last 14 and 30 days): spend, revenue, ROAS, POAS, impression share, impression share lost to budget and rank
- Behaviour: sortable by spend and ROAS gap vs target
In Product Metrics, the Product Segmentation dashboard already contrasts POAS and segment over two windows (for example 30 vs 14 days), so a star that has stopped converting drops out of Stars quickly. (Source: Performance Max – Product Metrics)
-
Product-level outlier table
- Dimensions: product id, name, segment, Merchant Center label
- Metrics: spend, ROAS vs target, stock cover, price position, competitor count
- Filters: only show products with high spend and POAS below target, or with high stock cover
Product Metrics surfaces many of these signals per product, including price position versus comparable competitors and stock cover from Inventory Insights. (Source: Google Shopping monitoring – Product Metrics) (Source: Inventory Insights – Product Metrics)
-
Campaign Explorer
- Line chart of daily ROAS per Shopping or PMax campaign, with target lines and annotations for budget or target changes
- Filters: segment label, country, device
Product Metrics includes a Campaign Explorer chart that plots campaign-level ROAS against its target and marks each change event (target or budget) on the timeline. (Source: Performance Max – Product Metrics)
When To Use It
- Daily or several times a week
- To spot campaigns or segments where ROAS has slipped before month-end
- To decide which products to push, fix, or pause directly in Shopping and PMax
Because the inputs are already joined in Product Metrics, your external dashboards only need to re-arrange these widgets visually with drag-and-drop.
Layer 3 - Dashboard Pattern 2 – Weekly Inventory, Pricing, And ROAS
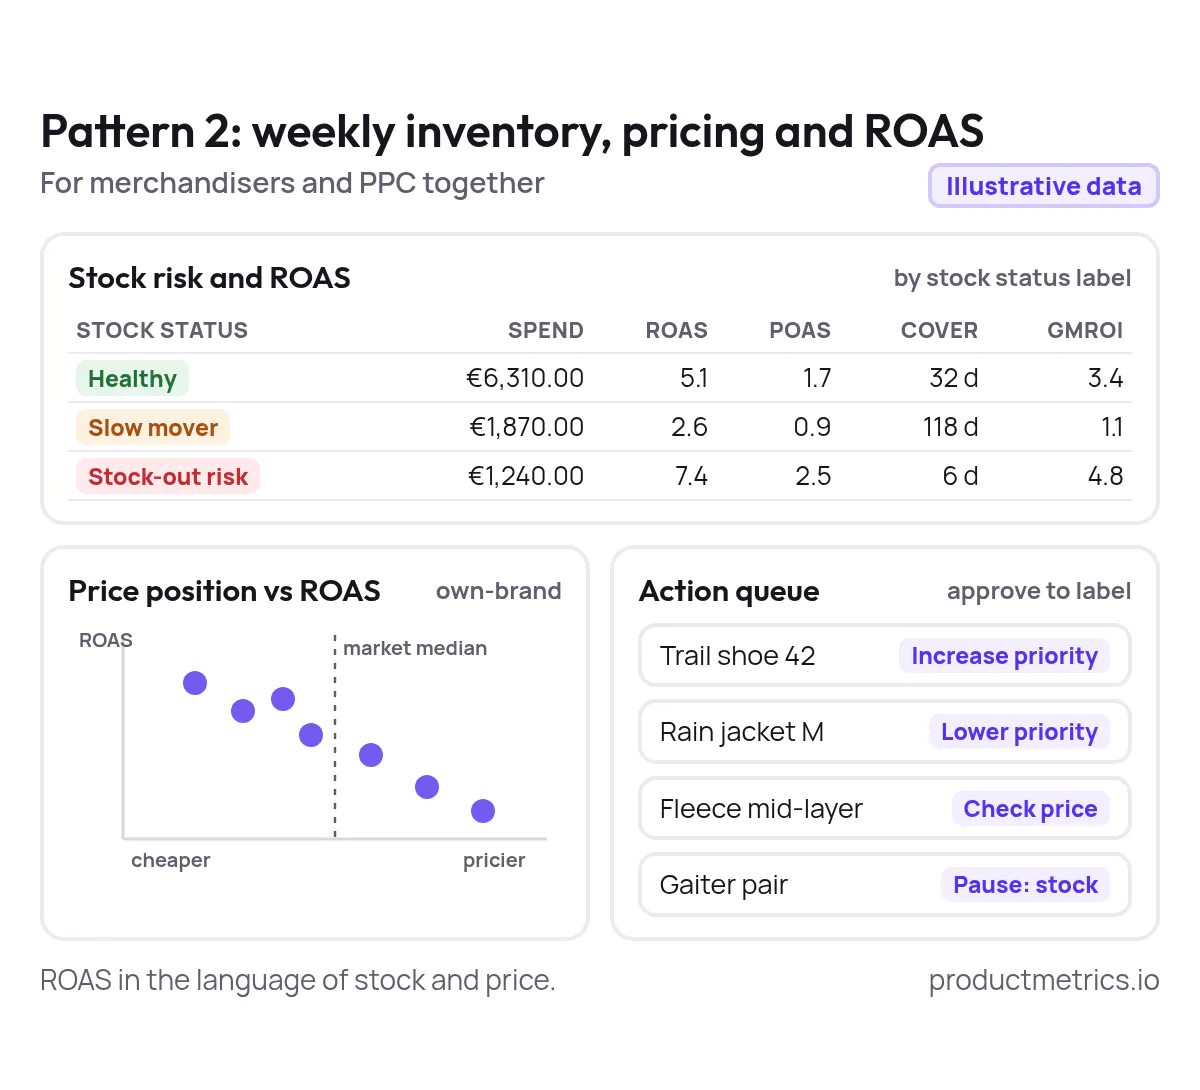
The second pattern combines Inventory Insights, Competitor Prices, and ROAS into one view for merchandisers and PPC working together.
Core Widgets
-
Stock risk and ROAS matrix
- Dimensions: product segment, stock status label (healthy, slow mover, stock-out risk)
- Metrics: spend, revenue, ROAS, POAS, stock cover, gross margin, GMROI
Inventory Insights calculates reorder dates and flags slow-moving stock based on projected demand, lead time, and safety buffer, and Product Metrics reports GMROI and excess capital per product and category. (Source: Inventory Insights – Product Metrics) (Source: Ecommerce inventory planning – Product Metrics)
-
Price position versus ROAS
- Dimensions: product id, category, own-brand vs branded
- Metrics: price index versus market, ROAS, impressions, click-through rate
Product Metrics Competitor Prices matches own-brand products without shared GTINs using style, colour, and dimensions you approve, then writes a price-position label back to Merchant Center. (Source: Product Metrics homepage) (Source: Google Shopping monitoring – Product Metrics)
-
Action queue
- A simple table or kanban-style list of products tagged for:
- Raise or lower Shopping priority
- Adjust price
- Pause because of stock or policy issues
Product Metrics turns these into Merchant Center labels you approve; your Shopping and PMax structures can then split or bid by those labels instead of manual product groups. (Source: Product Metrics homepage)
- A simple table or kanban-style list of products tagged for:
When To Use It
- Weekly
- To decide which products move from promotion to clearance and vice versa
- To keep paid traffic aligned with what is actually in stock and competitively priced
Here your customizable reporting dashboard is about seeing ROAS in the language of inventory and merchandising, not just marketing.
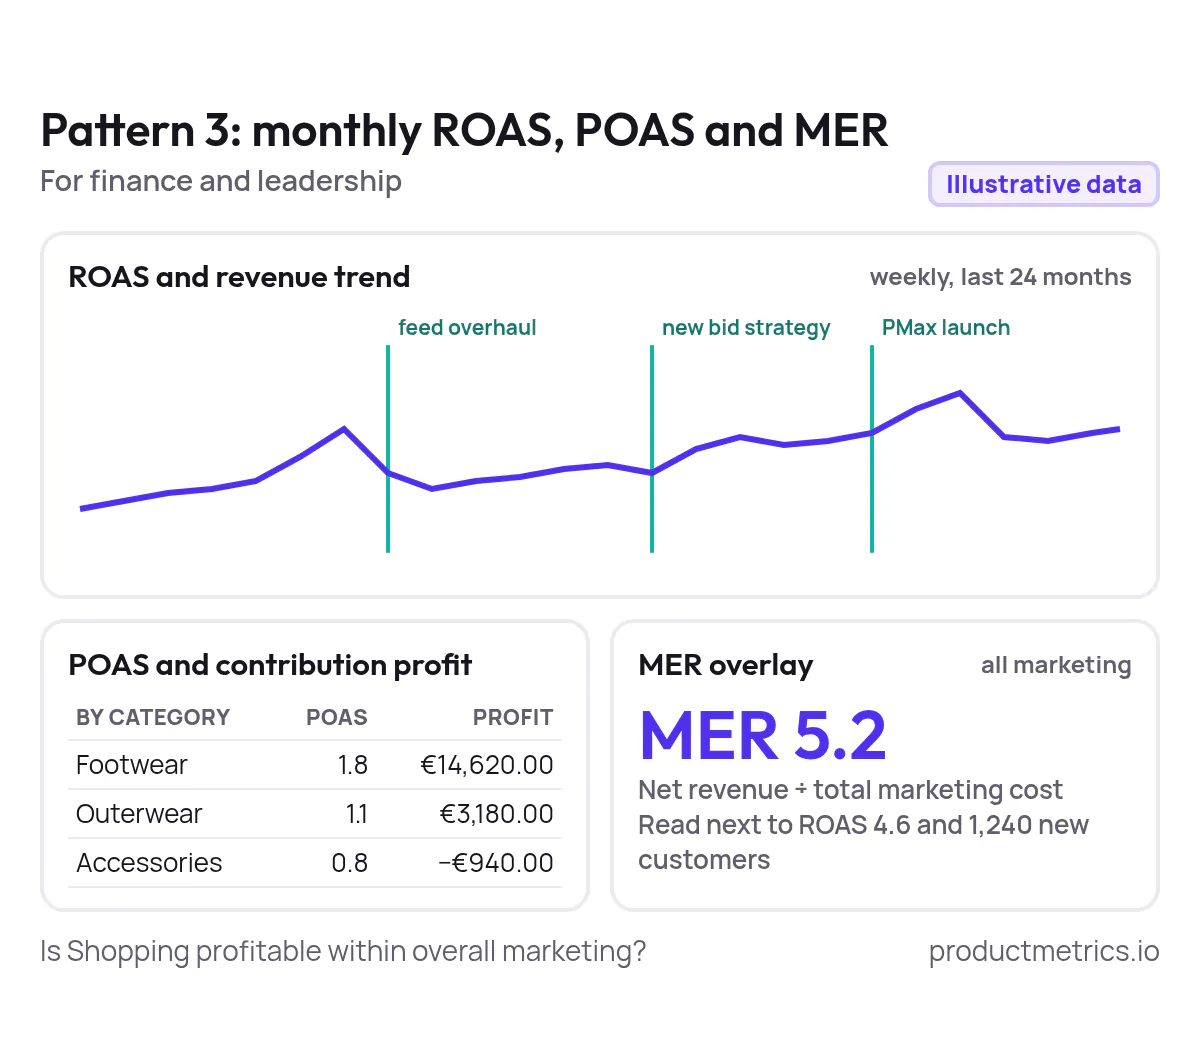
Layer 4 - Dashboard Pattern 3 – Monthly ROAS, POAS, And MER For Leadership
The third pattern is for finance and leadership: it zooms out from product detail to whether Shopping and PMax are profitable within overall marketing efficiency.
Core Widgets
-
ROAS and revenue trend panel
- Weekly or monthly ROAS, spend, and revenue for Shopping and PMax over 12–24 months
- Annotations for structural changes: feed overhaul, new bid strategy, PMax launch
The Historical ROAS Analysis playbook recommends at least 12 months, ideally 24, at weekly granularity to see seasonality and structural shifts, and highlights exactly these trend visualisations. (Source: Historical ROAS analysis – Product Metrics)
-
POAS and contribution profit
- For the same periods, show POAS and contribution profit after product costs
- Break down by major category or brand
Product Metrics can compute profit and POAS per product when you connect margins, then roll those up by category, brand, or price range. (Source: Ecommerce inventory planning – Product Metrics)
-
MER overlay
- Marketing efficiency ratio (MER) panel: total net revenue divided by total marketing cost
- Read next to ROAS and new-customer volume
Product Metrics’ MER guidance stresses that MER belongs on the same dashboard as ROAS or POAS, with clear definitions, so finance and marketing interpret it the same way. (Source: Marketing efficiency ratio – Product Metrics)
When To Use It
- Monthly or quarterly
- To align PPC and merchandising decisions with finance targets
- To decide whether to scale Shopping and PMax, defend, or re-allocate budget to other channels
This is the view most leaders expect when they ask for customizable reporting dashboard solutions for Google Shopping ROAS optimisation.
Personalization And Governance - Keeping Dashboards Useful Over Time
Customizable dashboards become cluttered quickly. A bit of governance keeps them sharp and shareable.
Give Each Role Its Own Default View
- PPC specialists: daily cockpit focused on segment health and underperforming products
- Merchandisers: weekly inventory and pricing view
- Finance and leadership: monthly ROAS, POAS, and MER overview
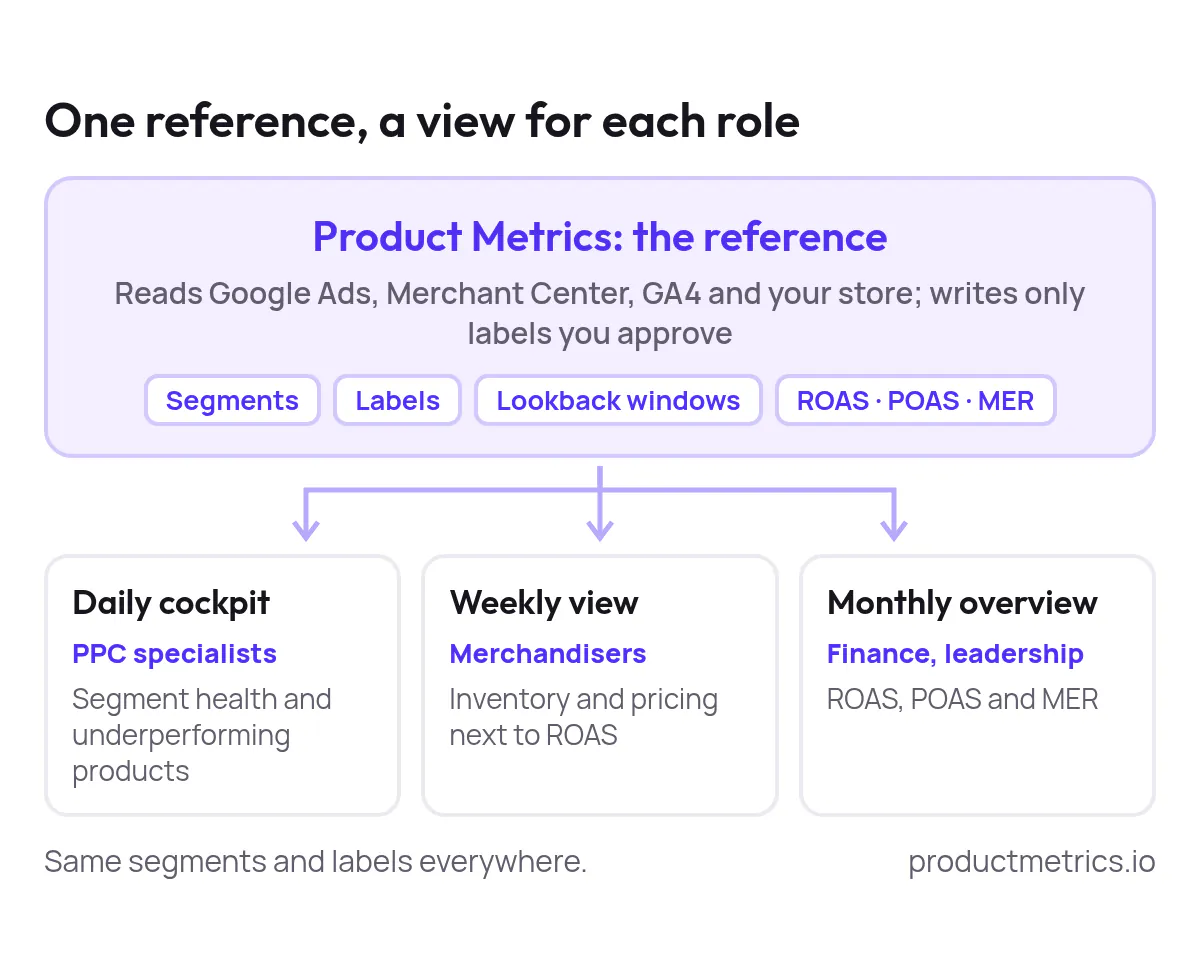
In practice, that means separate dashboards or at least saved filter sets for each audience in your BI tool or Merchant Center dashboards, with Product Metrics providing the same underlying segments and labels everywhere. (Source: Ecommerce analytics platforms – Product Metrics)
Standardise Definitions And Lookback Windows
The Historical ROAS Analysis playbook recommends fixed lookback windows (for example, last 14 or 30 days closed) to avoid undercounting revenue because of conversion lag, and cautions against comparing very recent days at all. (Source: Historical ROAS analysis – Product Metrics)
Bake those rules into your dashboards:
- Lock filters to agreed windows for core ROAS panels
- Label tiles clearly with whether they show ROAS, POAS, or MER
- Document which conversion actions and values feed each metric
Treat Product Metrics As The Reference, Dashboards As Views
Because Product Metrics is reading directly from Google Ads, Merchant Center, GA4, and your store and writing only labels you approve, it becomes your reference for whether a product really earns its keep. (Source: Product Metrics homepage) (Source: Product Journeys – Product Metrics)
Dashboards in GA4, Merchant Center, or your BI tool are then views on that truth, tailored to the decisions and people involved.
Evaluating Google Shopping ROAS Optimisation Tools With Customizable Dashboards
If you are comparing Google Shopping ROAS optimisation tools with fully customizable reporting dashboards, use this checklist.
-
Data coverage
- Does the tool ingest Google Ads, Merchant Center, GA4, and your store data at the product level?
- Can it handle multi-account and multi-country setups?
-
Product-level intelligence
- Does it segment products by clicks and return, not just show raw tables?
- Can it incorporate margin, stock, and competitor prices?
-
Actionability
- Can it write results back to Merchant Center labels for Shopping and PMax to use?
- Does it support server-side or enhanced conversions so ROAS numbers reflect reality?
-
Dashboard flexibility
- Does it ship with prebuilt ROAS dashboards you can use as templates?
- Can you re-use the same product segments and labels inside your own drag-and-drop dashboards?
Product Metrics is built specifically to answer which products should get more or less paid traffic in Google Shopping and Performance Max, then push that answer into Merchant Center labels while still giving you dashboards that summarise segments, campaigns, product journeys, and inventory in one place. (Source: Ecommerce analytics platforms – Product Metrics) (Source: Product Metrics homepage)
Next Steps - Turn Product Metrics Into Your ROAS Command Center
If your current Shopping reporting lives in scattered Google Ads views, one Merchant Center tab, and a few Looker Studio charts, the way forward is incremental:
- Connect Google Ads, Merchant Center, GA4, and your store to Product Metrics and let it build product segments, journeys, and inventory insights.
- Adopt the three dashboard patterns above inside Product Metrics and your BI tool of choice.
- Standardise definitions, lookback windows, and access so everyone is reading the same ROAS, POAS, and MER story.
- Use Merchant Center labels written by Product Metrics to restructure Shopping and PMax around how products actually perform.
From there, your customizable reporting dashboards stop being static reports and become a shared, live decision layer for Google Shopping ROAS optimisation.
Written by
Berend Vrakking, Founder of Product Metrics
1M+ products analysed · Nominated at the Dutch Search Awards for Best Measurement Campaign (2023) and Best Use of Data (2024)
Keep reading.
The 2026 Ecommerce ROAS Optimization Tools Landscape - How Performance Teams Evaluate, Pilot, and Scale
The 2026 ecommerce ROAS optimization tools landscape - how performance teams evaluate, pilot and scale Google Shopping tools with custom dashboards.
How to Build a Google Shopping ROAS Dashboard That Actually Moves Revenue: Templates, Metrics and Workflows
How to Build a Google Shopping ROAS Dashboard That Actually Moves Revenue: the metric stack, drilldowns, alerts and experiment log, with templates.
Best Tools For Google Shopping ROAS Optimization With Customizable Dashboards
Six Google Shopping ROAS dashboard tools scored on five criteria: Google Ads native, Product Metrics, Optmyzr, ProfitMetrics, Channable Insights and GoDataFeed.
See which of your products to push, fix or pause. Start with your own products, or a 30-second estimate.
Check one product first: work out its break-even ROAS in the calculator. Then see where all your products stand.
Questions, or want to spar about your products? Book a demo: a video call with Berend, then a demo account.