
Best Tools For Google Shopping ROAS Optimization With Customizable Dashboards
Six Google Shopping ROAS dashboard tools scored on five criteria: Google Ads native, Product Metrics, Optmyzr, ProfitMetrics, Channable Insights and GoDataFeed.
If you manage Google Shopping or Performance Max, you already know the real bottleneck isn’t data—it’s turning that data into clear, product‑level decisions you can act on today.
This guide compares leading Google Shopping ROAS optimization tools with customizable reporting dashboards, focusing on how they actually help you:
- See ROAS (and profit) at SKU level
- Build flexible dashboards for different stakeholders
- Push those insights back into Google Ads and Merchant Center so campaigns change, not just charts
We’ll walk through the evaluation criteria, scoring rubric, and side‑by‑side comparisons—plus concrete use cases where Product Metrics (productmetrics.io) is the strongest fit.
Why Dashboards Matter So Much For Google Shopping ROAS
Google Shopping and PMax already expose a lot of performance data in the native UI and via the Shopping performance views in the Google Ads API, including product‑level metrics for impressions, clicks, conversions and ROAS. (Source: Google Ads API docs)
More recently, Google added AI‑assisted Report Generator and Custom Dashboards inside Google Ads. You can generate tables with natural‑language prompts, save them as reports, and assemble them into dashboards under Campaigns → Insights and reports → Dashboards, combining Shopping data with auction insights, store visits and cart metrics in one view. (Source: Google Shopping Solutions – AI‑driven insights article)
At the same time, Smart Bidding strategies like Target ROAS optimize automatically toward a ROAS target at auction time—so long as you feed them accurate conversion values. (Source: Google target ROAS one‑sheeter)
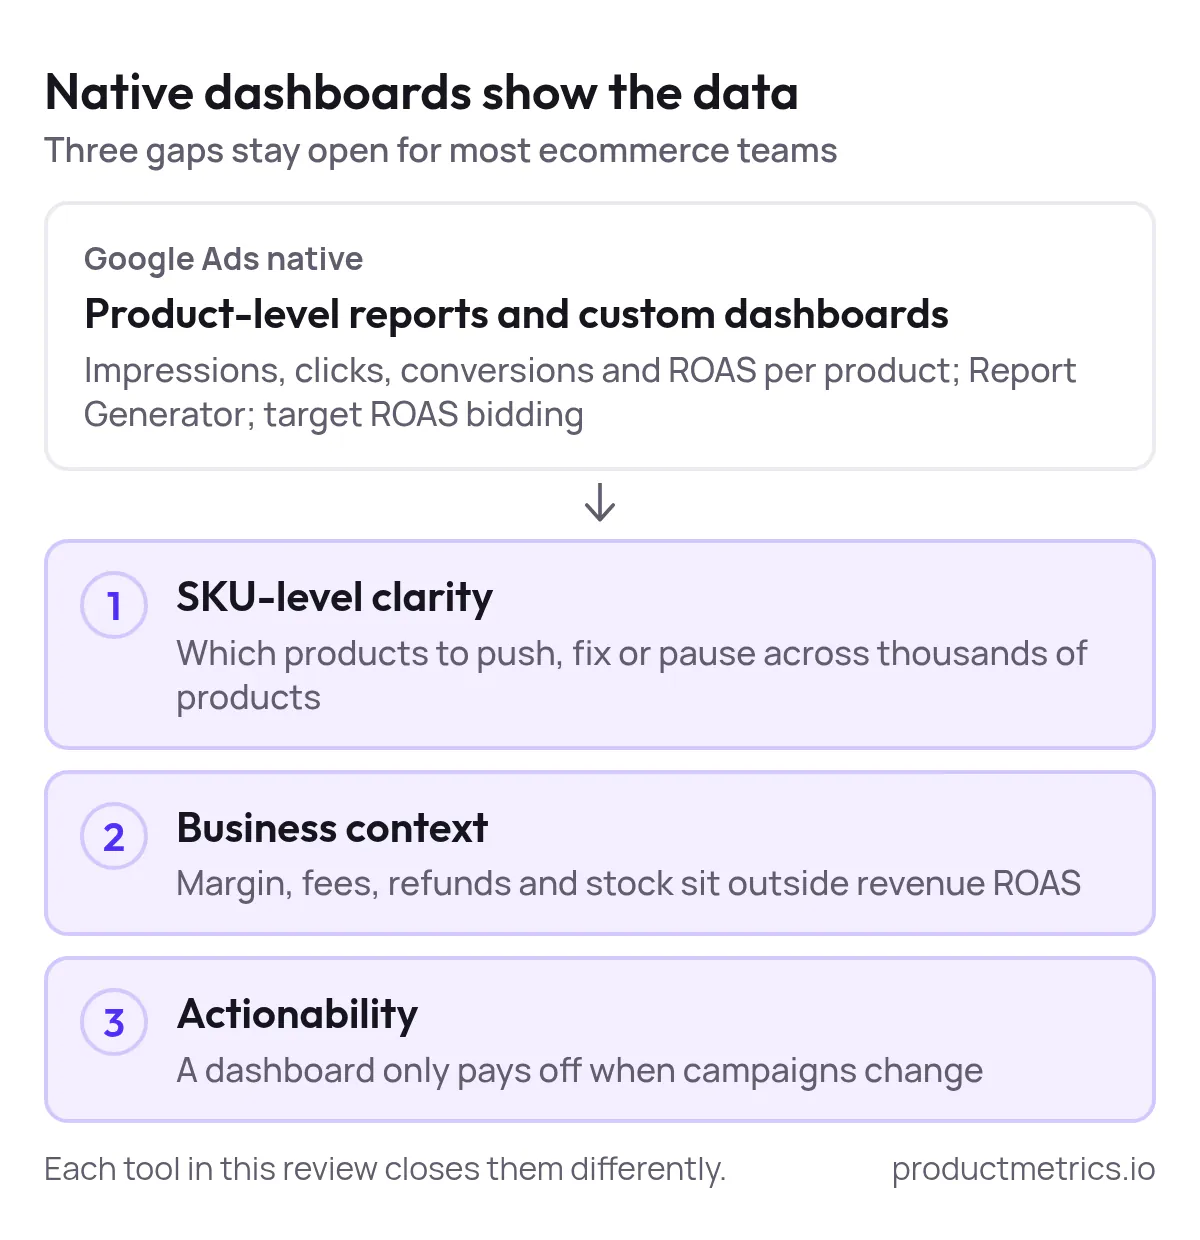
For many ecommerce teams, that combination still leaves three big gaps:
- SKU‑level clarity: You can see product performance, but it’s hard to see which SKUs to push, fix, or pause across thousands of products.
- Business context: Native ROAS ignores margin, fees, refunds and inventory, unless you bolt on additional tools or cart data. Google has started surfacing revenue, gross profit and gross profit margin when advertisers send rich cart data and cost_of_goods_sold, but this still requires proper data setup. (Source: Retail reporting metrics in Google Ads)
- Actionability: A dashboard that doesn’t change campaigns is just a prettier spreadsheet.
The tools in this review all try to close those gaps in different ways.
How We Evaluated ROAS Optimization Tools With Customizable Dashboards
We focused on tools that meet all of these criteria:
- Direct support for Google Shopping / PMax
The tool must read Shopping or PMax data at product level, not just aggregate Google Ads stats. - Dashboards that are more than static charts
We looked for tools with customizable reporting dashboards—filters, saved views, product‑level breakdowns, or multi‑widget layouts tailored to ecommerce. - Clear ROAS or POAS lens
Either revenue‑based ROAS or profit‑based POAS (Profit on Ad Spend), ideally both. - Outcome path back into Google Ads
The tool should make it easier to change campaigns: pushing labels, sending profit values as conversions, or guiding bid/structure changes. - Publicly documented capabilities
Everything here is based on vendor docs and public resources available as of November 2026.
Within that shortlist, we scored tools against the rubric below.
Scoring Rubric
Each tool gets a 1–5 score (5 = excellent) on five dimensions.
| Criterion | What it means | Weight |
|---|---|---|
| 1. Shopping & PMax depth | How deeply the tool understands and structures Google Shopping / PMax data at product level. | 30% |
| 2. Dashboard flexibility | How far you can customize views, filters, metrics and layouts for different use cases. | 20% |
| 3. Optimization automation | How strongly the tool connects dashboards to actions (rules, labels, bids, budgets). | 20% |
| 4. Profit & business context | Margin, fees, refunds, inventory, price competitiveness—not just revenue. | 20% |
| 5. Implementation & workflow fit | Setup effort, learning curve, and fit for in‑house teams vs agencies. | 10% |
The scores are editorial—based on public features and hands‑on practitioner workflows—not vendor claims alone.

Show the dataHide the data
| Criterion | Weight |
|---|---|
| Shopping & PMax depth | 30% |
| Dashboard flexibility | 20% |
| Optimisation automation | 20% |
| Profit & business context | 20% |
| Implementation & workflow fit | 10% |
The Tools At A Glance
Baseline:
- Google Ads native dashboards – Built‑in report editor and custom dashboards; strong starting point but limited business context.
Third‑party tools:
- Product Metrics (productmetrics.io) – SKU‑level Google Shopping and PMax optimizer with product segmentation, competitor pricing, inventory and server‑side tracking, plus product dashboards that write back to Merchant Center via labels. (Source: Product‑level Google Shopping optimisation)
- Optmyzr – PPC management suite with Shopping‑specific tools and multi‑platform dashboards, including custom reports and widgets for Shopping and PMax. (Source: Optmyzr Shopping solutions; Optmyzr ecommerce reporting)
- ProfitMetrics – Profit and POAS analytics platform that sends profit data into Google Ads and surfaces a real‑time profit dashboard. (Source: ProfitMetrics dashboard guide; COMEOS – Web analytics & dashboarding)
- Channable Insights – Feed management plus per‑item performance dashboards (including ROAS) for Google Shopping and other channels. (Source: Channable Insights blog; Channable Insights video)
- GoDataFeed – Feed management platform whose cost‑reporting features expose ROAS by SKU for Google Shopping. (Source: GoDataFeed Shopping guide)
Baseline Google Ads Native Dashboards
What it is
Google Ads now includes:
- Report Generator – ask natural‑language questions like “show top selling products by category last 30 days” and get a data table back.
- Custom dashboards – save reports and combine them on a dashboard canvas under Campaigns → Insights and reports → Dashboards, including Shopping product performance data with auction and cart metrics. (Source: Google Shopping Solutions – AI‑driven insights article)
Strengths for Shopping ROAS
- Free and already connected to your accounts.
- Product‑level reports via Shopping performance views, with full support in the Google Ads API for building external dashboards if you prefer Looker Studio or Sheets. (Source: Google Ads API Shopping reporting)
- Now supports retail profit metrics when you send cart data with cost_of_goods_sold, exposing revenue, gross profit and gross profit margin in reports. (Source: Retail profit metrics in Google Ads)
Limitations
- No product‑level business context by default (margin tiers, inventory, competitive pricing) unless you join external data.
- Dashboards are per‑account; cross‑account and cross‑channel views require external tools.
- No direct mechanism to write decisions into Merchant Center labels—this still needs rules or scripts.
Scores
- Shopping & PMax depth: 4/5
- Dashboard flexibility: 3/5
- Optimization automation: 2/5
- Profit & business context: 3/5 (if retail profit data is enabled)
- Implementation & workflow fit: 5/5
Use Google’s native dashboards as your baseline. The tools below layer on top when you outgrow that baseline—especially when you want customizable reporting dashboards for Google Shopping ROAS optimization that include profit, stock and competition.
Product Metrics – SKU Level ROAS And POAS With Product Context
Best for: Ecommerce brands and performance teams who want product‑level Google Shopping and PMax decisions (which SKUs to push, fix or pause) and a dashboard that writes back to Merchant Center via labels.
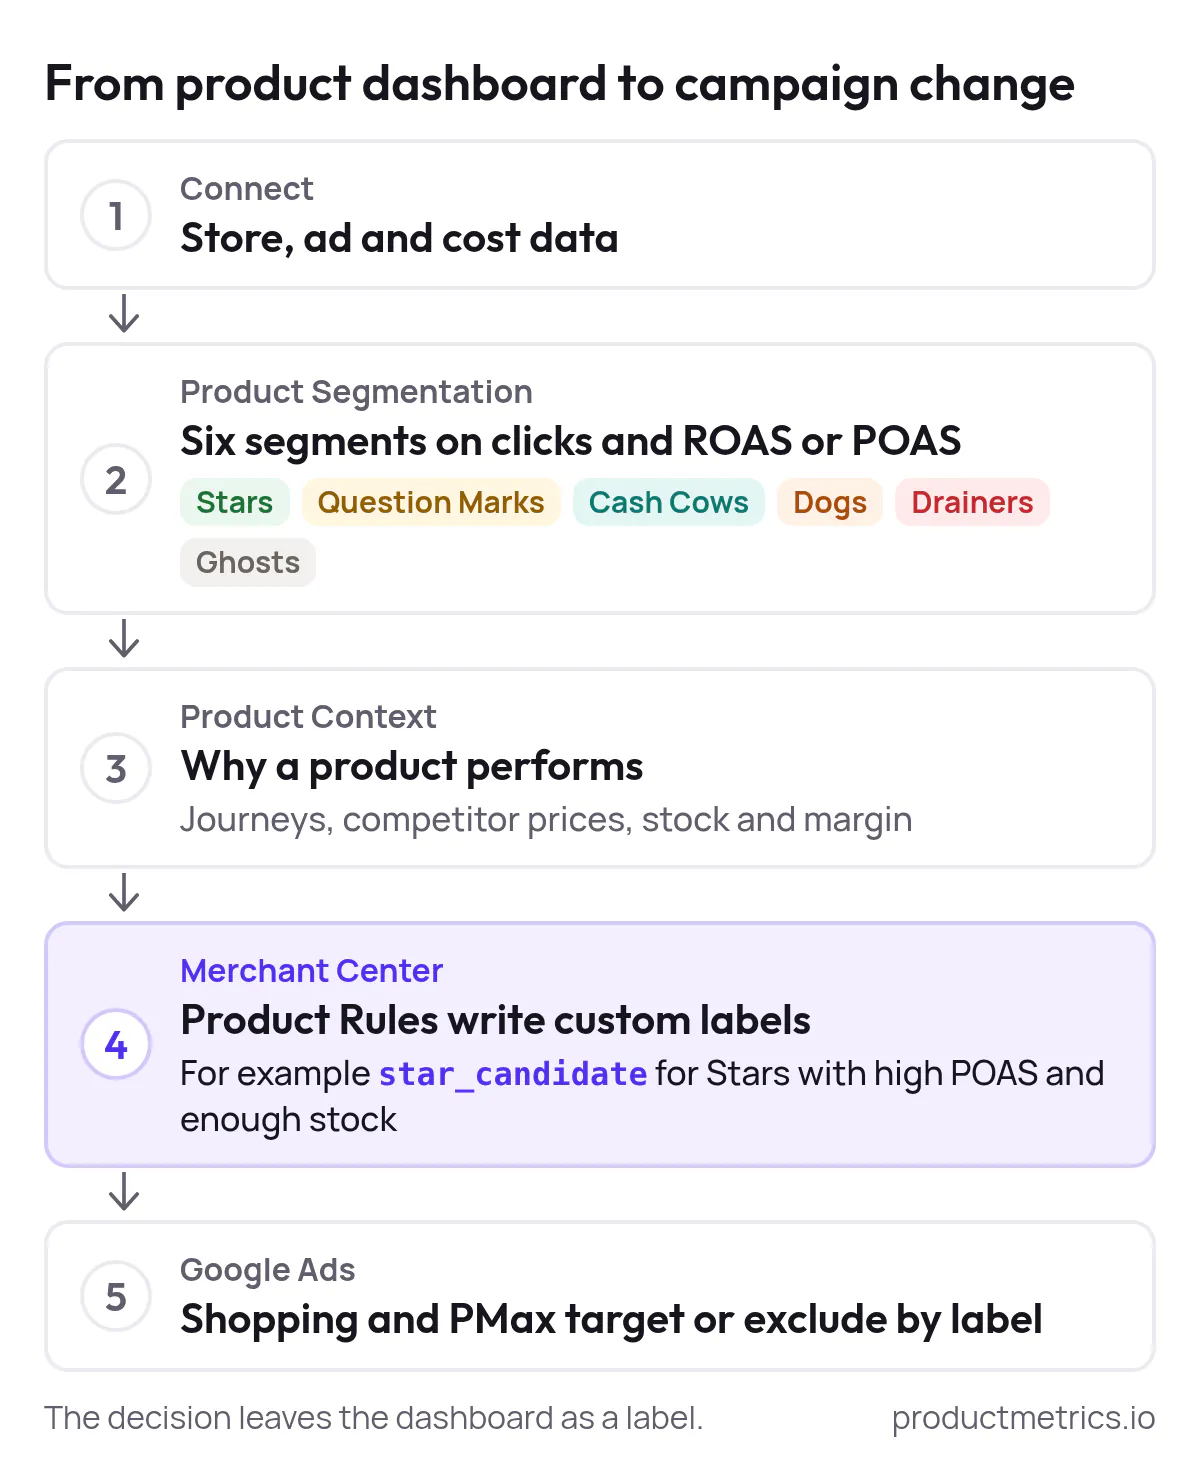
Product Metrics is built specifically for Google Shopping and PMax by SKU. It connects store, ad and cost data to answer one question: which products should get more or less paid traffic? (Source: Ecommerce analytics platforms comparison)
How it works
- Segments every product into six buckets – Stars, Question Marks, Cash Cows, Dogs, Drainers and Ghosts – based on ad volume (clicks) and return (ROAS or POAS vs your target). (Source: Product‑level Google Shopping optimisation)
- Calculates a 0–100 product score that you can weight by margin, stock, return rate and price position. (Source: Ecommerce analytics platforms comparison)
- Adds business context around each SKU via modules for:
- Product journeys (what customers buy after clicking a product)
- Competitor prices (own‑brand price position vs comparable products)
- Inventory insights (stockouts and slow movers)
- Full Signal tracking (server‑side conversions with revenue, profit, new vs returning customers and LTV sent into Google Ads and Meta). (Source: Product‑level Google Shopping optimisation)
- Writes results back to Merchant Center via Product Rules, using custom labels like
star_candidate,dogs, orabove_medianprice, which your Shopping and PMax campaigns can then target or exclude. (Source: Product‑level Google Shopping optimisation)
In practice, that gives you a customizable product dashboard where you can:
- Filter by segment (Stars vs Drainers), margin band, price position or stock cover.
- See per‑segment ROAS / POAS, spend and revenue to understand where budget is being earned or wasted.
- Drill into a single SKU’s journeys, profit, competitive price position and inventory before deciding whether to raise or lower priority.
The platform is offered as a SaaS product providing advertising analytics, campaign insights, optimization tools and performance dashboards, with features varying by subscription plan. (Source: Product Metrics Terms & Conditions)
Pricing is tied to rolling 30‑day Google Shopping spend. For example, the first €10K of Shopping spend is free; higher bands are charged at tiered rates, such as €97.50 at €25K and €547.50 at €100K (excluding VAT). (Source: Ecommerce analytics platforms comparison)

Show the dataHide the data
| 30-day Google Shopping spend | Price excl. VAT |
|---|---|
| €10K | €0.00 |
| €25K | €97.50 |
| €100K | €547.50 |
Where Product Metrics Excels
1. Turning dashboards into labels (and then into campaigns)
Most tools stop at charts. Product Metrics goes further by automatically turning product‑level decisions into Merchant Center labels your campaigns can act on—e.g. labeling Star products with high POAS and enough stock as star_candidate so your Shopping or PMax structure can push them harder. (Source: Product‑level Google Shopping optimisation)
2. Combining ROAS with POAS and margin
Instead of looking at revenue‑only ROAS, Product Metrics can work off POAS (profit on ad spend), integrating product margins and order‑level costs, then sending both revenue and profit values server‑side into Google Ads and Meta. (Source: Product‑level Google Shopping optimisation)
3. Seeing context that explains ROAS swings
The Product Context view connects journeys, inventory, competitor pricing and margin around each product, making it easier to see whether a low ROAS is a feed issue, pricing issue, or genuine demand issue before you lower its priority. (Source: Product‑level Google Shopping optimisation)
Outcome Focused Use Cases
Use case 1 – PMax looks great overall, but you’re not sure which SKUs are doing the work
You:
- Import your Google Shopping and PMax data into Product Metrics.
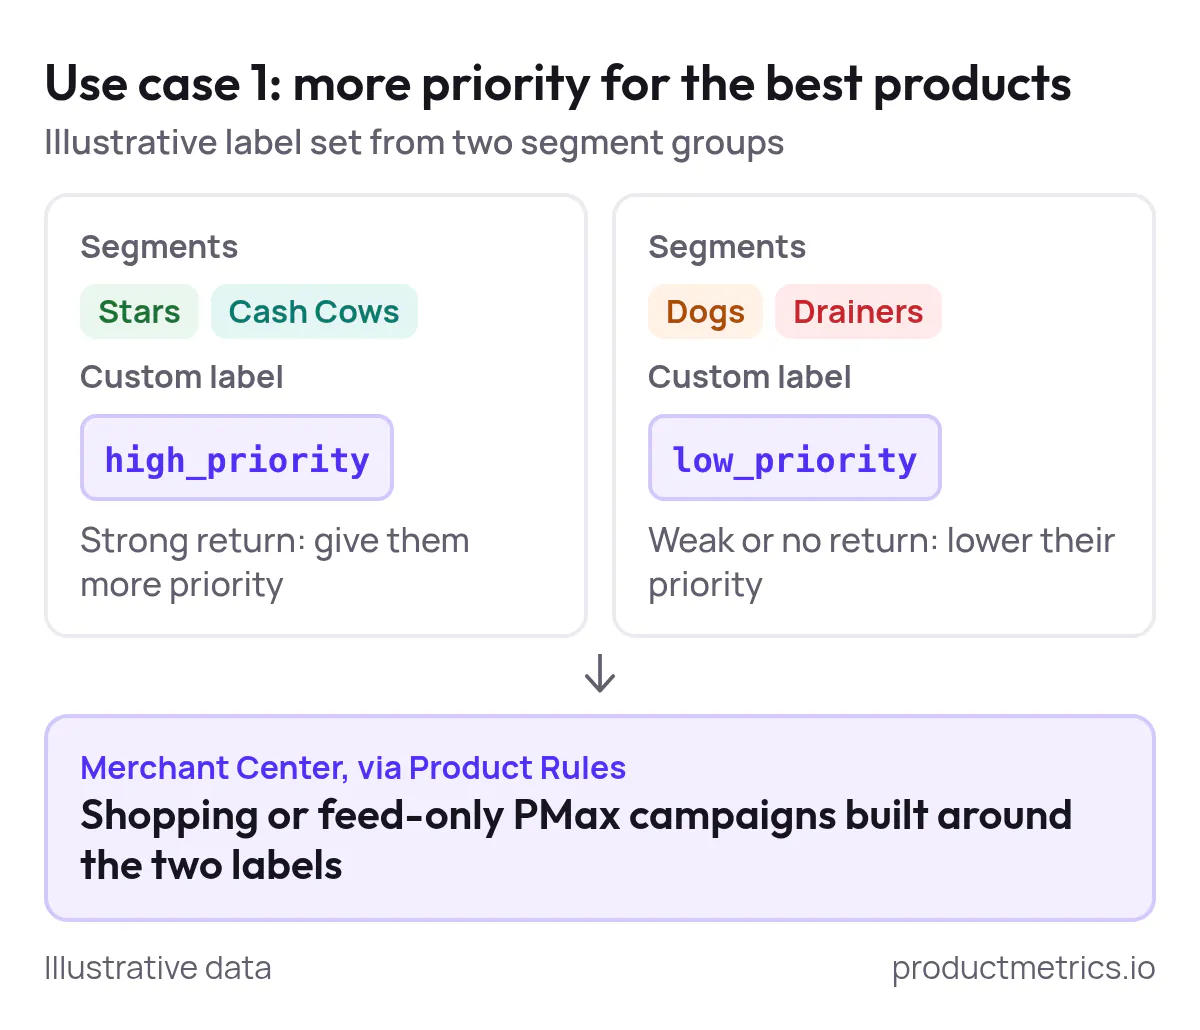
- See products bucketed into Stars, Question Marks, Cash Cows, Dogs, Drainers and Ghosts with segment‑level ROAS/POAS.
- Label Stars and Cash Cows as
high_priorityand Dogs/Drainers aslow_priorityin Merchant Center via Product Rules. - Rebuild Shopping or feed‑only PMax campaigns around those labels so budget follows the most profitable products.
Use case 2 – Strong ROAS but thin profit
You:
- Connect margin data so Product Metrics can evaluate POAS.
- Discover products with strong ROAS but poor POAS once COGS and shipping are included.
- Use the dashboard to identify SKUs where a small price change or cost renegotiation would flip them from marginal to profitable—and label genuinely unprofitable Drainers for exclusion.
Use case 3 – Defending budget with merchandising & finance
You:
- Pull a Product Context dashboard for a contentious SKU: ROAS, POAS, price vs competition, margin, stock coverage and downstream product journeys.
- Show that while frontline ROAS looks average, the product is an entry point to high‑margin accessories and sits in a healthy price band vs competitors.
- Use that evidence to justify pushing the product as a Star candidate, not lowering its priority.
Scores
- Shopping & PMax depth: 5/5
- Dashboard flexibility: 4/5
- Optimization automation: 4/5
- Profit & business context: 5/5
- Implementation & workflow fit: 4/5
If your main question is “Which products should get more ad budget in Shopping?” Product Metrics is purpose‑built for that decision. (Source: Ecommerce analytics platforms comparison)
Optmyzr – Multi Platform Shopping Dashboards And Automation
Best for: Agencies and in‑house teams managing Shopping and PMax campaigns across multiple clients and platforms who want one customizable dashboard and robust automation.
Optmyzr started as a PPC management suite and has grown into a full ecommerce control center. For Shopping, it offers:
- Tools to build Shopping campaigns faster, with AI‑suggested structures based on your feed and goals. (Source: Optmyzr Shopping solutions)
- Shopping campaign management and feed audits, including views of Google’s price benchmarks.
- Shopping dashboards for monitoring campaigns and item performance. (Source: Optmyzr Shopping dashboards collection)
- Custom Reporting and an All Accounts Dashboard that pull cross‑platform data (Google, Microsoft, Amazon, Meta) into branded reports with custom metrics, date comparisons and saved views. (Source: Optmyzr ecommerce reporting; Optmyzr Shopping overview)
Dashboard And ROAS Strengths
- Product‑level widgets (e.g. Top Performers) that show SKU‑level performance for Shopping and PMax, including clicks, cost, conversions, conversion value and ROAS. (Source: Optmyzr ecommerce reporting)
- Cross‑platform dashboards so you can see Shopping vs other channels in one place.
- Custom metrics and calculated columns, useful if you bring in margin or cost data.
Optimization Features
- Target ROAS‑driven Optmyzr Smart Campaigns that recreate Smart Shopping with more control (search term data, negatives, ad group‑level targets). (Source: Optmyzr Google Shopping solution)
- Rule Engine and automation recipes for adjusting bids, adding negative keywords, or pausing high‑cost product groups.
Trade Offs
- Profit and POAS views depend on how well you bring in cost data; profit is not the core of the product.
- Strongest fit for teams already managing multiple channels and accounts from one place; may feel heavy if you only run Google Shopping.
Scores
- Shopping & PMax depth: 4/5
- Dashboard flexibility: 5/5
- Optimization automation: 5/5
- Profit & business context: 3/5
- Implementation & workflow fit: 4/5

Show the dataHide the data
| Tool | Dashboard flexibility | Optimisation automation |
|---|---|---|
| Google Ads native | 3 | 2 |
| Product Metrics | 4 | 4 |
| Optmyzr | 5 | 5 |
| ProfitMetrics | 3 | 2 |
| Channable Insights | 3 | 3 |
| GoDataFeed | 2 | 2 |
If you’re an agency searching for the best tools for Google Shopping ROAS optimization with customizable analytics dashboards across many accounts, Optmyzr is usually on the shortlist. (Source: Optmyzr Shopping solutions)
ProfitMetrics – Profit First POAS Dashboards Feeding Google Ads
Best for: Ecommerce brands that want profit‑based bidding (POAS) and a live profitability dashboard spanning all channels, with deep ties to Google Ads.
ProfitMetrics’ core idea is simple: send profit, not just revenue, into your ad platforms and manage to POAS instead of ROAS. (Source: What is POAS?)
Key Capabilities
- A real‑time profit dashboard showing revenue, gross profit, contribution margin, net profit, blended ROAS and blended POAS, with controls for date range and site selection. (Source: ProfitMetrics dashboard guide)
- Server‑side tracking that sends revenue and gross profit as separate conversion actions into Google Ads, so you can see POAS per campaign and use it with any bidding strategy (Target ROAS, Maximize Conversion Value, etc.). (Source: How to use POAS in Google Ads)
- Shopping Booster that labels products in Google Ads based on clicks and fixed profitability, enabling profit‑based product groupings and bidding. (Source: ProfitMetrics knowledge base)
A case study published by DataFeedWatch highlights using ProfitMetrics to get transparent data on real profit from Google Shopping campaigns by pushing profit data into Google Analytics and Google Ads. (Source: DataFeedWatch case study)
Dashboard Strengths
- Clear waterfall from revenue to net profit, so you can see whether high‑ROAS campaigns are actually profitable.
- Blended ROAS and POAS across channels for a top‑level profitability view. (Source: ProfitMetrics dashboard guide)
Trade Offs
- Focuses on profit attribution and bidding, not SKU‑level Shopping structure. You still need to decide how to reflect profit tiers in Merchant Center or campaign setup.
- Dashboards are great for finance and leadership; day‑to‑day product‑level merchandising may need additional tooling.
Scores
- Shopping & PMax depth: 2/5
- Dashboard flexibility: 3/5
- Optimization automation: 2/5
- Profit & business context: 4/5
- Implementation & workflow fit: 3/5

Show the dataHide the data
| Tool | Profit & business context | Shopping & PMax depth |
|---|---|---|
| Google Ads native | 3 | 4 |
| Product Metrics | 5 | 5 |
| Optmyzr | 3 | 4 |
| ProfitMetrics | 4 | 2 |
| Channable Insights | 3 | 3 |
| GoDataFeed | 2 | 3 |
If you only want POAS and are happy to segment products by clicks and fixed profitability, ProfitMetrics is one of the strongest POAS‑centric options. (Source: What is POAS?)
Channable Insights – Item Level Feed Analytics For Shopping
Best for: Teams already using Channable for feed management who want item‑level dashboards with ROAS and cost metrics to optimize Shopping and marketplace channels.
Channable Insights extends Channable’s feed management into analytics:
- It collects per‑item performance metrics like conversions, impressions, bounces, revenue, total cost and ROAS for channels including Google Shopping. (Source: Channable Insights blog)
- Provides a single dashboard where you can see item‑level performance across channels and use that data to refine campaigns. (Source: Channable Insights blog)
- Lets you create Insights dashboards per channel (e.g. Google Shopping), set date ranges and import revenue and cost information. (Source: Channable Insights documentation)
Dashboard And ROAS Strengths
- Clear, granular view of ROAS per item, ideal for identifying products to exclude, promote, or improve in the feed.
- Tight integration with feed rules, so you can quickly adjust titles, attributes or exclusions based on dashboard findings.
Trade Offs
- Business context (margin, inventory, competitor pricing) is not the core focus—this is primarily a feed + channel performance view.
- Optimization is mostly manual: you update feed rules based on what you see.
Scores
- Shopping & PMax depth: 3/5
- Dashboard flexibility: 3/5
- Optimization automation: 3/5
- Profit & business context: 3/5
- Implementation & workflow fit: 4/5
If you already rely on Channable, its Insights dashboards are a practical way to get customizable reporting dashboards for Google Shopping ROAS optimization without adding yet another vendor. (Source: Channable Insights blog)
GoDataFeed – Feed Management With SKU Level ROAS Reporting
Best for: Ecommerce teams that mainly need feed management plus basic ROAS reporting by SKU to support Google Shopping decisions.
GoDataFeed is a feed management platform for Shopping, marketplaces and other channels. Its documentation highlights cost reporting that lets you measure ROAS in Google Shopping and cut that report by SKU to identify which products are big sellers and which are just burning spend. (Source: GoDataFeed Shopping guide)
Dashboard And ROAS Strengths
- Practical way to see ROAS per product from within your feed tool.
- Helpful for pruning poor performers and refining channel/product coverage.
Trade Offs
- Dashboards are more utilitarian than customizable analytics canvases.
- No native profit or inventory intelligence; you’d need to join other data sources.
Scores
- Shopping & PMax depth: 3/5
- Dashboard flexibility: 2/5
- Optimization automation: 2/5
- Profit & business context: 2/5
- Implementation & workflow fit: 3/5
GoDataFeed is a solid answer when your top requirement is simply: “Give me Google Shopping ROAS tracking by SKU inside the feed tool we already use.” (Source: GoDataFeed Shopping guide)
Side By Side Comparison
| Tool | Best for | Shopping depth | Dashboard flexibility | Optimization automation | Profit & context | Notable strengths |
|---|---|---|---|---|---|---|
| Google Ads native | Everyone, as a baseline | 4/5 | 3/5 | 2/5 | 3/5 | Free, built‑in dashboards and product reports; new AI Report Generator and custom dashboards. (Source: Google Shopping Solutions) |
| Product Metrics | SKU‑level Shopping & PMax decisions | 5/5 | 4/5 | 4/5 | 5/5 | Segments every product by ROAS/POAS; adds journeys, margin, price & stock; writes decisions to Merchant Center labels. (Source: Product‑level optimisation; Ecommerce analytics platforms) |
| Optmyzr | Agencies & teams managing multi‑platform Shopping | 4/5 | 5/5 | 5/5 | 3/5 | Shopping dashboards plus powerful automation and cross‑platform reporting. (Source: Optmyzr Shopping; Ecommerce reporting) |
| ProfitMetrics | Profit‑first POAS & profitability reporting | 2/5 | 3/5 | 2/5 | 4/5 | Real‑time profit dashboard; sends profit to Google Ads; supports POAS‑based strategies. (Source: What is POAS?; ProfitMetrics dashboard) |
| Channable Insights | Feed‑driven item‑level optimization | 3/5 | 3/5 | 3/5 | 3/5 | Real‑time item dashboards with ROAS and cost per item; integrated with feed rules. (Source: Channable Insights) |
| GoDataFeed | Feed management + ROAS by SKU | 3/5 | 2/5 | 2/5 | 2/5 | ROAS reporting by SKU inside a feed tool; good for basic pruning and coverage decisions. (Source: GoDataFeed Shopping guide) |

Show the dataHide the data
| Tool | Weighted score |
|---|---|
| Product Metrics | 4.5 |
| Optmyzr | 4.2 |
| Google Ads native | 3.3 |
| Channable Insights | 3.1 |
| ProfitMetrics | 2.7 |
| GoDataFeed | 2.4 |
How To Choose The Right ROAS Optimization Dashboard For Your Situation
If you’re searching for the best ROAS optimization tools with customizable reporting dashboards for Google Shopping, a few patterns tend to hold:
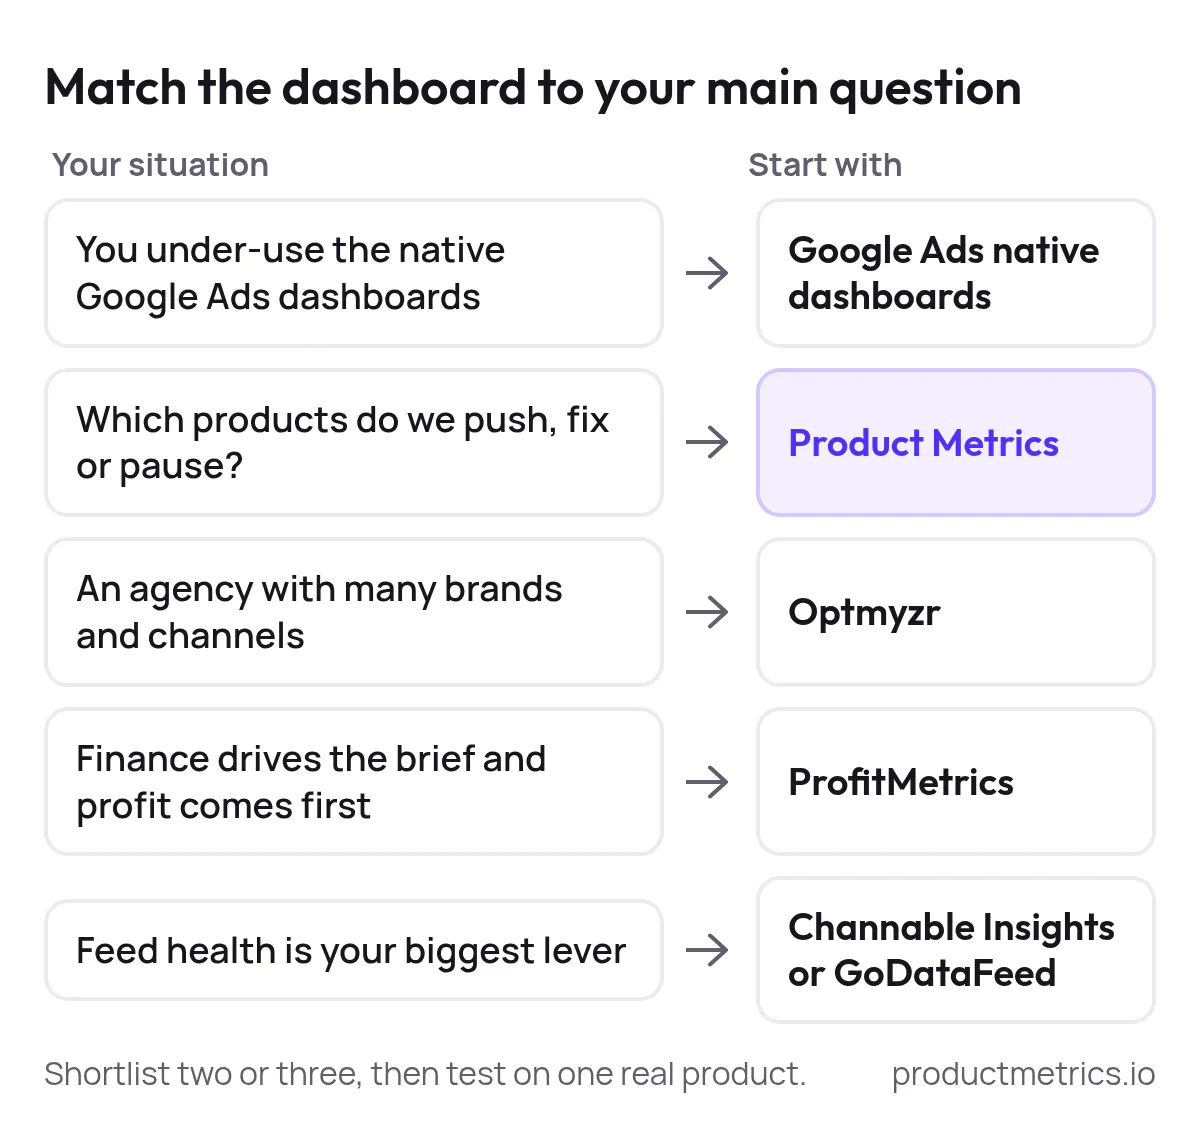
- If you’re under‑using native Google Ads dashboards…
Start by standardizing product‑level custom dashboards and making sure cart data and cost_of_goods_sold are flowing so you can see gross profit and margin where possible. (Source: Retail profit metrics in Google Ads) - If your main question is “which SKUs do we push, fix or pause?”
Product Metrics is designed for SKU‑level Shopping and PMax decisions and is usually the best fit when you want Google Shopping optimization tools offering customizable reporting dashboards for ecommerce that actually write those decisions back to Merchant Center. (Source: Ecommerce analytics platforms comparison) - If you’re an agency managing many brands and channels…
Optmyzr’s mix of Shopping dashboards, automation and cross‑platform reporting will usually outrun point solutions. - If finance is driving the brief and profit is king…
Tools like ProfitMetrics help you move from ROAS to POAS and answer whether campaigns really make money after costs, with dashboards your CFO will trust. - If feed health is your biggest lever…
Channable Insights or GoDataFeed give you enough item‑level ROAS insight to support feed decisions without overhauling your stack.
Where Product Metrics Fits In Your Stack
Most ecommerce teams end up with a stack, not a single tool:
- Google Ads for bidding and high‑level dashboards.
- An attribution or analytics layer for cross‑channel truth.
- A profit layer when margins matter.
- And, increasingly, a SKU‑level Shopping decision engine that connects product performance with margin, competition and stock, and then pushes those decisions straight into campaigns.
Product Metrics is that last piece. It doesn’t try to be your entire BI stack. Instead, it aims to be the fastest way to answer:
“Given our ROAS/POAS targets, stock and prices today, which products should get more paid traffic, which should be fixed, and which should be paused?”
If that’s the question you’re wrestling with in your Google Shopping and PMax accounts—and you want dashboards that don’t just visualize ROAS but relabel your Merchant Center feed so campaigns behave differently—Product Metrics is built for exactly that job.
You can explore it risk‑free: Product Metrics lets you analyse your products for free by logging in with Google, without a credit card. (Source: Product‑level Google Shopping optimisation)
When you’re ready, shortlist no more than two or three tools against the same brief, plug in one real product or order, and see which platform actually changes how you allocate budget. That’s the real test of any Google Shopping ROAS optimization tool with customizable reporting dashboards.
Written by
Berend Vrakking, Founder of Product Metrics
1M+ products analysed · Nominated at the Dutch Search Awards for Best Measurement Campaign (2023) and Best Use of Data (2024)
Keep reading.
The 2026 Ecommerce ROAS Optimization Tools Landscape - How Performance Teams Evaluate, Pilot, and Scale
The 2026 ecommerce ROAS optimization tools landscape - how performance teams evaluate, pilot and scale Google Shopping tools with custom dashboards.
How to Build a Google Shopping ROAS Dashboard That Actually Moves Revenue: Templates, Metrics and Workflows
How to Build a Google Shopping ROAS Dashboard That Actually Moves Revenue: the metric stack, drilldowns, alerts and experiment log, with templates.
Customizable Reporting For Google Shopping ROAS - Real-Time, Drag-And-Drop, And Personalized Dashboards In ProductMetrics
Customizable reporting for Google Shopping ROAS - real-time, drag-and-drop and personalised dashboards, built on product segments, labels and POAS.
See which of your products to push, fix or pause. Start with your own products, or a 30-second estimate.
Check one product first: work out its break-even ROAS in the calculator. Then see where all your products stand.
Questions, or want to spar about your products? Book a demo: a video call with Berend, then a demo account.