
Tool-By-Use-Case: Best Software for Clear Reporting in Shopping/PMax (Small Catalogs, Large Feeds, and Multi-Brand)
Tool-by-use-case: the best software for clear reporting in Shopping and Performance Max, for small catalogs, large feeds and multi-brand retailers and agencies.
If you’ve ever asked yourself “Just recommend me the best tools for clear Google Shopping campaign segmentation”, the frustrating answer is: it depends on your catalog and setup.
The same platform that’s perfect for a 300‑SKU Shopify store will be the wrong move for a 150,000‑SKU marketplace, and vice versa.
This guide breaks the landscape into three concrete scenarios:
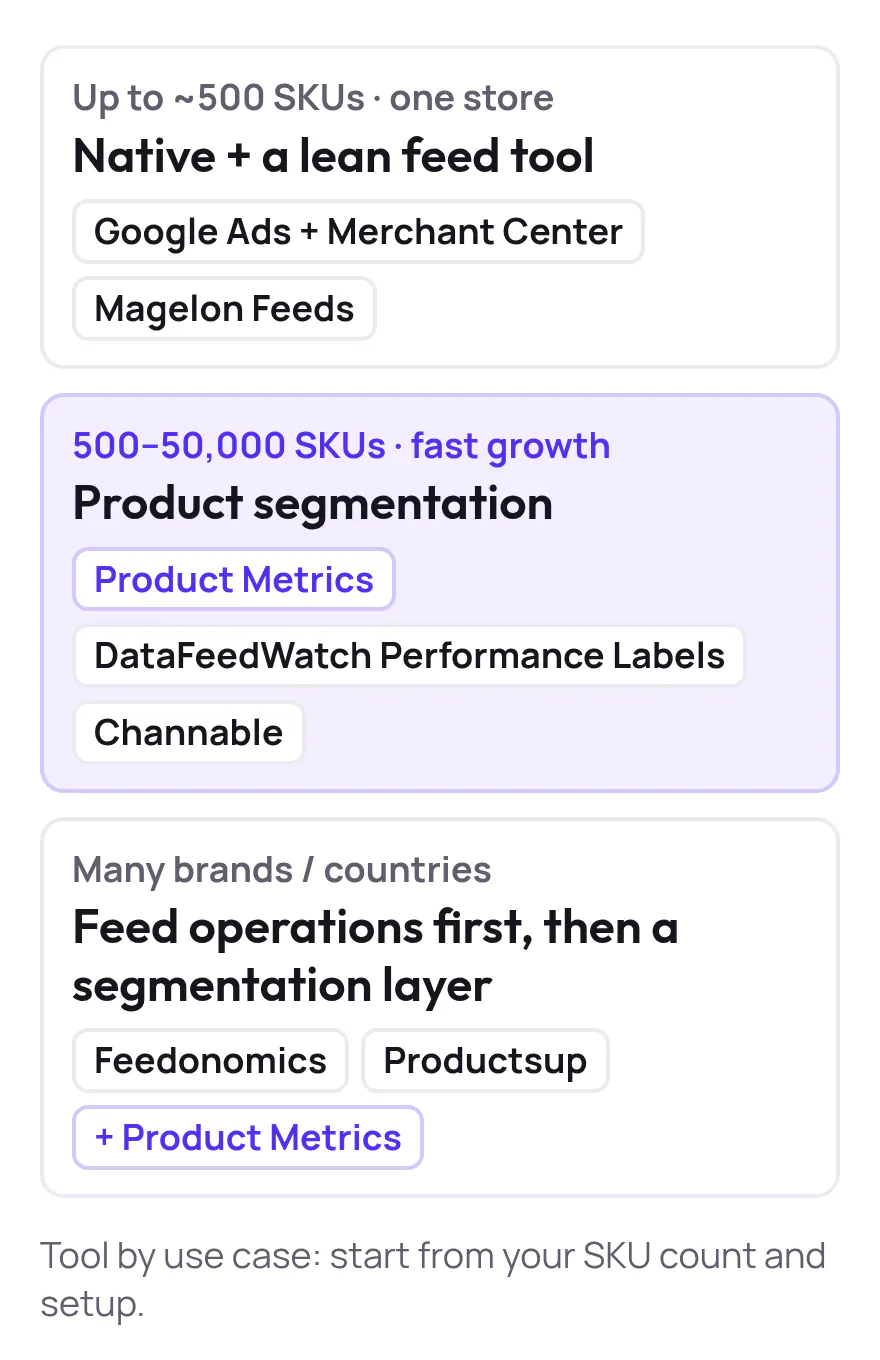
- Small catalogs – up to ~500 SKUs on a single brand
- Mid-market & large feeds – roughly 500–50,000 SKUs
- Multi-brand / multi-country retailers and agencies
For each, you’ll get a short list of tools and how they help you get clear campaign structure and reporting in Shopping and Performance Max.
What “Clear Reporting” Means in Shopping & Performance Max
Google has improved product-level and channel-level reporting. The Products tab in Google Ads now brings together performance for all campaigns linked to Merchant Center (Performance Max, Standard Shopping, Video, App, and Demand Gen) in one place, with cost and conversion metrics per item. (Source: Google Ads Help)
That’s necessary, but not sufficient.
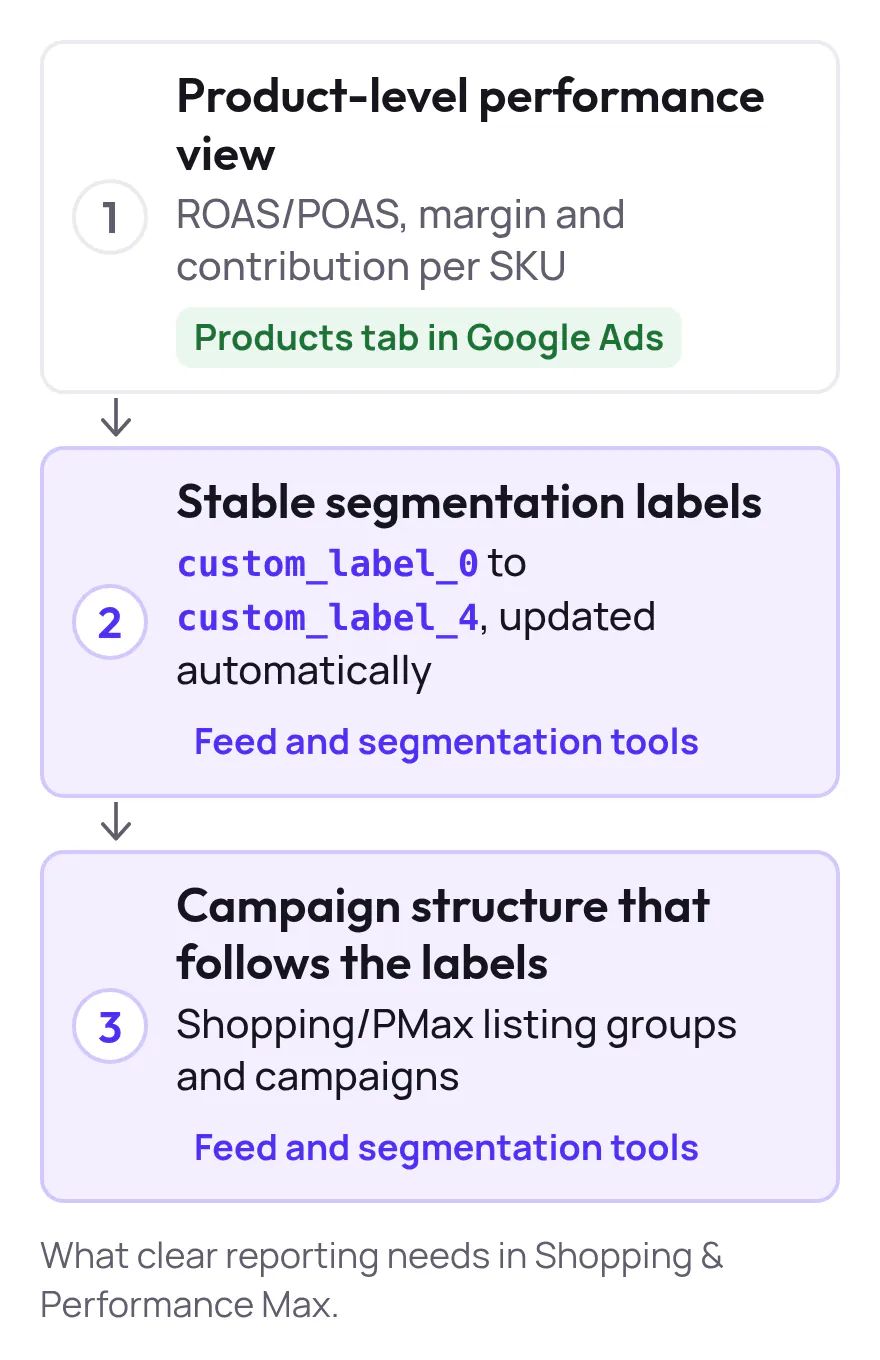
For campaign structure clarity, PPC teams typically need three things:
- Product-level performance view
- Can you see ROAS/POAS, margin, and contribution per SKU, not just per campaign or asset group?
- Stable segmentation labels
- Do you have a custom label system (margin tiers, performance groups, stock status, seasonality) that’s updated automatically as performance changes? Google Merchant Center supports five custom label fields (
custom_label_0tocustom_label_4) specifically for this kind of grouping. (Source: Google Merchant Center Help)
- Do you have a custom label system (margin tiers, performance groups, stock status, seasonality) that’s updated automatically as performance changes? Google Merchant Center supports five custom label fields (
- Campaign structure that follows the labels
- Can you map those labels into Shopping/PMax listing groups and campaigns, so “Stars” get one strategy, “Drainers” another, and out‑of‑stock or unprofitable products are deprioritized?
Feed and segmentation tools exist to close the gaps in #2 and #3—and to make #1 usable without spreadsheets.
Snapshot: Which Stack Fits Which Scenario
Use this table as a quick shortlist before we go into the details.
| Scenario | Catalog & team profile | Primary goal | Tools to shortlist first |
|---|---|---|---|
| Small catalog (up to ~500 SKUs) | Single brand, 1–2 countries, light internal data team | Keep setup lean; get enough clarity to make solid bid and budget calls | Native Google Ads + Merchant Center product reporting; Magelon Feeds if you want feed + basic segmentation in one UI |
| Mid-market & large feeds (≈500–50,000 SKUs) | DTC or retail brand with real SKU spread, multiple categories | Product-level ROAS/POAS clarity; smart segmentation into performance groups | Product Metrics for ML product segmentation and labels; DataFeedWatch Performance Labels; Channable Labelizer if you already use Channable |
| Multi-brand / multi-country | Retailer or agency managing many stores and channels | Centralize feeds, normalize data, then layer decision-ready segmentation | Feedonomics or Productsup for feed ops; Product Metrics on top for SKU‑level decisions in Shopping/PMax |
If you’re looking to buy Google Shopping campaign segmentation software for clear reporting, the rest of this guide helps you pick the right column—not just the loudest vendor.
Scenario 1 – Small Catalogs (Up To ~500 SKUs)
When This Is You
- 1 brand, 1–2 markets
- A few hundred SKUs at most
- You care about structure, but can still review SKUs by hand when needed
In this range, the risk is over‑tooling: adding complexity that doesn’t change decisions.
Baseline: Native Google Ads + Merchant Center
For small catalogs, you can get a surprising amount of clarity from the native stack:
- Use the Products tab in Google Ads to see item-level performance across all Merchant Center campaigns. (Source: Google Ads Help)
- Build Shopping and PMax listing groups using attributes like brand, product type, and custom labels. (Source: Google Merchant Center Help)
You still need to design a simple label taxonomy:
custom_label_0: margin tier (high / medium / low)custom_label_1: performance band (hero / stable / test / drainers)custom_label_2: season (evergreen / summer / winter)
Those labels can live in your ecommerce platform or be pushed via a basic feed tool.
When a Lightweight Feed Tool Helps
If you want a bit more control without enterprise overhead, a lean feed management app is often enough.
Magelon Feeds
- Lets you filter products by price, discount, and performance metrics from Google Analytics, Merchant Center, and Google Ads, then save those filters as segments. (Source: Magelon)
- Turns segments into Google Shopping bidding groups by writing them into
custom_label_0–custom_label_4in priority order. (Source: Magelon) - Designed around a single catalog with multiple feeds (Google Shopping, Meta, marketplaces), which suits small stores that still care about cross‑channel structure. (Source: Magelon)
When to choose this stack
Stay in the “native + lightweight feed” world if:
- You can review key SKUs manually in a weekly or monthly routine
- You’re not yet struggling with hidden budget leaks at scale
- Your priority is simplifying feed management, not adding another analytics layer
Once you cross into hundreds or thousands of SKUs where manual checks fall apart, it’s time to look at dedicated segmentation.
Scenario 2 – Mid-Market & Large Feeds (≈500–50,000 SKUs)
This is where the black‑box feeling of PMax really starts to hurt. Threads like “Is Performance Max really a black hole?” are common in PPC communities for exactly this reason: once you have 150+ products and variants, campaign‑level averages stop telling you where the money goes. (Source: Reddit r/PPC)
You need tooling that:
- Reads every product’s economics (ROAS or POAS)
- Groups SKUs into meaningful segments automatically
- Writes those segments into Merchant Center labels
- Keeps structure and reporting in sync as performance changes
Product Metrics: ML Segmentation + Labels for Shopping & PMax
Best for: 500–50,000 products where you want product-level decisions, not spreadsheets.
What it does
- Connects to Google Ads, Merchant Center, and your shop backend (Shopify, WooCommerce, Magento, Lightspeed, Shopware 6) to pull product performance and business data. (Source: Product Metrics)
- Uses machine learning to assign each product to one of six segments—Stars, Question Marks, Cash Cows, Dogs, Drainers, and Ghosts—based on ad click volume and return, using either ROAS or POAS. (Source: Product Metrics)
- Writes the chosen segment into a custom label via a Merchant Center supplemental feed, refreshing daily, so campaigns can target by segment. (Source: Product Metrics)
- Lets you override ML decisions with Product Rules (e.g., “if stock is low, downgrade segment” or “if product score > 70, treat as Star”) before labels are written. (Source: Product Metrics)
- Is explicitly built for shops with 500–50,000 products and is free up to a certain level of Google Shopping spend each month. (Source: Product Metrics)
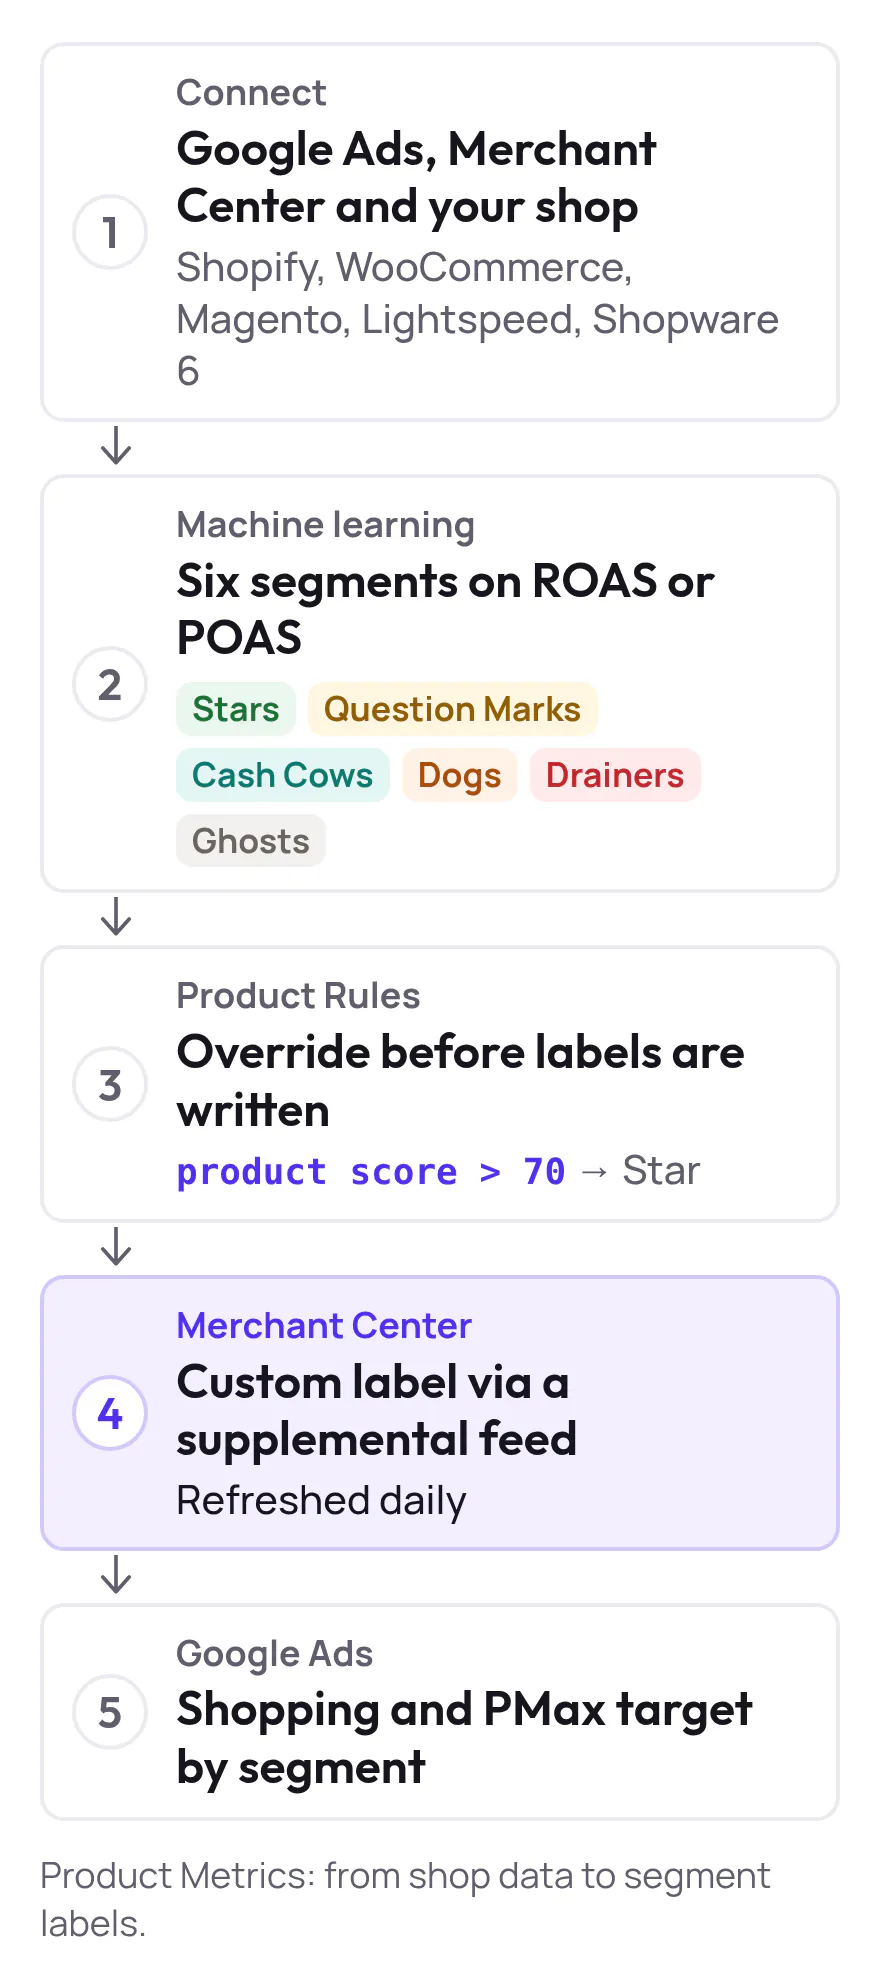
Because segments flow into labels, you can follow a structure like:
stars→ own PMax campaign with aggressive target ROAS or POAScash_cows→ Shopping or PMax with value-maximizing strategydrainers→ low‑priority Shopping, strict target, or excludedghosts→ paused until feed or stock issues are fixed
Product Metrics also exposes break-even ROAS calculations and profit-focused metrics so you can use POAS, not just revenue ROAS, in those decisions. (Source: AINave)
When to shortlist Product Metrics first
- You already have a feed tool or agency handling technical feeds
- You want a Shopping/PMax‑specific decision layer, not another generic BI dashboard
- You care about product economics (margin, returns, stock) as much as click metrics
DataFeedWatch Performance Labels: Segmentation Inside Your Feed Tool
Best for: Teams that already manage feeds in DataFeedWatch and want built‑in performance-based labeling.
DataFeedWatch’s Performance Labels feature:
- Uses Google Ads performance data (clicks, impressions, conversions, cost, ROAS, etc.) to group products by how they perform. (Source: DataFeedWatch)
- Lets you set thresholds and lookback windows (1 to 180 days) and automatically writes the results into custom labels in your feeds. (Source: DataFeedWatch)
- Updates performance‑based labels daily, so Shopping and PMax campaigns can stay aligned with current winners and underperformers. (Source: DataFeedWatch)
It’s a strong option if your main pain is keeping labels in sync with performance and you’re already all‑in on DataFeedWatch for multi‑channel feeds.
Channable Labelizer: Performance Segmentation for Channable Users
Best for: Brands and agencies on Channable that want automated performance labels for Shopping and PMax.
Channable offers two relevant capabilities:
- Channable Labelizer, a performance-based product segmentation tool specifically for Google Shopping and Performance Max campaigns. It groups products by performance and updates those groups as new clicks, costs, and revenue data come in. (Source: Channable)
- Integration that allows these segmentation labels to be written into
custom_label_0–custom_label_4and pushed to Merchant Center via your Shopping feed, or via a supplemental feed when another tool owns the main feed. (Source: Channable Help Center)
If you already rely on Channable for feed mapping and multi‑channel distribution, Labelizer keeps segmentation and feeds under one roof.
| Tool | Data used | Where labels go | Refresh |
|---|---|---|---|
| Product Metrics | Google Ads, Merchant Center, shop backend | Custom label via supplemental feed | Daily |
| DataFeedWatch Performance Labels | Google Ads performance data | Custom labels in your feeds | Daily |
| Channable Labelizer | Clicks, costs, revenue | custom_label_0–custom_label_4 via Shopping or supplemental feed |
As new data come in |
Scenario 3 – Multi-Brand / Multi-Country Retailers and Agencies
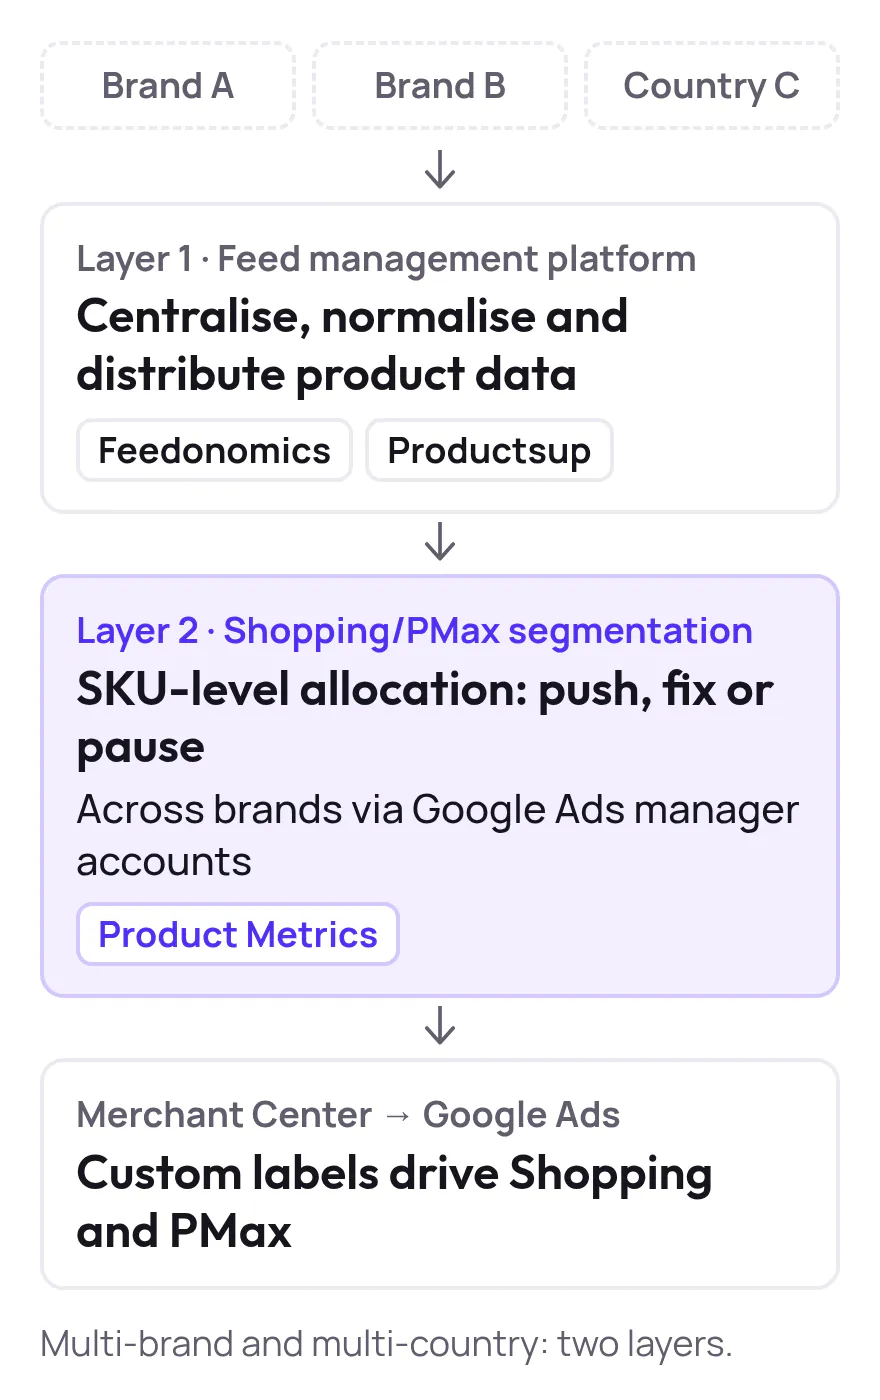
In this scenario, the core problem shifts from “How do I segment my own feed?” to “How do I keep 10–50 feeds consistent across brands and regions?”
You typically need two layers:
- A feed management platform to centralize, normalize, and distribute product data
- A Shopping/PMax segmentation and analytics layer for SKU‑level allocation
Feedonomics: Full-Service Feed Management With Custom-Label Workflows
Best for: Retailers or agencies with large, complex feeds and limited in‑house feed engineering.
Feedonomics focuses on full-service feed management for channels like Google Shopping. (Source: Feedonomics) Key strengths:
- Handles complicated and large feeds, including custom ecommerce platforms and site crawling when no clean export exists. (Source: Feedonomics FAQ)
- Provides a Custom Labels workspace to assign values to
custom_label_0–custom_label_4by SKU list or attribute filters (brand, category, price, product type, etc.), with rule management and previews before publishing. (Source: Feedonomics Docs) - Supports performance-driven labels (e.g., through transformers and analytics integrations) so you can segment bids by margin, price tier, or performance bands. (Source: Feedonomics Docs)
If your biggest constraint is feed operations across many stores, Feedonomics gives you the control plane you need, with space to layer in more specialized analytics on top.
Productsup: Multi-Channel Feed Management With Performance-Based Labels
Best for: Enterprise and multi-country retailers coordinating many channels from a central team.
Productsup is a feed management platform that helps brands collect, optimize, and distribute product data across Google Shopping, marketplaces, and social channels. (Source: Productsup) For segmentation:
- Its Google Shopping integration focuses on efficient feed optimization and segmentation for Google properties. (Source: Productsup)
- A native Google Analytics integration lets you categorize products based on performance data (e.g., high‑click, high‑purchase items) and assign custom labels so you can track and bid separately on top performers. (Source: Productsup)
If your team runs Google Shopping as one of many channels and needs consistent rules across everything, Productsup is a strong base layer.
Layering Product Metrics on Top of Feed Tools
Feed platforms excel at getting data to the right place in the right format. Where they’re thinner is SKU‑level economics and campaign actions for Shopping and PMax.
This is where Product Metrics is designed to sit on top:
- It connects directly to Google Ads, Merchant Center, and your shop, regardless of whether Feedonomics, Productsup, or another tool manages the feed. (Source: Product Metrics)
- Segments every product into six performance groups based on volume and ROAS/POAS, then writes those segments to a custom label via a supplemental feed you add once in Merchant Center. (Source: Product Metrics)
- Supports Google Ads manager accounts, so you can run segmentation across multiple brands from one place. (Source: Product Metrics)
For agencies and multi‑brand retailers, a common pattern is:
- Feedonomics / Productsup standardize and distribute feeds
- Product Metrics decides which SKUs each brand should push, fix, or pause in Shopping and PMax
How to Choose in Under an Hour
If you’re evaluating platforms for clear Google Shopping campaign structure and reporting, use this quick framework.
Step 1: Size and Complexity Check
- Under ~500 SKUs and one store: start with native + a lean feed tool like Magelon; don’t pay for complexity you won’t use yet.
- 500–50,000 SKUs or fast growth: put Product Metrics on your shortlist for product segmentation; compare against performance-label features in DataFeedWatch and Channable.
- Many brands/countries: anchor your choice on feed operations first (Feedonomics or Productsup), then layer a segmentation tool if you still lack SKU‑level clarity.
Step 2: Reporting Questions You Must Answer
Ask each vendor to show you, in their UI:
- “Which products are profitable after ads and which aren’t?”
- “Which segment would we move a product into if its margin drops 10 points?”
- “How do these segments map into concrete Shopping/PMax campaigns and listing groups?”
If you can’t see that end‑to‑end path—product → segment → label → campaign → outcome—the tool will not improve structure clarity.
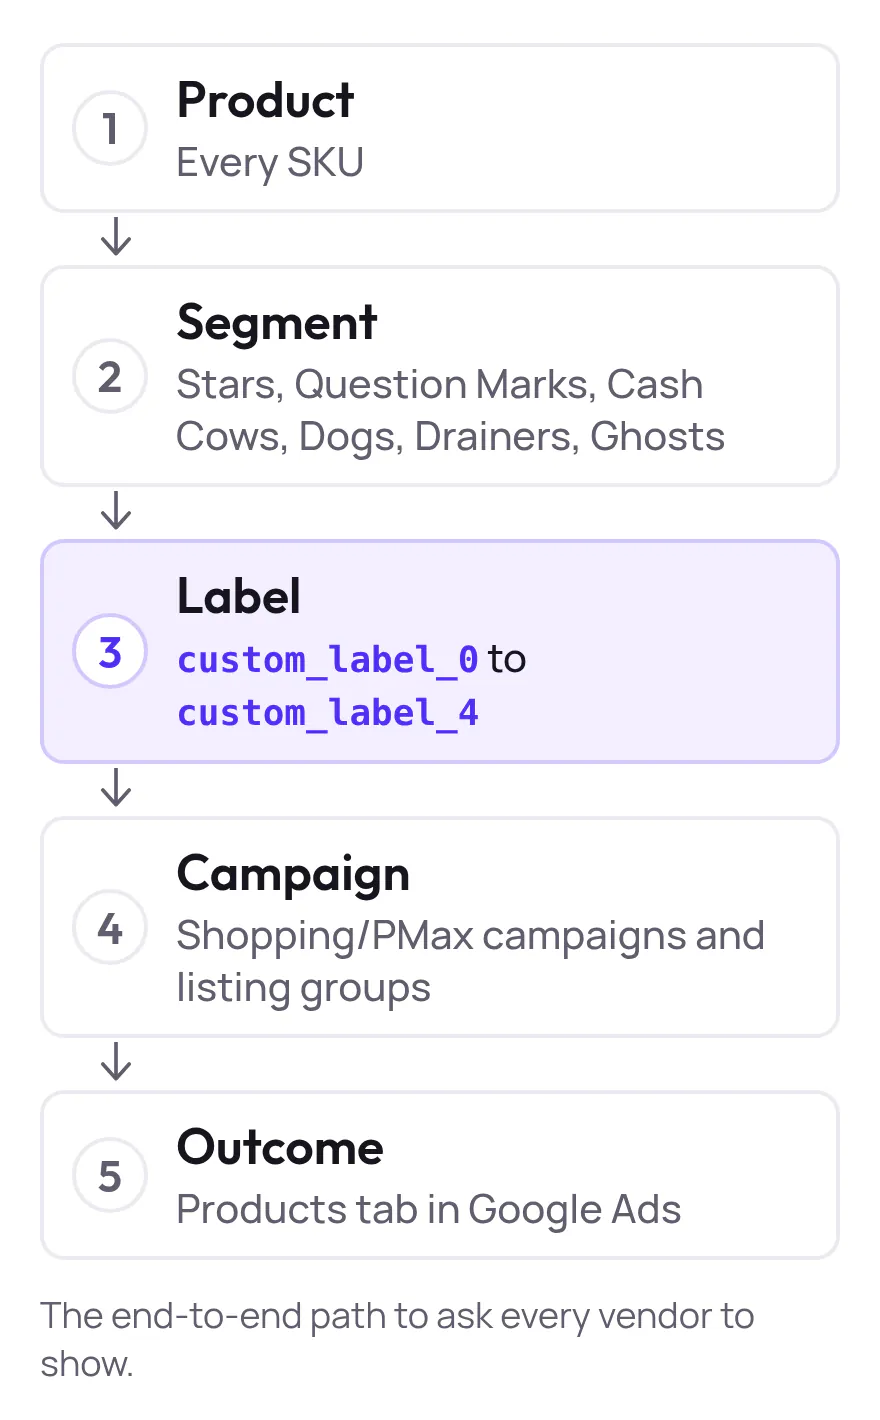
Step 3: Implementation Friction
Look for:
- How labels are written (main feed vs supplemental feed)
- Update cadence (daily is ideal for performance-based labels)
- Need for development work (Product Metrics and most modern feed tools are designed to avoid custom code for setup). (Source: Product Metrics)
The clearer this pipeline is, the less your future self will be stuck reconciling mismatched IDs and half‑updated labels.
Example Structure: From Segments to Shopping/PMax Campaigns
To make this concrete, here’s a structure pattern based on Product Metrics’ six segments and custom labels:
- Use ML segmentation to group products into Stars, Question Marks, Cash Cows, Dogs, Drainers, and Ghosts by ad click volume and ROAS/POAS. (Source: Product Metrics)
- Write the segment name into
custom_label_0via a supplemental feed from Product Metrics or a similar tool. (Source: Product Metrics) - In Google Ads, split your Shopping or PMax campaigns by
custom_label_0and assign strategies like:- Stars: dedicated PMax campaign, slightly looser target ROAS/POAS to gain volume
- Cash Cows: stable campaigns with more conservative targets
- Question Marks: testing campaigns; fix price or product page before scaling
- Dogs/Drainers: low-priority Shopping campaigns or excluded
- Ghosts: paused; check feed and stock diagnostics first
- Use Google’s product reporting and channel reports to verify that spend is predominantly flowing to Stars and Cash Cows. (Source: Google Ads Help)
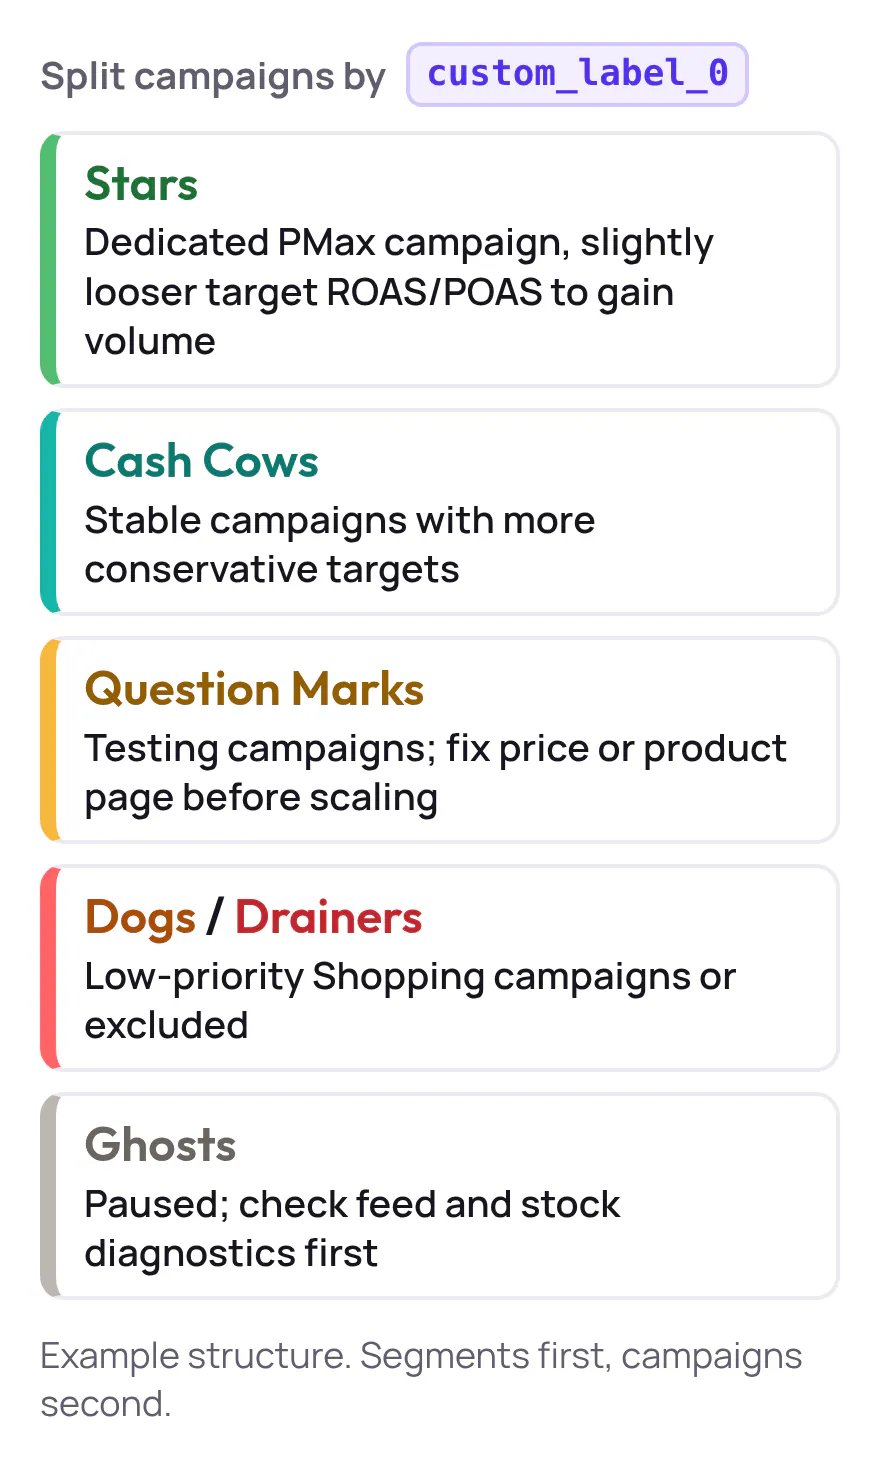
You can implement a similar structure using DataFeedWatch Performance Labels, Channable Labelizer, or Feedonomics custom labels—the principle is always the same: segments first, campaigns second.
Putting It Into Practice With Product Metrics
Product Metrics is built specifically to answer SKU-level Google Shopping and Performance Max questions:
- Which products actually earn their ad spend after margin and returns?
- Which SKUs should get more coverage, and which should be held back?
- How do we push those decisions into campaigns reliably via labels?
It:
- Provides a SaaS platform for advertising analytics, campaign insights, optimization tools, and performance dashboards. (Source: Product Metrics Terms)
- Segments products into six ML‑driven groups, writes those segments to Merchant Center as labels, and is designed for stores with 500–50,000 products. (Source: Product Metrics)
- Connects margin, stock, pricing, and product journeys so you can prioritize profit, not just revenue. (Source: Product Metrics)
If you’re evaluating tools and want to see your own data through this lens:
- Run a free product analysis to see how your catalog breaks down by performance segment before you touch campaigns. (Source: Product Metrics)
- Or book a demo to walk through a full segmentation → labels → campaign structure example with your own context. (Source: Product Metrics)
Whether you end up on native tools, a feed platform, or a dedicated segmentation engine, the goal is the same:
A Shopping/PMax setup where you can point to every cluster of products, explain why it has its current priority, and change that priority in one place.
Once you have that, “clear reporting” stops being a wish and becomes a weekly process.
Written by
Berend Vrakking, Founder of Product Metrics
1M+ products analysed · Nominated at the Dutch Search Awards for Best Measurement Campaign (2023) and Best Use of Data (2024)
Keep reading.
Implementation Playbook: Segmenting Google Shopping by Product Group Relevance Step-by-Step (Rules, Labels, and Scripts)
Implementation playbook for segmenting Google Shopping by product group relevance: a 30-minute audit, a 4-phase rollout, a label schema and a 14-day pilot.
Google Shopping and PMax campaign structure by profit
Google Shopping and PMax campaign structure by profit: when to split, how custom labels select products, and a six-product worked example.
Campaign Segmentation in Google Shopping - Principles, Pitfalls, and Governance
Campaign segmentation in Google Shopping - principles, pitfalls and governance for Shopping and Performance Max structures that keep enough data to learn.
See which of your products to push, fix or pause. Start with your own products, or a 30-second estimate.
Check one product first: work out its break-even ROAS in the calculator. Then see where all your products stand.
Questions, or want to spar about your products? Book a demo: a video call with Berend, then a demo account.