
Historical ROAS Analysis Playbook for Google Shopping: Trends, Visualization Patterns, and Dashboards
Historical ROAS Analysis Playbook for Google Shopping: operationalize historical ROAS analysis for Shopping and PMax with data, workflow and dashboards.
If you manage Google Shopping or Performance Max for ecommerce, your biggest wins rarely come from tweaking bids in yesterday’s data. They come from seeing how ROAS behaves over months and seasons, then reorganizing budgets, feeds, and structure around those patterns.
This playbook shows you how to operationalize historical ROAS analysis for Shopping and PMax with:
- A clean data foundation
- A repeatable analysis workflow
- Concrete visualization and dashboard patterns
- Tooling options (including where a platform like productmetrics.io can sit in your stack)
The focus is method-centric and replicable: you should be able to rebuild these views in Sheets, Looker Studio, Power BI, or a specialized ROAS optimization tool.
1. What “Historical ROAS Analysis” Actually Means For Google Shopping & PMax
Most PPC workflows are short-horizon:
- “Did ROAS hold yesterday?”
- “Which products spent over 3× target CPA with zero conversions this week?”
Historical ROAS analysis zooms out to questions like:
- How does Shopping and PMax ROAS move across seasons, promotions, and economic cycles?
- Which campaigns, product groups, and SKUs beat target ROAS consistently over 6–12 months vs. spiking once?
- Where do we have headroom to scale (high ROAS, low impression share) versus segments we should defend or exit?
- How long does it typically take for a Shopping or PMax click to convert (1, 7, 14, 30 days), and how should that change our bidding and reporting?
- What actually happened to ROAS when we switched to Target ROAS, launched PMax, or overhauled the feed?
Answering these requires:
- Clean, reliable revenue tracking and ROAS math.
- A standardized historical dataset (ideally 12–24 months) for Shopping/PMax.
- A set of analyses and visual patterns you rerun on a cadence.
2. Step 1 - Get Clean, Connected Data Before You Touch Trends
Historical analysis is only as good as the tracking underneath it. Before building dashboards, lock in the following.
2.1 Track Revenue Properly And Prioritize ROAS As A Primary KPI
At minimum, you need conversion actions that pass transaction value, currency, and transaction ID from your ecommerce platform into Google Ads. ROAS is then simply:
ROAS = Conversion value ÷ Cost
Guides on Google Ads performance analysis emphasize ROAS as the closest metric to “is this making money?”, more decision-useful than CTR or CPC in isolation.
For Shopping and PMax specifically, segment ROAS at least by:
- Campaign
- Product group / item ID
- Brand vs. non-brand
- Device
- Network (Search / Shopping tab / YouTube / Display, where visible)
2.2 Respect Conversion Lag And Lock Your Lookback Windows
Shopping and PMax often have meaningful conversion lag—days or weeks between click and purchase. If you treat yesterday’s conversions as final, you will systematically undercount revenue and make bad optimization decisions.
Best practice for historical comparisons:
- Use a fixed lookback window (e.g., last 14 or 30 days closed) for any period-over-period ROAS comparison.
- Don’t compare last 3 days of data to anything; lag noise is too high.
- For weekly historical data, don’t “freeze” last week until enough days have passed for the lag to settle.
Performance analysis guidance commonly recommends 7–14 day windows for meaningful comparisons, especially at lower volumes.
2.3 Connect Google Ads To Analytics And (Optionally) Your CRM
Google Ads alone only sees what happens up to the conversion pixel. For robust historical ROAS analysis, you often need:
- Google Ads ↔ Google Analytics link for cross-channel paths and assisted conversions.
- CRM or order system connection to see repeat purchases and customer lifetime value by acquisition campaign.
This matters historically because a campaign with mediocre same-session ROAS can be a star once you include returning buyers over months.
2.4 Structure Shopping & PMax For Analysis Not Just For Delivery
Future you—the one doing ROAS trend work—needs structure that makes sense in a pivot table.
Helpful conventions:
- Separate brand vs. non-brand campaigns where search queries are visible; branded traffic inflates ROAS and hides true acquisition efficiency.
- Group products by margin tiers, category, or lifecycle (new, evergreen, clearance) using campaign names, ad group names, or custom labels.
- For PMax, use asset groups and labels to approximate product themes and funnel stages.
- Keep naming conventions consistent so that a single parsing rule can classify years of data.
3. Step 2 - Build A Standardized Historical ROAS Dataset
Once tracking and structure are stable, you need a repeatable way to pull and reshape historical data.
3.1 Export The Right Reports
From Google Ads, export at least 12 months (ideally 24) of performance at daily or weekly granularity:
- Campaign report with: date, campaign name, cost, clicks, impressions, conversions, conversion value, and impression share.
- Product group or item ID report for Shopping/PMax: product item ID, product type/category, brand, cost, conversions, conversion value, clicks, impressions.
- Optionally, search terms reports over the same period for additional context and brand vs. non-brand checks.
These steps mirror common Google Ads performance-analysis workflows: export campaign- and keyword-level data, then enrich it outside the UI for deeper ROAS work.
3.2 Normalize And Enrich The Data
In your spreadsheet, BI tool, or data warehouse, create a consolidated table with columns such as:
- Date (truncate to week start if you want weekly granularity)
- Account ID
- Campaign name and parsed attributes (brand/non-brand, country, language, PMax vs. standard Shopping, margin tier, vertical, etc.)
- Product item ID, product type, brand
- Device
- Cost, clicks, impressions, conversions, conversion value
Then add derived metrics:
- ROAS = conversion value ÷ cost
- CPA = cost ÷ conversions
- Conversion rate = conversions ÷ clicks
- Average order value (AOV) = conversion value ÷ conversions
- Impression share and impression share lost (budget / rank), where available
Finally, mark data freshness flags so you can easily exclude partial weeks or days still inside conversion lag.
3.3 Aggregate To The Right Time Grain
Daily ROAS is extremely noisy, especially for long-tail products. Practical options:
- Weekly for most trend and seasonality work (recommended).
- Monthly for executive summaries and long-range budgeting.
Performance analysis playbooks often recommend exporting 12 months of weekly data and using time-series techniques to separate trend, seasonality, and anomalies—exactly what we want for Shopping ROAS.
4. Step 3 - Core Historical ROAS Analyses For Shopping & PMax
With a standardized dataset, you can run a handful of analyses that consistently surface ROAS opportunities.
4.1 Seasonality And Long-Term Trend
Question: How does ROAS behave across seasons and over the long term?
How to analyze:
- Plot weekly ROAS for:
- All Shopping campaigns
- All PMax campaigns
- Key categories (e.g., Shoes, Electronics, Home & Garden)
- Overlay a target ROAS line and highlight promotional periods (Black Friday, back to school, etc.).
- Optionally, compute a 4-week rolling average line to smooth volatility.
What to look for:
- Recurring peaks and troughs around the same weeks each year (seasonality).
- Structural trend changes after big strategy shifts (e.g., PMax rollout, new bidding strategies, feed overhauls).
Use this to inform budget front-loading in high-ROAS seasons and to temper expectations in historically weak periods.

Show the dataHide the data
| Month | ROAS |
|---|---|
| Jan | 3.6 |
| Feb | 3.8 |
| Mar | 4.1 |
| Apr | 4.3 |
| May | 4.2 |
| Jun | 3.9 |
| Jul | 3.7 |
| Aug | 4 |
| Sep | 4.4 |
| Oct | 4.6 |
| Nov | 5.3 |
| Dec | 4.8 |
4.2 Product And Campaign Consistency Vs. One-Off Spikes
Question: Which segments are true ROAS winners vs. one-hit wonders?
How to analyze:
- For each product group, item ID, or campaign, calculate:
- Median ROAS over the last 6–12 months
- Standard deviation of weekly ROAS
- Share of weeks above target ROAS
- Visualize as a scatter plot:
- X-axis: median ROAS
- Y-axis: ROAS volatility (standard deviation)
What to look for:
- Consistently strong: high median ROAS, low volatility → candidates to scale budget and impression share.
- Volatile winners: high median but high volatility → treat with more guardrails (e.g., caps, seasonality-aware targets).
- Chronic underperformers: low median ROAS → fix fundamentals (pricing, feed, landing page) or cut.
This moves you beyond crude “last 30 days” rankings and aligns with performance-analysis best practices that emphasize looking at distributions, not just averages.

Show the dataHide the data
| Product | Median weekly ROAS | Standard deviation of weekly ROAS |
|---|---|---|
| Product A (consistently strong) | 5.2 | 0.6 |
| Product B (volatile winner) | 5 | 2.3 |
| Product C (chronic underperformer) | 2.4 | 0.8 |
4.3 ROAS Vs. Impression Share - Finding Scale Headroom
Question: Where can we safely spend more to grow revenue without tanking ROAS?
How to analyze:
- For each campaign or product segment, compute:
- Average ROAS (or profit-based metric if you have margin data)
- Impression share
- Impression share lost due to budget and rank
- Build a table or bubble chart segmenting:
- High ROAS + low impression share
- High ROAS + high impression share
- Low ROAS + high impression share
What to look for:
- High ROAS + high budget-lost impression share → obvious candidates to increase budgets; you’re leaving profitable traffic on the table.
- High ROAS + high rank-lost impression share → improve feed relevance and landing page quality, or strategically raise bids.
- Low ROAS + high impression share → segments where you may be flooding low-quality traffic; tighten targeting, bids, or eligibility.
4.4 Multi-Window ROAS And Conversion Lag
Question: How fast does value accrue after a click, and how different is 1-day ROAS from 7-, 14-, or 30-day ROAS for each campaign?
How to analyze:
- Create multiple conversion actions or reporting views that measure:
- Revenue in 1-day, 7-day, 14-day, and 30-day post-click windows.
- For each campaign or product segment, chart ROAS for each window side-by-side.
What to look for:
- Campaigns where short-window ROAS looks terrible, but long-window ROAS is on target → don’t overreact to early data; align bid strategies to longer attribution windows.
- Campaigns where almost all value lands in 1–3 days → you can make quicker optimization calls.
Advertisers often use exactly these staggered windows (1, 7, 14, 21, 30 days) to understand how ROAS evolves and to set smarter bidding targets.

Show the dataHide the data
| Conversion window after the click | Campaign A (fast) | Campaign B (slow) |
|---|---|---|
| 1 day | 3.8 | 1.6 |
| 7 days | 4.3 | 3 |
| 14 days | 4.4 | 3.7 |
| 30 days | 4.5 | 4.4 |
4.5 Structural Changes And Experiment Readouts
Question: Did major strategic changes actually improve ROAS over time?
Common events to annotate:
- Switching from manual CPC or enhanced CPC to Target ROAS.
- Migrating from Smart Shopping to PMax.
- Big feed optimizations (titles, GTIN coverage, additional attributes).
- Price changes or promo overlays.
How to analyze:
- Add event markers on your ROAS time-series.
- Run simple before/after comparisons (e.g., last 60 days before vs. 60 days after, normalized for seasonality where possible).
- For large changes, consider a test vs. control design based on product groups, countries, or brands.
This is where a historical dataset shines: it lets you distinguish “things changed because you changed something” from “things changed because of the calendar.”
5. Step 4 - Dashboard Patterns For Historical ROAS Visualization
Once the analyses above are clear, you can encapsulate them in a small set of reusable dashboard modules. Think “lego bricks” that a tool like productmetrics.io, Looker Studio, or Power BI can assemble into views for different stakeholders.
5.1 Executive Overview - ROAS And Revenue At A Glance
Purpose: Give leadership a reliable snapshot of where Shopping/PMax efficiency and volume stand compared with plan.
Key elements:
- Date range filter (with presets like last 7, 30, 90 days and custom YYYY–MM ranges).
- Filters for:
- Brand vs. non-brand
- Shopping vs. PMax
- Country / region
- Device
- KPI tiles:
- Spend, revenue, ROAS
- Conversions, conversion rate, AOV
- Impression share and impression share lost (budget / rank)
- Trend line of weekly ROAS vs. target with annotation markers.
This tab should be deliberately boring—no more than 5–7 primary metrics. It exists to prevent reactive decisions based on daily noise.
5.2 Historical ROAS Trends Tab
Purpose: Analyze patterns in ROAS over time by segment.
Modules:
- ROAS time-series panel
- Weekly ROAS for the selected segment (campaign, category, market), with a 4-week moving average.
- Year-over-year overlay if you have 24+ months.
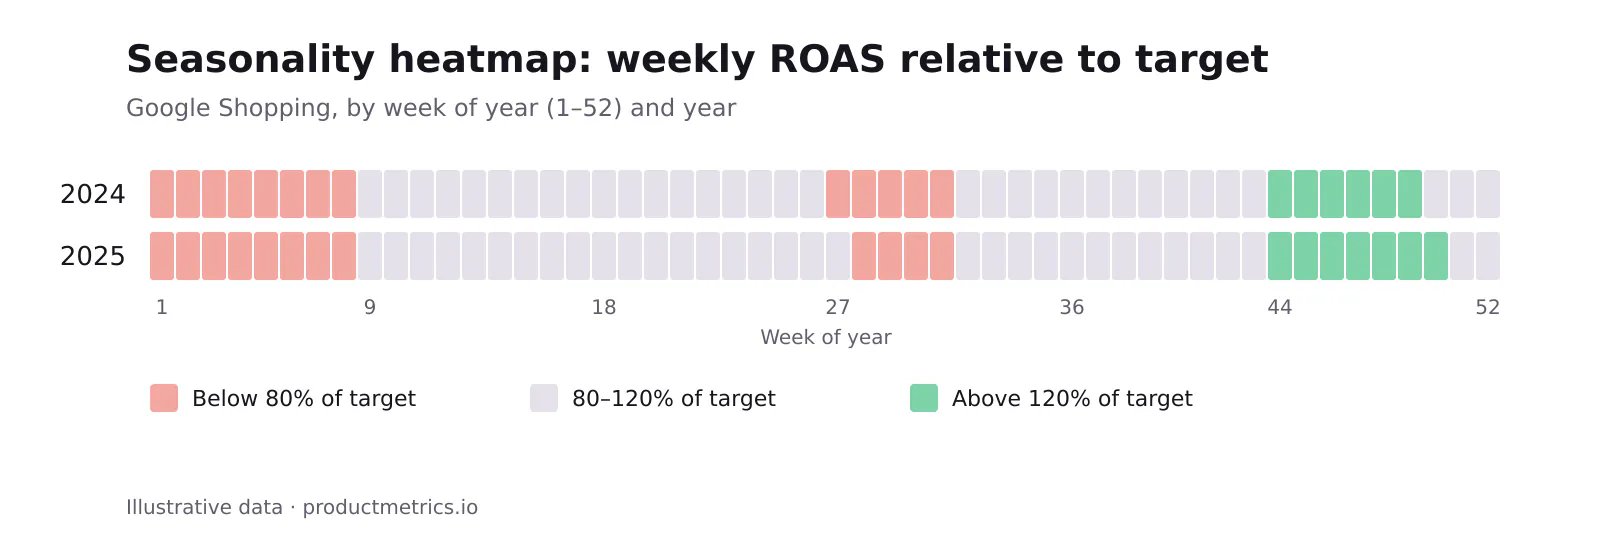
- Seasonality heatmap
- X-axis: week of year (1–52)
- Y-axis: year
- Cell color: ROAS relative to target (e.g., <80%, 80–120%, >120%).
Use this to plan budgets, promos, and bid strategies around proven seasonal patterns.
5.3 Product Cohort Stability Tab
Purpose: Identify products and categories that consistently drive profitable ROAS.
Modules:
- Product vs. month heatmap
- Rows: top N SKUs or product types by spend.
- Columns: months.
- Color: ROAS vs. target.
- Detail table with filters for margin tier, brand, lifecycle stage.
You’ll quickly see:
- Evergreen heroes (stable high ROAS across months).
- Seasonal stars.
- Chronic underperformers dragging down blended performance.
5.4 Conversion-Lag And Multi-Window ROAS View
Purpose: Make lag visible so you stop judging slow-converting campaigns too early.
Modules:
- Bar chart: ROAS at 1, 7, 14, and 30 days for each major campaign.
- Cumulative curve: share of revenue received by day since click.
Decisions this supports:
- Which campaigns can use shorter optimization windows safely.
- Where to keep more conservative automation or manual oversight.

Show the dataHide the data
| Day since click | Campaign A (fast) | Campaign B (slow) |
|---|---|---|
| Day 1 | 84% | 36% |
| Day 3 | 91% | 55% |
| Day 7 | 96% | 68% |
| Day 14 | 98% | 84% |
| Day 21 | 99% | 94% |
| Day 30 | 100% | 100% |
5.5 Budget Reallocation Matrix
Purpose: Turn months of historical ROAS into concrete budget moves.
Modules:
- Table with each row = campaign or product group, columns:
- Spend
- Revenue
- ROAS
- Impression share
- Impression share lost (budget / rank)
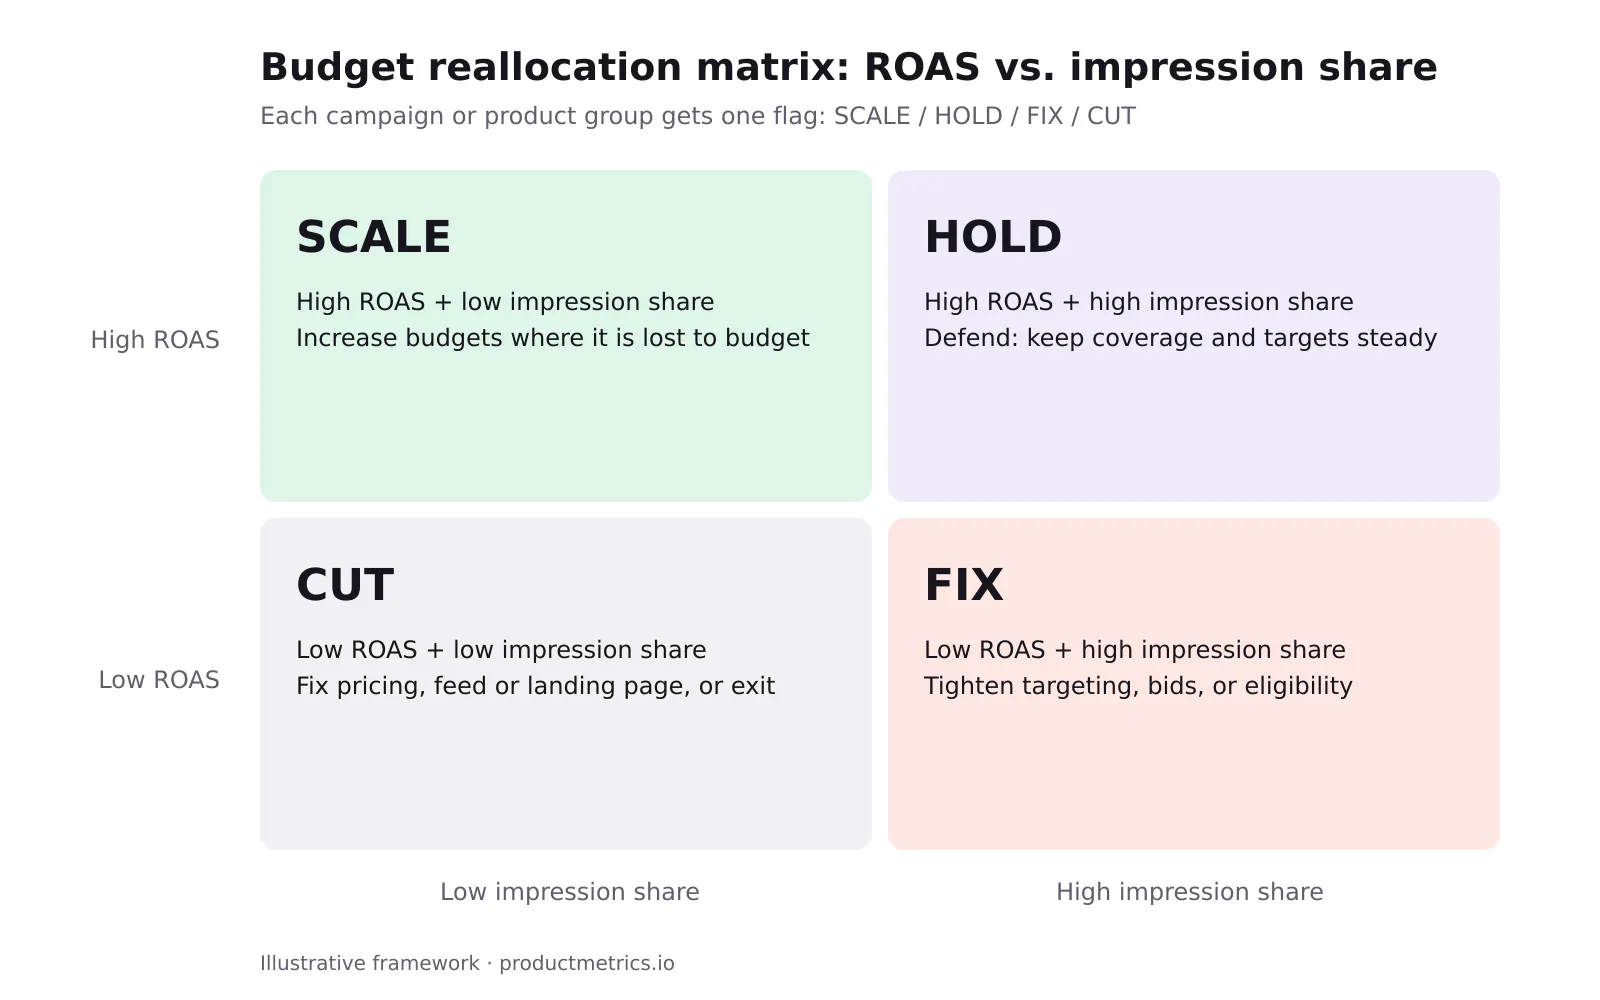
- Flag column with an automated rule: SCALE / HOLD / FIX / CUT
This mirrors performance-analysis advice to prioritize high-ROAS segments with low impression share, and to fix or exit segments with low ROAS and high coverage.
5.6 PMax Vs. Standard Shopping Comparison
Purpose: Answer, with data, whether PMax has improved ROAS for specific product sets vs. your legacy Shopping structure.
Modules:
- Side-by-side ROAS and revenue trends for:
- Legacy Shopping-only period
- Mixed Shopping + PMax
- PMax-dominant period
- Product-level table showing items that moved from Shopping to PMax and how ROAS changed.
This view is invaluable when stakeholders ask, months later, “Did PMax actually help?”
6. Step 5 - Best Solutions And Tools For Historical ROAS Tracking In Google Shopping
A big share of search demand around this topic is tool-centric: people want “the best Google Shopping ROAS optimization tools with historical data visualization.” Instead of just listing vendor names, it’s more useful to map the landscape by approach.
6.1 Native Google Ads Reporting
Pros:
- Free and immediately available.
- Predefined reports and custom columns let you see ROAS, CPA, conversion rate, AOV, and impression share in one place.
Cons:
- Limited when you need multi-year views, flexible cohorts, custom lag windows, or blended metrics across accounts.
- Historical experiment readouts and structural-change analysis are cumbersome.
Best for quick checks and small accounts, not deep historical ROAS work.
6.2 Spreadsheets (Excel / Google Sheets)
Pros:
- Full control over calculations and visualizations.
- Easy to prototype the analyses in this playbook.
Cons:
- Manual exports and refreshes are fragile.
- Hard to scale beyond a few accounts or 12–24 months of data.
Best for solo specialists or as a proof-of-concept before you commit to a more robust stack.
6.3 BI + Warehouse Stack (BigQuery, Snowflake, Looker Studio, Power BI)
Pros:
- Automatable data pipelines and scheduled refreshes.
- Handles multi-year, multi-account datasets comfortably.
- Flexible for custom metrics (profit, LTV-based ROAS, customer cohorts).
Cons:
- Requires data engineering and modeling work.
- Dashboards take time to design well.
This is the right path when you want full ownership of the data model and already have BI skills in-house.
6.4 Specialized Google Shopping ROAS Optimization Tools
This is where “Google Shopping optimization software for tracking and analyzing historical ROAS” lives.
Common capabilities to look for:
- Automatic ingestion of Google Ads, Merchant Center, and Analytics data, with multi-account and multi-country support.
- Prebuilt historical ROAS dashboards similar to the patterns in this guide (trends, cohorts, conversion lag, budget reallocation).
- Deep product-level views: attribute-level breakdowns (brand, category, margin tier) and SKU-level ROAS over long periods.
- Alerting and recommendations around threshold breaches (e.g., ROAS below target for 4 consecutive weeks, high ROAS + low impression share, sudden drops or spikes).
- Optional pricing, feed, or post-click modules for broader optimization:
- Bid and rule automation similar to what bid-optimization tools offer.
- Competitive price monitoring and repricing to protect ROAS against cheaper rivals.
- Enhanced product feeds and landing experiences that can lift conversion rates and therefore ROAS.
Where a platform like productmetrics.io can stand out is by focusing specifically on historical performance analysis for Shopping and PMax—acting as a purpose-built analytics and decision layer rather than trying to be a full campaign-management suite.
When evaluating any tool, map its features back to this playbook:
- Can it ingest enough history (12–24+ months)?
- Does it provide the dashboards you need (trends, cohorts, lag, budget headroom)?
- Can it help you operationalize changes (alerts, workflows, or even pushing adjustments back into Google Ads)?
7. Step 6 - Turn Historical ROAS Insights Into A Repeatable Optimization Cycle
Insights don’t move ROAS; processes do. Here’s a practical cadence that plugs this playbook into your workflow.
7.1 Monthly - ROAS And Budget Allocation Review
- Freeze the last period once conversion lag is satisfied (e.g., close the previous calendar month after 7–14 days).
- Review:
- Overall Shopping and PMax ROAS vs. target.
- Category- and country-level trends.
- Budget reallocation matrix (where to SCALE / HOLD / FIX / CUT).
- Translate into concrete actions:
- Increase budgets where high ROAS + high budget-lost impression share.
- Decrease or restructure segments with poor ROAS and high impression share.
- Open or close experiments (e.g., new PMax asset groups or split Shopping structures).
7.2 Quarterly - Structural And Strategic Deep Dive
Once per quarter, step back and use the full historical window:
- Revisit seasonality patterns and adjust your annual budget allocation by peak periods.
- Evaluate the long-term impact of big structural changes (e.g., the PMax rollout, major pricing or margin changes).
- Reclassify products where behavior has changed (e.g., former new products that are now evergreen heroes).
Many performance-analysis frameworks recommend similar cadences: quick checks daily/weekly, deeper ROAS and structure work monthly, and strategic reviews quarterly.
7.3 Ongoing - Feed Price And Post-Click Improvements
Historical ROAS analysis will surface what is broken; fixing why usually involves:
- Feed optimization (titles, attributes, GTIN completion).
- Price competitiveness (avoiding being consistently overpriced vs. the SERP).
- Landing-page performance (especially on mobile and for long-tail queries).
Use your dashboards as the top of a troubleshooting funnel, then pull in feed tools, repricing engines, or CRO resources as needed.
8. Bringing It Together
To recap, an operational historical ROAS system for Google Shopping and PMax requires:
- Clean tracking and structure – reliable revenue data, connected platforms, and analyzable campaign/product naming.
- A standardized dataset – at least 12 months of weekly Shopping/PMax performance enriched with ROAS, CPA, AOV, and impression share.
- A small set of powerful analyses – seasonality, product and campaign consistency, ROAS vs. impression share, lag-aware ROAS, and structure-change readouts.
- Dashboards that encode those analyses into re-usable views for different stakeholders.
- A cadence and tooling layer that turns insights into decisions and pushes those decisions into your campaigns.
Whether you implement this in spreadsheets, a BI stack, or a specialized platform like productmetrics.io, the goal is the same: stop guessing from last week’s numbers and start steering Shopping and PMax using the full story your historical ROAS is already telling you.
Written by
Berend Vrakking, Founder of Product Metrics
1M+ products analysed · Nominated at the Dutch Search Awards for Best Measurement Campaign (2023) and Best Use of Data (2024)
Keep reading.
The 2026 Ecommerce ROAS Optimization Tools Landscape - How Performance Teams Evaluate, Pilot, and Scale
The 2026 ecommerce ROAS optimization tools landscape - how performance teams evaluate, pilot and scale Google Shopping tools with custom dashboards.
How to Build a Google Shopping ROAS Dashboard That Actually Moves Revenue: Templates, Metrics and Workflows
How to Build a Google Shopping ROAS Dashboard That Actually Moves Revenue: the metric stack, drilldowns, alerts and experiment log, with templates.
Best Tools For Google Shopping ROAS Optimization With Customizable Dashboards
Six Google Shopping ROAS dashboard tools scored on five criteria: Google Ads native, Product Metrics, Optmyzr, ProfitMetrics, Channable Insights and GoDataFeed.
See which of your products to push, fix or pause. Start with your own products, or a 30-second estimate.
Check one product first: work out its break-even ROAS in the calculator. Then see where all your products stand.
Questions, or want to spar about your products? Book a demo: a video call with Berend, then a demo account.