
Find Tools That Use Historical Performance to Boost Google Shopping ROAS: Cohorts, Lookbacks, and Attribution Windows
Find Tools That Use Historical Performance to Boost Google Shopping ROAS: six questions on cohorts, lookback and conversion windows for every vendor demo.
Every Google Shopping platform promises higher ROAS. Very few are explicit about how they use your historical data to get there.
If you manage Shopping and Performance Max at scale, you already know that Google’s own Smart Bidding uses past performance to set bids in every auction. Google Ads explicitly states that automated bidding for Shopping “takes your campaign’s historical performance and future goals into account” when setting bids and targets. (Source: Google Ads Help – Automated bidding for Shopping campaigns)
So the bar for any Google Shopping optimization software is not “we use historical data” – Google already does. The real question is:
Does this platform use historical performance in more intelligent, more transparent ways than Google’s native tools – and can I act on those insights at product level?
This piece is a practical guide to that question. It’s written for practitioners who are actively looking for Google Shopping optimization tools that analyze historical performance for better ROAS, and who need a concrete framework to evaluate them.
1. What “Historical Performance” Really Means in Google Shopping
Most product-level Shopping reporting still revolves around a crude view of history: last 7 days, last 30 days, maybe last 90 days. That’s not enough context for serious ROAS optimization.
To understand how a tool truly uses historical performance, separate three concepts that often get blurred:
- Cohorts – Who or what is being grouped together over time?
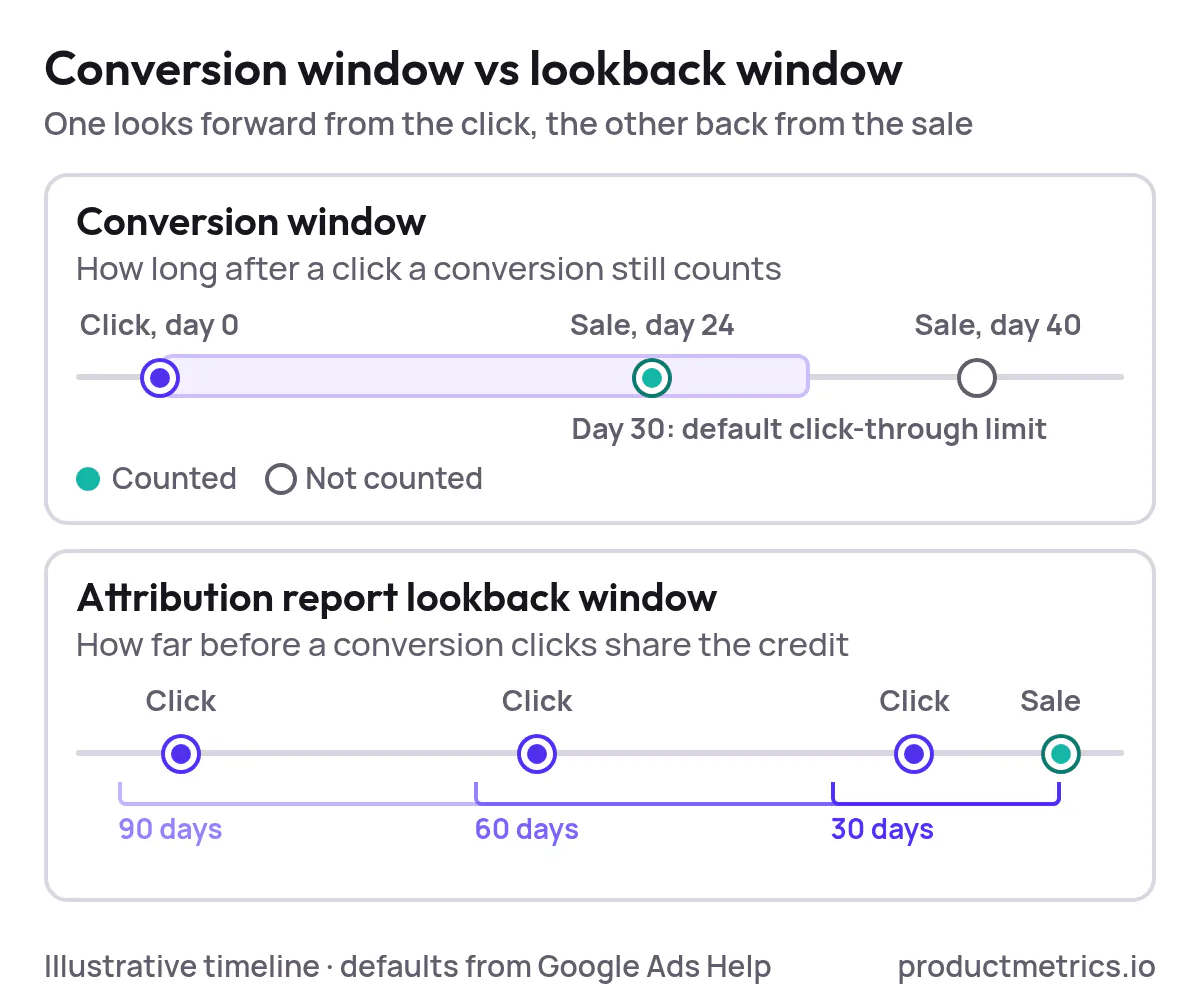
- Lookback windows – How far back from the conversion do we credit interactions in reports?
- Attribution (conversion) windows – How long after an ad interaction do we keep attributing conversions to it?
Google Ads already exposes the last two in its attribution reports. You can set conversion windows (for example, a default 30‑day click-through conversion window) and adjust attribution report lookback windows (30, 60, or 90 days) independently. (Source: Google Ads Help – About conversion windows, Google Ads Help – About attribution reports)
| Concept | Question it answers | In Google Ads |
|---|---|---|
| Cohort | Which products are tracked together over time | Not a setting |
| Lookback window | How far before a conversion clicks get credit | Attribution reports: 30, 60 or 90 days |
| Conversion window | How long after a click a conversion counts | Conversion action: 30 days by default for clicks |
Most third‑party tools, however, barely scratch the surface of cohorts – especially at product level. That’s where a platform can create real lift on top of Smart Bidding.
2. What Google Already Does With History – and Where Tools Add Value
Before you evaluate any optimization software, it helps to be clear on what’s already built into Google’s own systems.
2.1. Smart Bidding’s Built In Use Of Historical Data
Smart Bidding learns from both new and historical ad interactions and conversion data across your account, and it continuously updates bidding algorithms to align with your conversion cycle. (Source: Google Ads Help – Smart Bidding learning, Google Ads Help – Setting smarter search bids)
Key implications for Shopping:
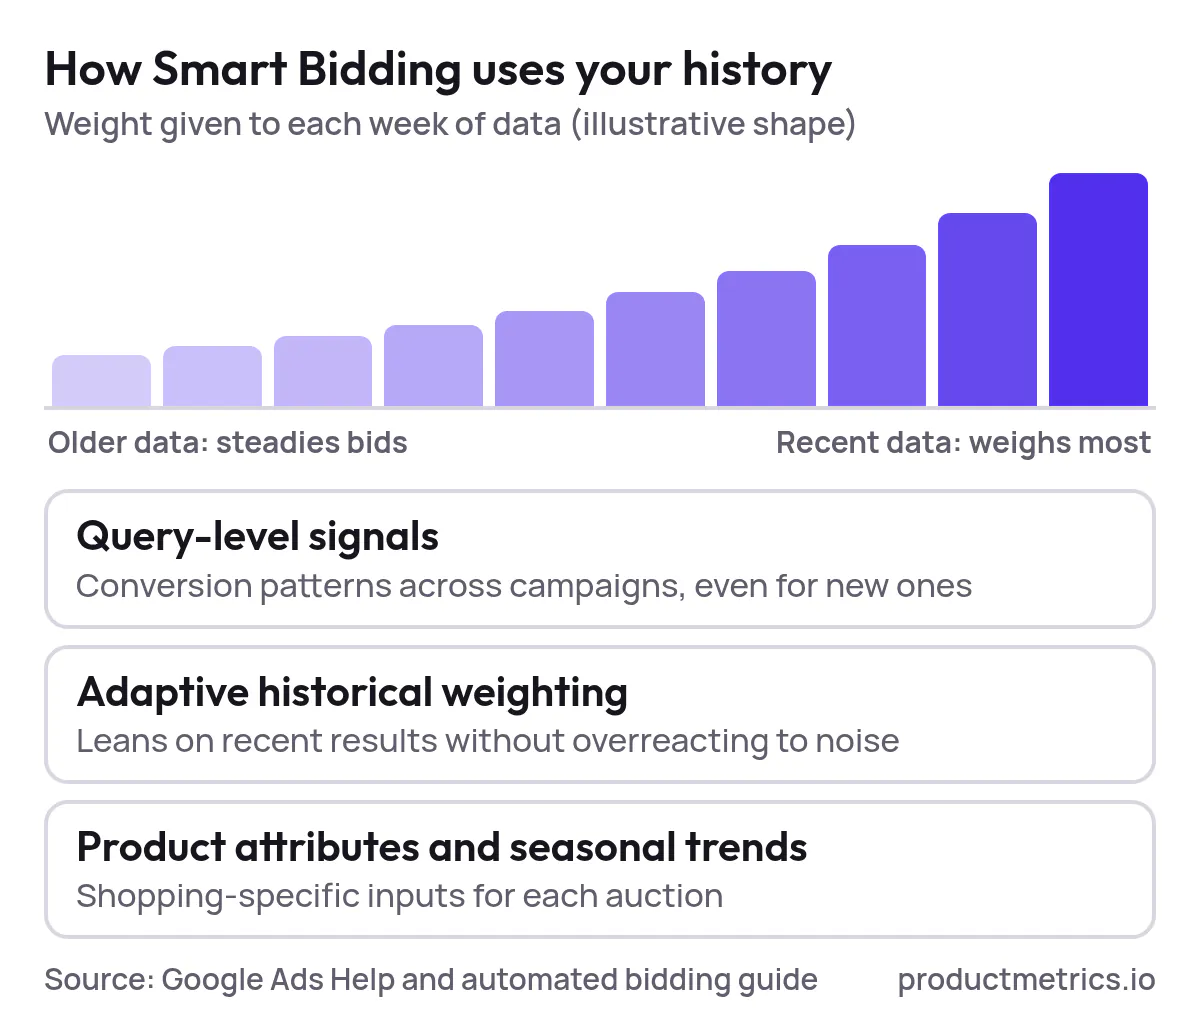
- Google looks at query‑level signals and historical conversion patterns across campaigns to build its initial bidding model, even for new campaigns. (Source: Google Ads Help – Smart Bidding learning)
- The algorithms apply adaptive historical weighting - they lean more on recent performance, but still use older data to stabilise bids and avoid overreacting to noise. (Source: Google Ads automated bidding guide (PDF))
- For Shopping, Google’s own documentation notes that Smart Bidding leverages product attributes and seasonal performance trends when optimising bids. (Source: Google Ads Help – About Smart Bidding)
In other words: Smart Bidding is already a sophisticated historical-performance engine.
2.2. The Gap: Product Level Context And Control
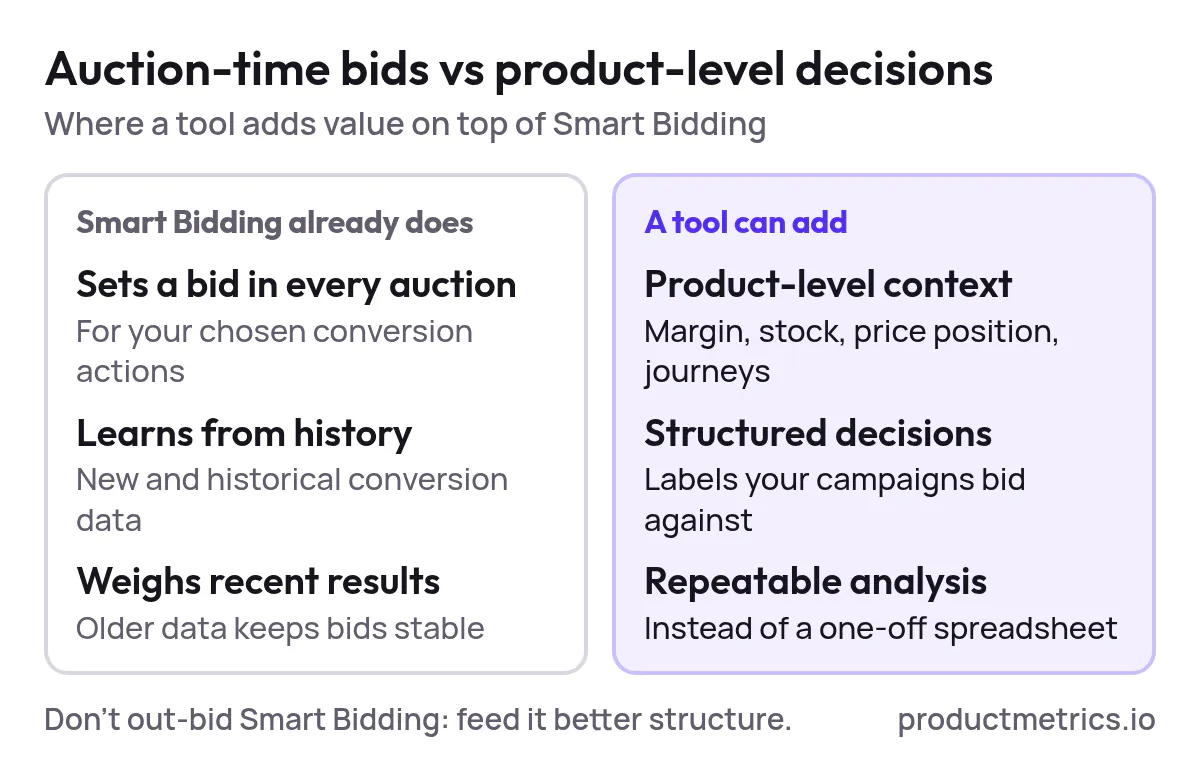
Where external tools can add value is not by “out‑smarting” Smart Bidding at auction time, but by:
- Giving you richer product‑level context around that performance (margin, stock, competitive price position, journeys).
- Turning that context into structured decisions - for example, labels that your Shopping and PMax campaigns can bid against at scale.
- Making historical performance analysis trustworthy and repeatable, rather than a one‑off spreadsheet.
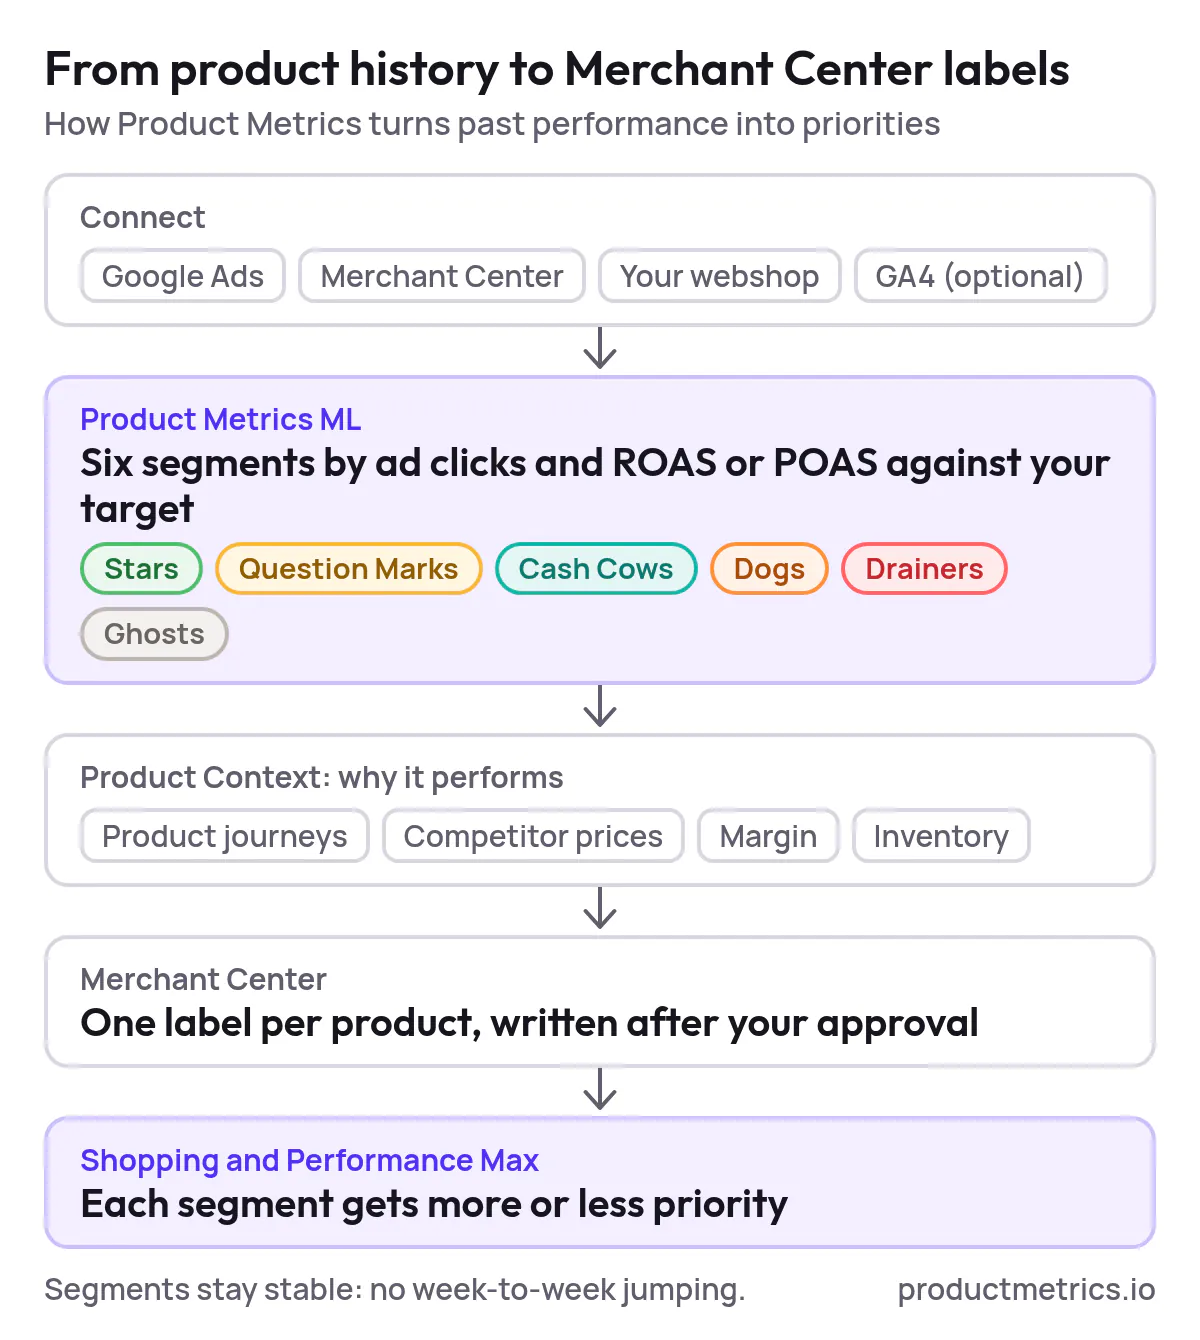
This is the space platforms like Product Metrics occupy: they connect Google Ads and Merchant Center data with ecommerce and (optionally) GA4, then segment products by click volume and ROAS/POAS, layered with journeys, price, margin, and inventory. (Source: Product Metrics – Product-level Google Shopping optimisation)
If you’re searching for Google Shopping optimization platforms with historical performance analysis for ROAS improvement, evaluate whether they genuinely close this gap.
3. Cohorts, Lookbacks, And Attribution Windows: A Shared Vocabulary
3.1. Cohorts: Group History By What Matters To ROAS
A cohort is simply a group of entities that share a defining characteristic and are tracked over time. For Shopping, the most actionable cohorts are usually:
- Product cohorts – for example:
- New arrivals vs evergreen products
- Full‑price vs heavily discounted items
- Branded flagship lines vs long‑tail SKUs
- Economics cohorts – products grouped by margin bands or contribution profit (e.g., <20%, 20–40%, >40%).
- Lifecycle cohorts – products that entered Shopping in the same week or month, so you can compare how their ROAS curves mature.
- Channel or campaign cohorts – products primarily surfaced via PMax vs Standard Shopping vs Search.
Platforms that really use historical performance will let you:
- Define these cohorts explicitly, not just filter by one dimension at a time.
- Track ROAS, POAS, and profit per cohort over multiple windows (7/30/90 days or custom ranges).
- Turn cohorts into bidding entities - for example, by writing labels back into Merchant Center that your campaigns or asset groups can target.
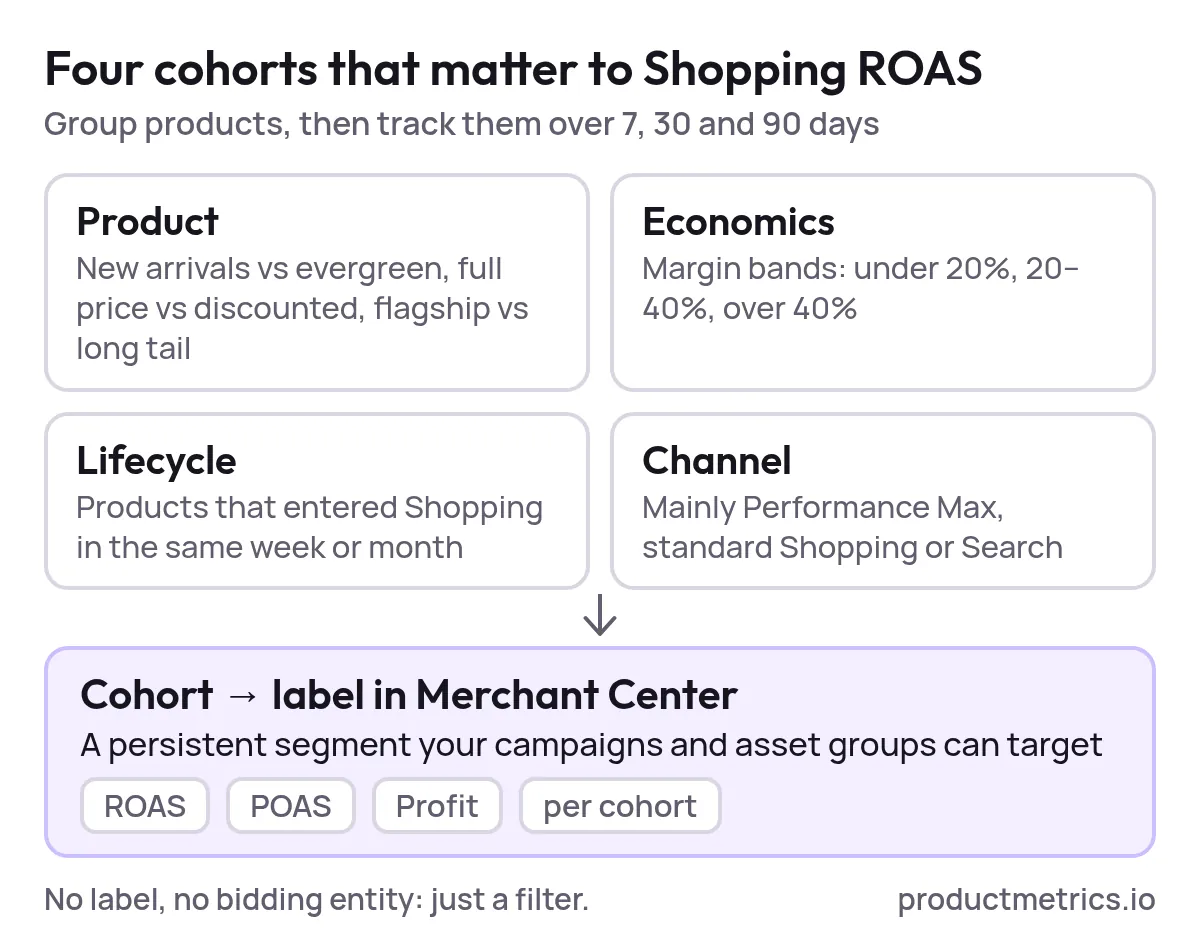
Product Metrics, for instance, uses machine learning to place each product into segments based on ad click volume and ROAS/POAS against your targets, then writes those segments back as Merchant Center labels you can bid on. (Source: Product Metrics – Product Segmentation)
If a vendor claims “cohort analysis” but can’t show you clear, persistent product segments that feed into bidding, you’re likely just looking at glorified filters.
3.2. Lookback Windows: How Far Back We Credit Interactions
Lookback windows appear in Google Ads attribution reports as the number of days before a conversion that ad interactions are considered for credit allocation - typically 30, 60 or 90 days. (Source: Google Ads Help – About attribution reports)
For Shopping categories with long consideration cycles (furniture, high‑end electronics, B2B), a default 30‑day lookback will often under‑credit upper‑funnel Shopping clicks that influence later conversions.
Capabilities to look for in tools:
- Multi‑window views at product level (e.g., 7/30/60/90 days side‑by‑side) to understand how quickly value accrues.
- Cohort‑specific lookbacks - for example, allowing higher‑price cohorts to default to a 60‑ or 90‑day lens.
- Attribution‑model awareness - understanding whether those windows apply to last‑click, data‑driven or other models.
3.3. Attribution Windows: How Long We Track Outcomes After A Click
A conversion window is the period after an ad interaction during which conversions are recorded in Google Ads. By default, click‑through conversion windows are 30 days (you can change this), engaged‑view conversions default to 3 days, and view‑through conversions to 1 day. (Source: Google Ads Help – About conversion windows)
GA4 has its own key‑event lookback windows, with defaults like 30 days for acquisition events and 90 days for other conversion events configurable in the admin. (Source: Google Analytics Help – Change the key event lookback window)

Show the dataHide the data
| Window | Default window (days) |
|---|---|
| Google Ads click-through | 30 |
| Google Ads engaged-view | 3 |
| Google Ads view-through | 1 |
| GA4 acquisition key events | 30 |
| GA4 other key events | 90 |
Tools that simply ingest whatever conversion windows happen to be set - without surfacing them or helping you choose them - leave a lot of ROAS on the table. A better class of Google Shopping optimization software will:
- Expose the effective conversion and attribution windows per account so you can see what your ROAS metrics actually include.
- Help you model the impact of shorter vs longer windows on product‑level profitability.
- Provide guardrails when you change windows, to minimise Smart Bidding turbulence (for example, by referencing Google’s best‑practice guidance on changing biddable conversion actions). (Source: Google Smart Bidding guide – changing biddable conversion actions (PDF))
4. A Checklist For Tools That Use Historical Performance To Boost Shopping ROAS
If you’re actively trying to find software for Google Shopping that uses historical performance to boost ROAS, here is a practitioner‑level checklist.
Treat this as a set of questions for every demo and trial.
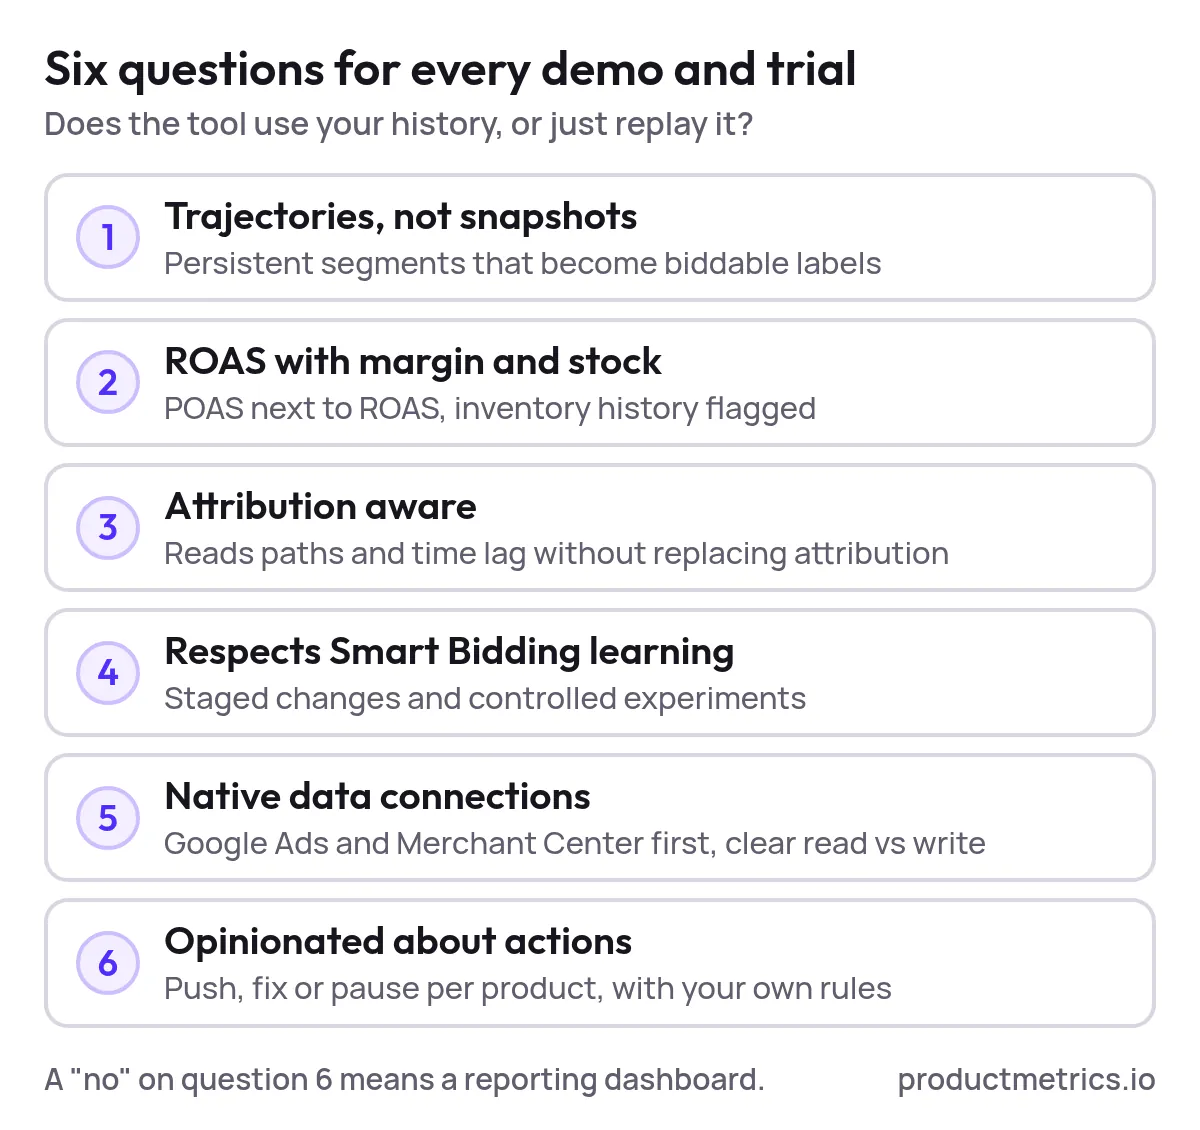
4.1. Can It Segment Products By Performance Trajectories, Not Just Snapshots?
Ask vendors to show:
- Product‑level ROAS or POAS history, grouped into persistent segments (e.g., proven winners, volume but marginal, low‑volume but high‑margin, chronic under‑performers).
- How those segments evolve over time – which products graduated from risky to reliable after feed or pricing changes.
- How segments become biddable entities (labels, asset‑group feeds, campaign structures) rather than remaining as passive reports.
Platforms like Product Metrics explicitly position themselves as an “operating system” for ecommerce, turning product‑level ad performance into Merchant Center labels that Shopping and PMax campaigns can act on. (Source: Product Metrics – Product-level control of Google Shopping)
4.2. Does It Combine ROAS With Profit Margin And Stock History?
Pure ROAS optimisation is dangerous in isolation. A tool that truly leverages historical performance should:
- Ingest per‑product margin or cost data, enabling POAS (profit on ad spend) alongside ROAS.
- Track how profitability curves change over time for different cohorts (e.g., high‑margin but low‑volume products).
- Incorporate inventory history - so that pushing historic winners that are now low on stock is flagged as a problem, not a success.
Product Metrics, for example, layers ad performance with journeys, competitor prices, margin, and inventory to classify whether a product should be pushed, fixed or paused. (Source: Product Metrics – Product Context)
4.3. Is It Attribution Aware Without Pretending To Replace Attribution?
For Shopping, you usually don’t want your optimisation platform to be your attribution engine. You want it to:
- Respect that Smart Bidding already optimises toward your chosen conversion actions and models. (Source: Google Ads Help – About automated bidding)
- Pull in conversion paths and time‑lag data from Google Ads/GA4 to understand when product‑level ROAS is likely under‑ or over‑stated.
- Surface basket‑level and cross‑sell effects (e.g., products that rarely get last‑click credit but reliably sit in profitable baskets).
Notably, Product Metrics states directly that it’s not an attribution tool; its job is to explain product performance and write smarter labels, not to redefine which channel “deserves” credit. (Source: Product Metrics – FAQ)
That separation of concerns is usually healthy.
4.4. Can It Deal With Smart Bidding’s Learning Behaviour And Performance Swings?
Because Smart Bidding trains on historical data and weighs recent performance more heavily, aggressive structural changes can create noisy learning periods. (Source: Google Ads Help – Smart Bidding learning, Google Ads Help – Troubleshoot performance fluctuations in Shopping)
A credible tool should help you:
- Detect when historical baselines have shifted (for example, after a conversion‑tracking change).
- Stage structural changes (new labels, new campaigns, revised targets) in ways that respect Smart Bidding learning periods.
- Use Google Ads experiments or equivalent setup to run controlled tests rather than one‑way switches. (Source: Google Ads Help – Finding success with Smart Bidding)
4.5. Does It Plug Into Your Native Data Sources With Minimal Friction?
As a PPC specialist, you’re unlikely to buy a tool that requires a data warehouse project on day one.
Look for:
- Native connections to Google Ads and Merchant Center as the baseline.
- Optional but supported integration with GA4 and your ecommerce platform (Shopify, WooCommerce, Magento, etc.), so that product revenue and margin history are accurate. (Source: Product Metrics – How it works)
- A clear explanation of what is read vs what is written - for example, reading performance data and writing back labels only after your approval.
4.6. How Opinionated Is The System About What To Do With History?
Historical analysis is only valuable if it leads to better decisions.
Ask vendors to show, concretely:
- How the platform recommends push, fix or pause actions per product based on its historical and contextual data.
- How many of those actions can be automated safely (for example, auto‑tagging clear under‑performers) vs which ones require human review.
- Whether those recommendations can encode your own business rules (e.g., always protect house‑brand margin, don’t scale products with fragile stock).
If a tool can’t demonstrate this opinionated layer, it’s a reporting dashboard, not a ROAS optimisation platform.
5. Designing A Tactical Evaluation Plan Before You Buy
Once you’ve shortlisted one or two Google Shopping tools that use historical performance to optimise ROAS, run a structured evaluation instead of a vague “we’ll see what happens” trial.
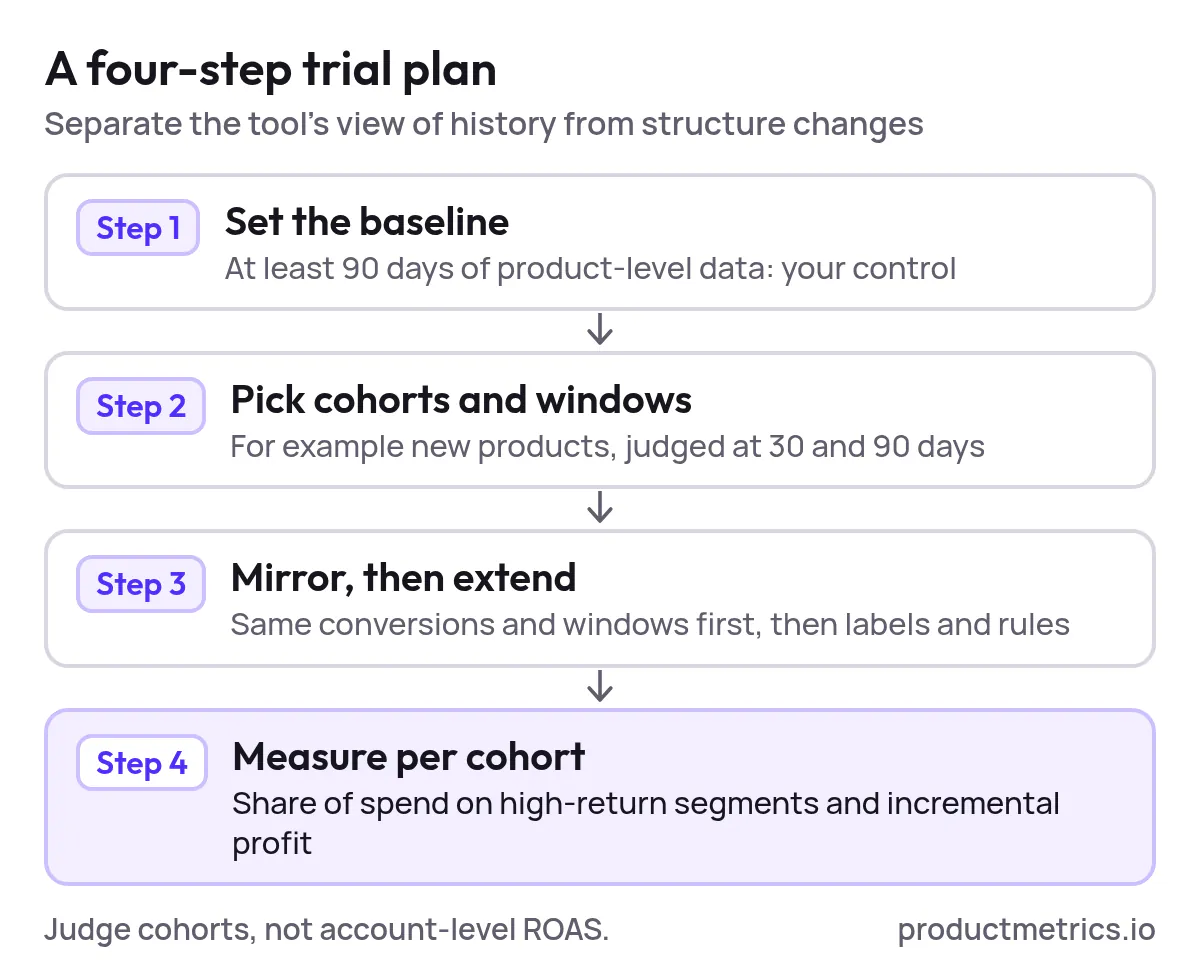
Step 1: Establish your historical baselines
From Google Ads and GA4, extract at least 90 days of data at product level:
- Impressions, clicks, cost, conversions and conversion value per product
- Existing ROAS and, if possible, POAS or contribution margin
- Time‑lag distributions and path data from attribution reports (Source: Google Ads Help – About attribution reports)
This is your control.
Step 2: Define your evaluation cohorts and windows
Choose a few high‑impact cohorts where you suspect historical mis‑measurement is hurting ROAS, for example:
- High‑margin but low‑volume products
- New products launched in the last 60 days
- Seasonal products whose payback often happens near the end of a 30‑day window
Set clear windows (e.g., 30 vs 90 days) for evaluating outcomes in each cohort.
Step 3: Configure the tool to mirror - then extend - your current setup
In the trial account, start by mirroring your current Smart Bidding setup:
- Same conversion actions and attribution model
- Same conversion windows
- Same campaign structure (Shopping vs PMax)
Then progressively layer in the tool’s capabilities:
- Product‑level segmentation and labels
- Cohort‑specific bidding rules or campaigns
- Profit and stock constraints
This sequence reveals whether lift comes from the tool’s view of history or just from structural changes you could have made yourself.
Step 4: Measure uplift where it actually matters
Don’t just look at account‑level ROAS.
For each evaluation cohort, track:
- Change in share of spend going to high‑return segments
- Reduction in spend on chronic under‑performers (products with persistent negative POAS)
- Incremental profit, not just incremental revenue
Overlay that with operational impact: how much faster can your team move from “data” to “action” compared to spreadsheets and native Google Ads reports?
6. Where Product Metrics Fits In This Landscape
Product Metrics is a good example of a platform built specifically around historical product‑level performance in Google Shopping and Performance Max.
From its own positioning:
- It connects Google Ads, Merchant Center and your ecommerce platform with GA4 as an optional input. (Source: Product Metrics – How it works)
- Machine learning segments products by click volume and ROAS/POAS against your target, placing every SKU into one of several performance segments.
- It layers in product journeys, competitor price benchmarks, margin data and inventory levels to explain why a product is performing the way it is, not just whether it’s “good” or “bad.” (Source: Product Metrics – Product Context)
- It writes back labels into Merchant Center so your Shopping and PMax campaigns can bid differently on each segment without maintaining complex feed rules. (Source: Product Metrics – Product Segmentation)
Crucially, Product Metrics is explicit that it is not an attribution tool; it lets Google’s own conversion tracking and Smart Bidding do their jobs, while making the product‑level use of that historical performance more intelligent and transparent. (Source: Product Metrics – FAQ)
If you’re looking for Google Shopping optimization tools that use historical performance to optimise ROAS, this is the kind of architecture to look for: one that starts from the data Google already has, enriches it with your own economics and stock, and turns that into product‑level cohorts and labels you can actually act on.
7. Bringing It All Together
When you strip away the buzzwords, a historically intelligent Google Shopping optimisation platform should do three things for a PPC specialist:
- Make your history legible - with clear product cohorts, lookback views and attribution‑aware metrics.
- Make it operational - by turning historical insights into labels, rules and campaign structures that Smart Bidding can use.
- Make it profitable - by aligning all of that with margin, stock and real business constraints, not just ad platform ROAS.
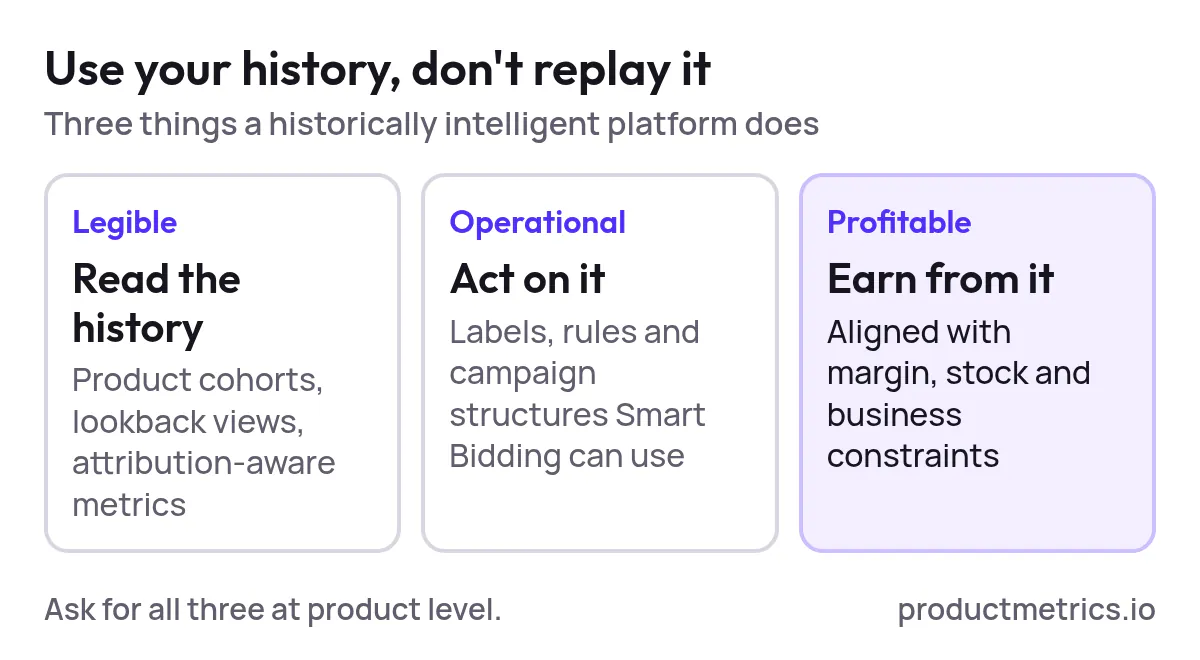
If a vendor can’t show you how they handle cohorts, lookback windows and attribution windows at product level, they’re not really using your history - they’re just replaying it.
The upside for teams that get this right is significant: fewer wasted clicks on chronic under‑performers, more budget behind historically proven profit drivers, and an account structure that works with Smart Bidding’s use of historical data instead of fighting it.
If you want to see this approach applied to your own catalog, consider running a structured trial with a product‑level platform like Product Metrics, using your last 90 days of Shopping and PMax data as the test bed. (Source: Product Metrics – Product-level Google Shopping optimisation)
Written by
Berend Vrakking, Founder of Product Metrics
1M+ products analysed · Nominated at the Dutch Search Awards for Best Measurement Campaign (2023) and Best Use of Data (2024)
Keep reading.
The 2026 Ecommerce ROAS Optimization Tools Landscape - How Performance Teams Evaluate, Pilot, and Scale
The 2026 ecommerce ROAS optimization tools landscape - how performance teams evaluate, pilot and scale Google Shopping tools with custom dashboards.
How to Build a Google Shopping ROAS Dashboard That Actually Moves Revenue: Templates, Metrics and Workflows
How to Build a Google Shopping ROAS Dashboard That Actually Moves Revenue: the metric stack, drilldowns, alerts and experiment log, with templates.
Best Tools For Google Shopping ROAS Optimization With Customizable Dashboards
Six Google Shopping ROAS dashboard tools scored on five criteria: Google Ads native, Product Metrics, Optmyzr, ProfitMetrics, Channable Insights and GoDataFeed.
See which of your products to push, fix or pause. Start with your own products, or a 30-second estimate.
Check one product first: work out its break-even ROAS in the calculator. Then see where all your products stand.
Questions, or want to spar about your products? Book a demo: a video call with Berend, then a demo account.