
Implementing Profit Segmentation In Google Shopping And Performance Max
Implementing profit segmentation in Google Shopping and Performance Max, step by step: margin bands, custom labels, campaigns and target ROAS.
Profit in eCommerce rarely tracks perfectly with revenue. Two products can generate the same sales but very different margin, and if your Google Shopping and Performance Max campaigns treat them the same, you end up scaling the wrong products.
This guide walks through how to set up profit segmentation for Google Shopping campaigns and Performance Max step by step:
- Enriching your product feed with margin data
- Labelling products by profit in Google Merchant Center
- Structuring campaigns and asset groups around margin bands
- Adjusting bids and budgets using simple decision trees
- Managing targets across seasons and promotions
Use it as a practical playbook you can implement in a day or two, then refine as data builds.
1. What Is Profit Segmentation In Google Shopping?
Profit segmentation means structuring your Shopping and Performance Max setup so that:
- Products with high margins get more aggressive bids and budget
- Products with thin margins get stricter efficiency targets
- You can see performance by profit band, not just by category or brand
Instead of only optimizing for ROAS on revenue, you get closer to optimizing for POAS (profit on ad spend) and absolute profit.
In practice, profit segmentation usually involves:
- Defining margin bands (e.g., High / Medium / Low / Clearance)
- Labelling each product with its band using custom labels in your Merchant Center feed
- Building campaigns, asset groups, and bid strategies around those labels
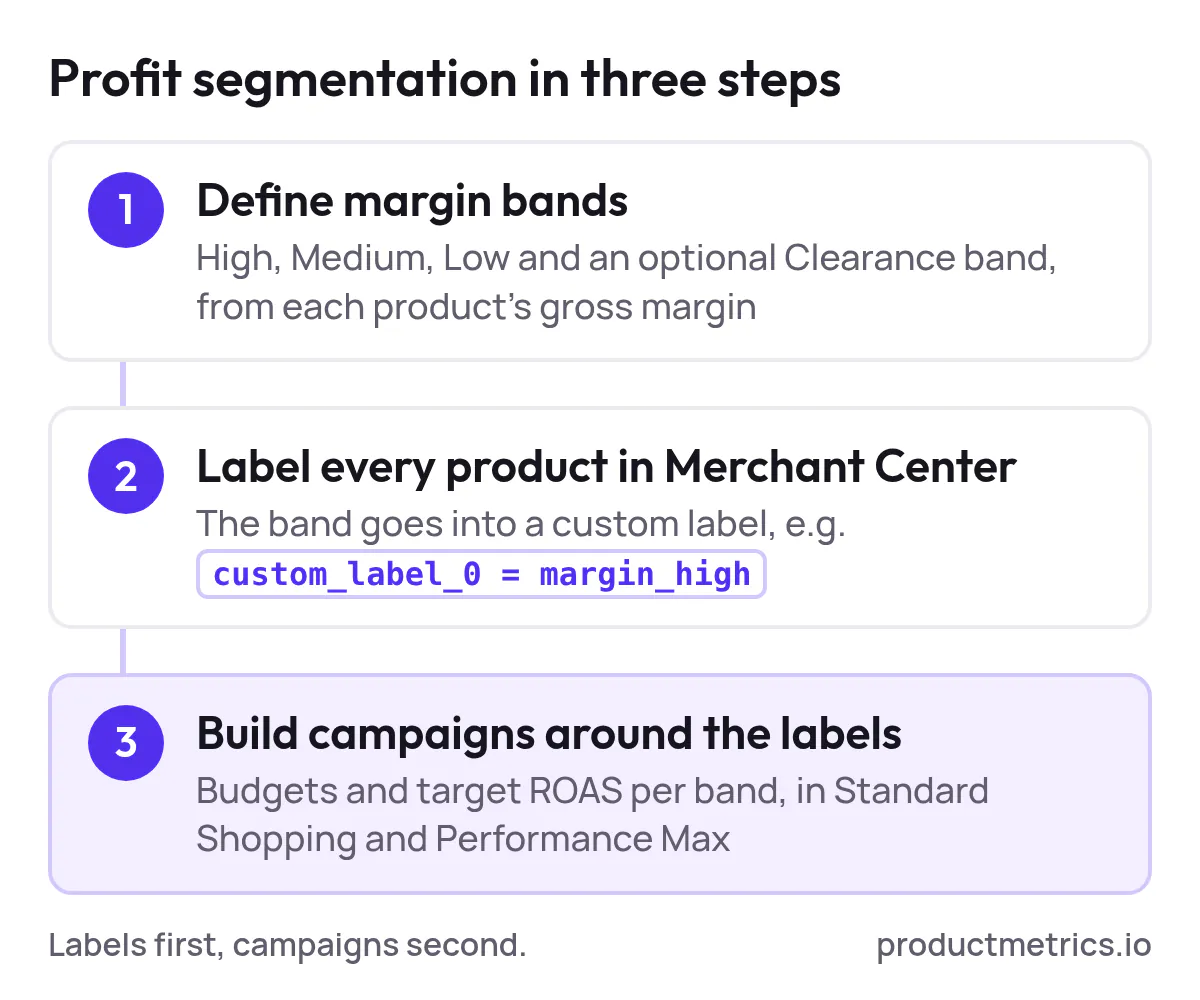
The rest of this guide details how to do each step.
2. Prerequisites: Data And Access You’ll Need
Before touching Google Ads, make sure you have:
- A product list with IDs that match Merchant Center (id / item_id)
- Price information (current selling price, and ideally sale price where relevant)
- Cost of goods sold (COGS) or per‑SKU margins from your ERP, finance, or inventory system
- Admin or edit access to:
- Google Merchant Center (feeds, feed rules, supplemental feeds)
- Google Ads (Shopping & Performance Max campaigns)
- A way to work with data (Google Sheets, Excel, or a data warehouse/BI tool)
If you don’t have exact COGS at the SKU level yet, you can start with approximate margin by category or brand, then refine later.
3. Step 1 - Define Your Profit Model And Margin Bands
You cannot optimize for profit until you’re clear on what “good” looks like in dollars.
3.1 Calculate Product Level Margin
For each product, calculate at least one of these:
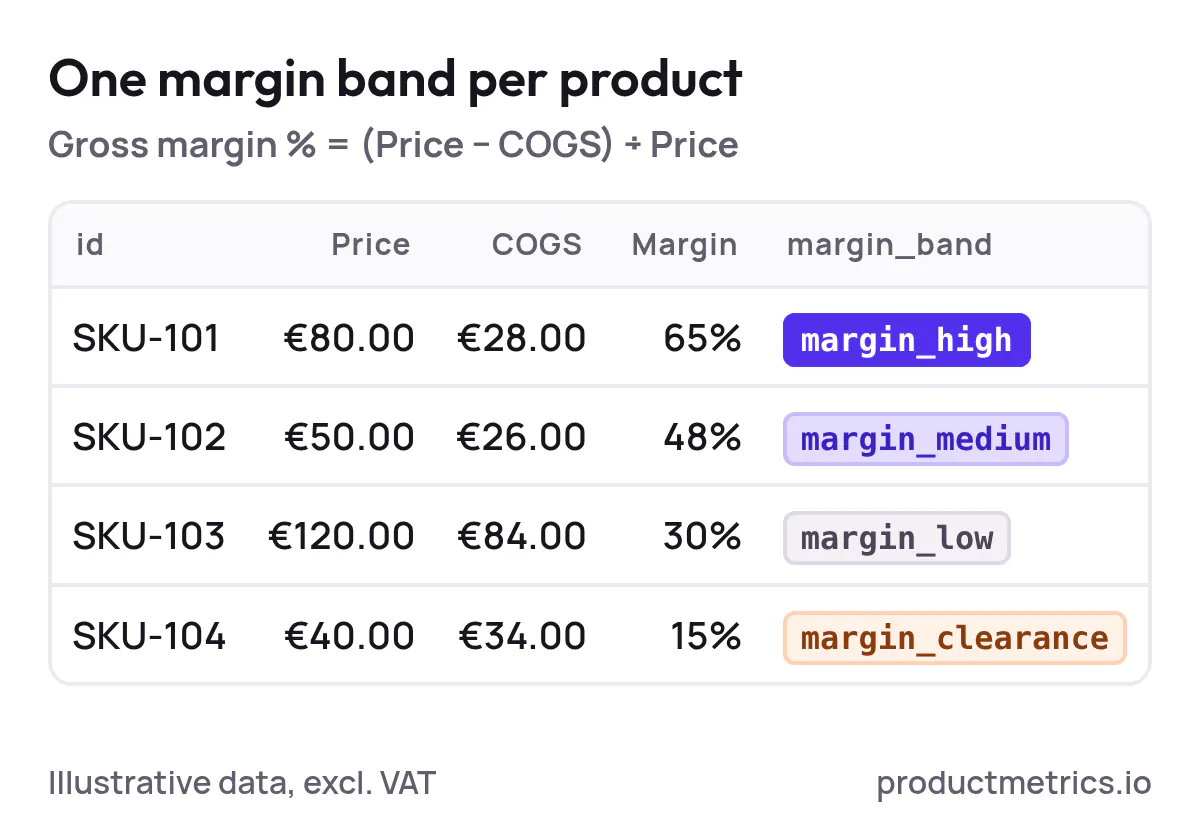
- Gross margin % = (Price − COGS) ÷ Price
- Gross profit per unit = Price − COGS
Work in whichever metric your finance team already uses. The important part is consistency.
3.2 Create Margin Bands
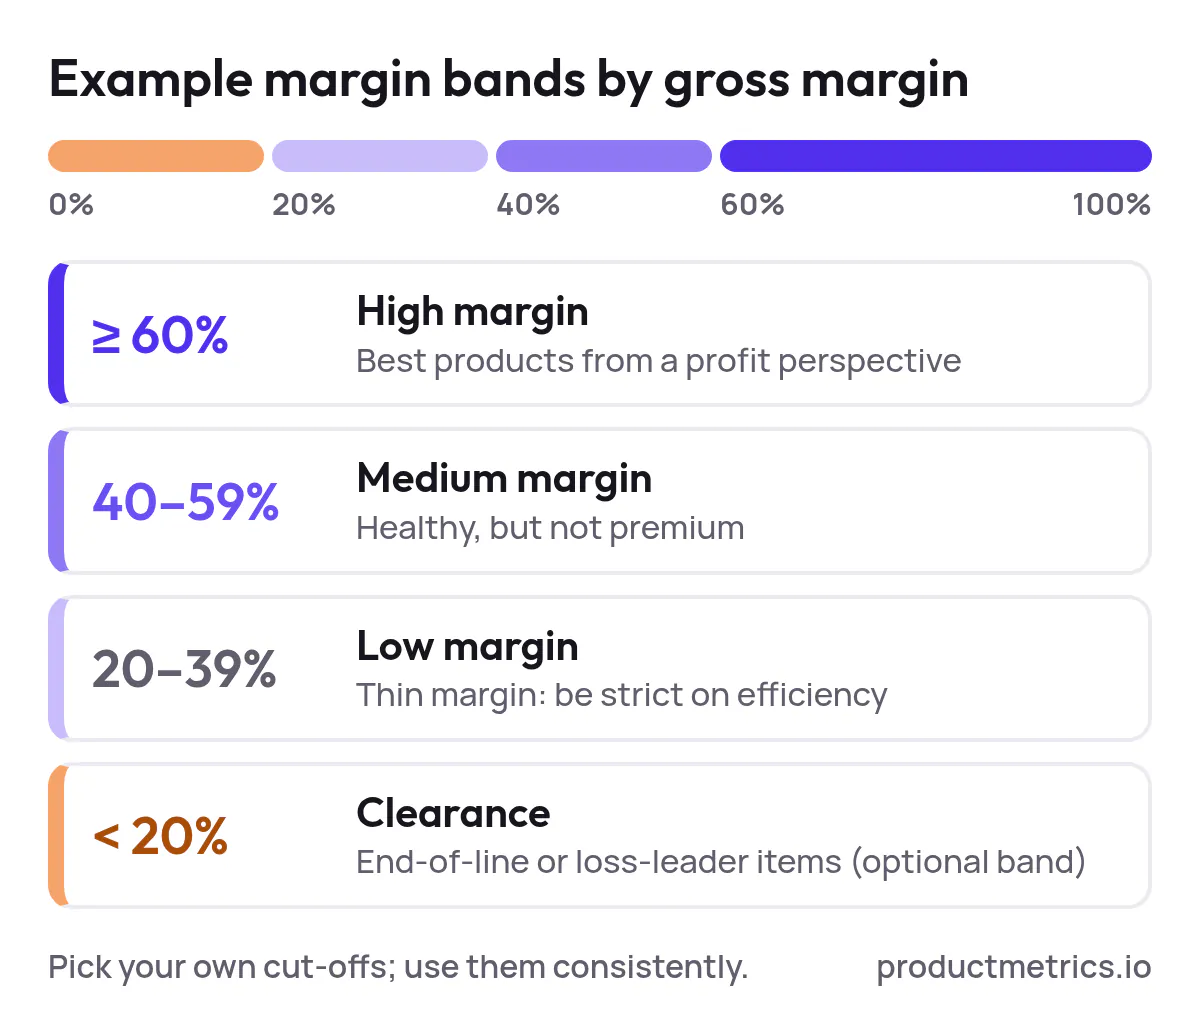
Decide on 3–4 margin bands you care about. A simple structure:
- High margin – Your best products from a profit perspective
- Medium margin – Healthy but not premium margin
- Low margin – Thin margin products where you must be strict on efficiency
- Clearance / Negative (optional) – End‑of‑line or loss‑leader items
You can define thresholds however you like. For example:
- High margin: ≥ 60%
- Medium margin: 40–59%
- Low margin: 20–39%
- Clearance: < 20%
The exact cutoffs are less important than using them consistently across the catalog.
3.3 Assign A Margin Band To Every Product
In your spreadsheet or data tool:
- Add a column, e.g.,
margin_band. - Use a formula or case expression to assign each SKU to one band.
- Sanity‑check that:
- No product is unassigned
- The distribution looks reasonable (e.g., not 95% of products in one band)
You’ll soon push this margin_band into Merchant Center as a custom label.
4. Step 2 - Label Products By Profit In Google Merchant Center
The core of profit segmentation is labelling products by margin in your Merchant Center feed so Google Ads can filter and bid on them.
You do this through custom labels (custom_label_0–custom_label_4). A common convention:
custom_label_0=margin_band(High / Medium / Low / Clearance)- Other custom labels can later handle seasonality or lifecycle.
There are three main implementation paths.
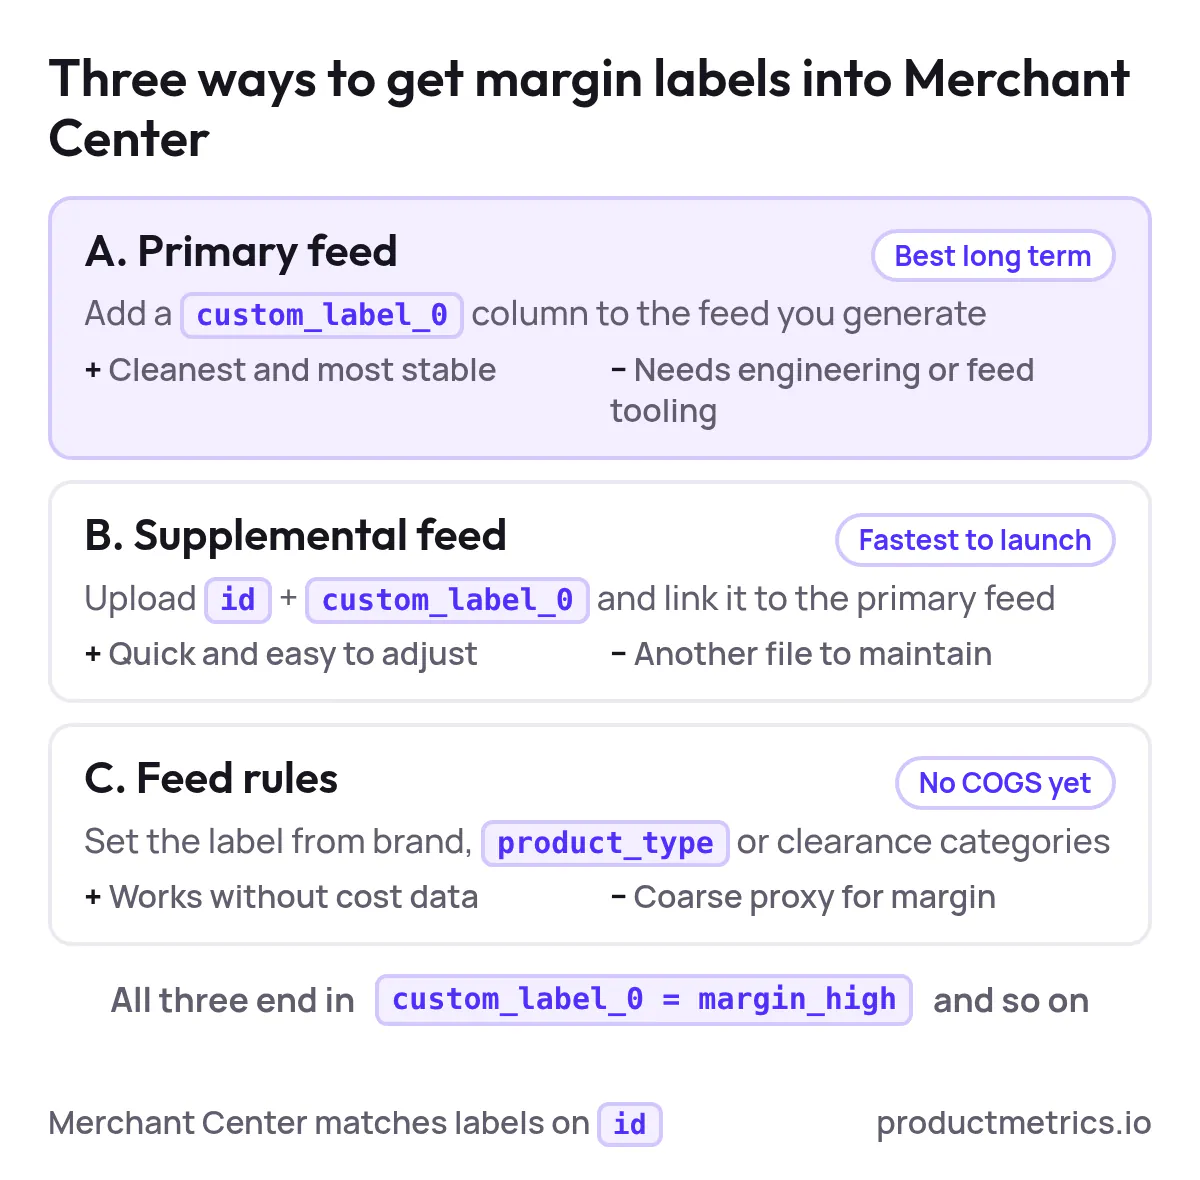
4.1 Option A - Add Margin Labels To Your Primary Feed (Best Long Term)
If you own the primary feed (API, XML, or scheduled file), extend it to include a column, for example:
- Column header:
custom_label_0 - Cell values:
margin_high,margin_medium,margin_low,margin_clearance
High level steps:
- Join your margin_band data to your product export by product ID.
- Map
margin_bandtocustom_label_0strings. - Update your primary feed generation logic to include that column.
- Re‑upload or let the scheduled fetch run.
- In Merchant Center, confirm that
custom_label_0is populated across a sample of products.
Pros: Cleanest and most stable. Cons: Requires engineering or feed tooling changes.
4.2 Option B - Use A Supplemental Feed (Fastest To Launch)
If changing the main feed is slow, a supplemental feed is a good bridge.
- Export two columns:
idandcustom_label_0from your margin spreadsheet. - In Merchant Center, create a new supplemental feed.
- Upload the file and link it to your primary feed.
- Merchant Center will match on
idand attach thecustom_label_0values to those products.
Pros: Quick to implement and easy to adjust. Cons: Another file to maintain.
4.3 Option C - Use Feed Rules For Coarse Profit Proxies
If you don’t have COGS yet, you can still approximate margin using proxies, for example:
- Certain brands with known high margins
- Product types that always have thin margins
- Clearance categories
In Merchant Center, use feed rules to set custom_label_0 based on existing fields:
- If
product_typecontainsClearance→custom_label_0 = margin_clearance - If
brand=PremiumBrand→custom_label_0 = margin_high
You can refine later once proper margin data is available.
5. Step 3 - How To Set Up Profit Segmentation For Standard Google Shopping Campaigns
Once products are labelled, you can structure Shopping around those labels.
5.1 Recommended Campaign Structure By Margin
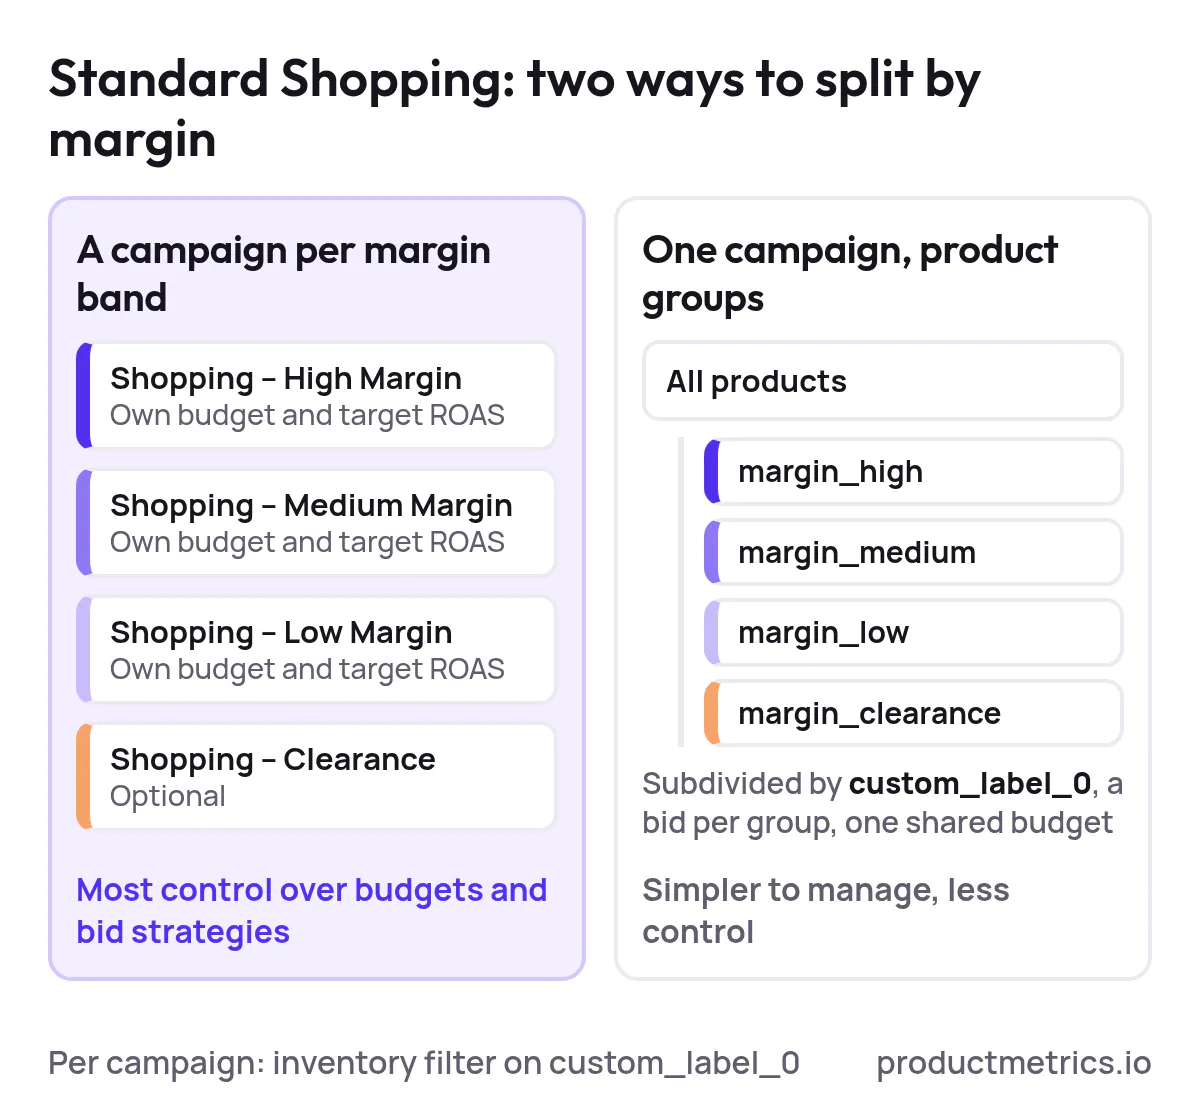
The clearest approach is separate campaigns per margin band:
Shopping – High MarginShopping – Medium MarginShopping – Low MarginShopping – Clearance(optional)
Each campaign includes only products from its band and can have its own:
- Daily budget
- Bid strategy (manual CPC or Smart Bidding)
- Target ROAS or CPA
5.2 Create A High Margin Shopping Campaign (Template)
For each band, repeat these steps; example below for high margin.
- Create a new Standard Shopping campaign in Google Ads.
- In the campaign’s Settings → Additional settings → Inventory filter, add a condition:
custom_label_0 = margin_high
- Name the campaign clearly (e.g.,
US | Shopping | Margin High). - Choose your bid strategy:
- If you have enough conversions (e.g., 30+ in 30 days), use Maximize conversion value with target ROAS.
- Otherwise, start with manual CPC or Maximize clicks with a max CPC cap, then move to Smart Bidding later.
- Set a more aggressive budget than your other bands, as this is where you’re comfortable pushing.
- Inside the campaign, refine product groups further by:
- Brand
- Category / product_type
- Item ID for top sellers
Repeat for medium and low margin campaigns, changing the inventory filter to the relevant custom_label_0 value.
5.3 Alternative: One Campaign, Product Groups By Margin
If you prefer fewer campaigns, you can keep a single Shopping campaign and split by margin at the product group level:
- Start from the default
All productsgroup. - Subdivide by
custom_label_0. - Set different bids for each margin band product group.
This is simpler to manage but gives you less control over budgets and bid strategies than truly separate campaigns.
6. Step 4 - How To Segment Performance Max By Product Margin
Performance Max is more consolidated by design, but you can still segment it around margin.
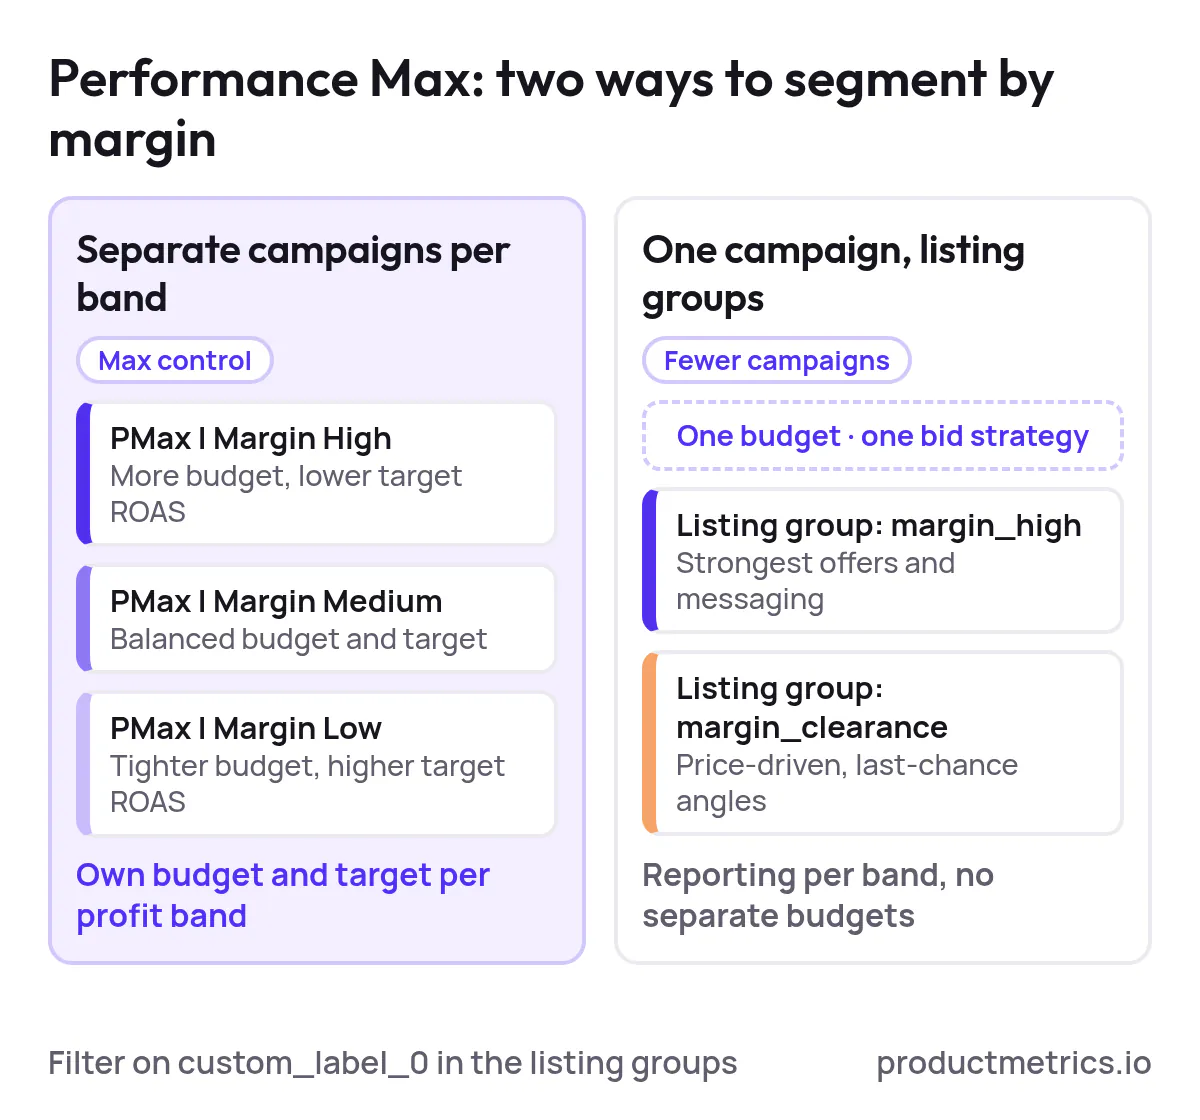
You have two main options: separate campaigns by margin or single campaign with listing groups by margin.
6.1 Option A - Separate Performance Max Campaigns By Margin (Max Control)
This mirrors the Standard Shopping approach and is usually best when profit really matters.
For each band (High / Medium / Low):
- Duplicate your existing PMax campaign as a starting point.
- In the new campaign, go to the asset group’s Listing groups.
- Set a filter so the campaign only includes products where:
custom_label_0 = margin_high(for example)
- Rename the campaign clearly (e.g.,
US | PMax | Margin High). - Assign a budget and bid strategy:
- High margin: more budget and a lower target ROAS (more aggressive)
- Low margin: tighter budget and a higher target ROAS (more conservative)
- Repeat for each margin band.
This gives you separate budgets and targets per profit band, which is hard to achieve in one shared campaign.
6.2 Option B - Single Performance Max Campaign, Listing Groups By Margin
If you prefer one PMax campaign:
- Keep a single PMax campaign.
- In each asset group, configure Listing groups to segment by
custom_label_0. - Tailor creatives and audiences per band:
- High margin: strongest offers, more aggressive messaging
- Clearance: price‑driven messaging, “last chance” angles
All margin bands will still share the same budget and bid strategy, but you gain reporting by listing group and can at least understand how each band behaves.
7. Step 5 - How To Adjust Bids Based On Profit Segmentation In Google Shopping
Once campaigns are live, the real value comes from systematic bidding workflows. Below are simple decision trees you can apply weekly.
7.1 Define Targets By Margin Band
For each margin band, agree on:
- A minimum acceptable POAS (profit ÷ ad spend)
- A proxy ROAS target you’ll use in Google Ads
Example (you should customize this):
- High margin: willing to accept lower ROAS because profit per sale is high
- Medium margin: balanced ROAS and volume
- Low margin: strict ROAS, or even only break‑even on ads
Map those business rules to Google Ads settings:
- High margin → lower target ROAS or higher manual CPCs
- Low margin → higher target ROAS or lower manual CPCs

Show the dataHide the data
| Margin band (lowest gross margin) | Break-even target ROAS |
|---|---|
| High (60%) | 167% |
| Medium (40%) | 250% |
| Low (20%) | 500% |
7.2 Decision Tree For Smart Bidding (Target ROAS)
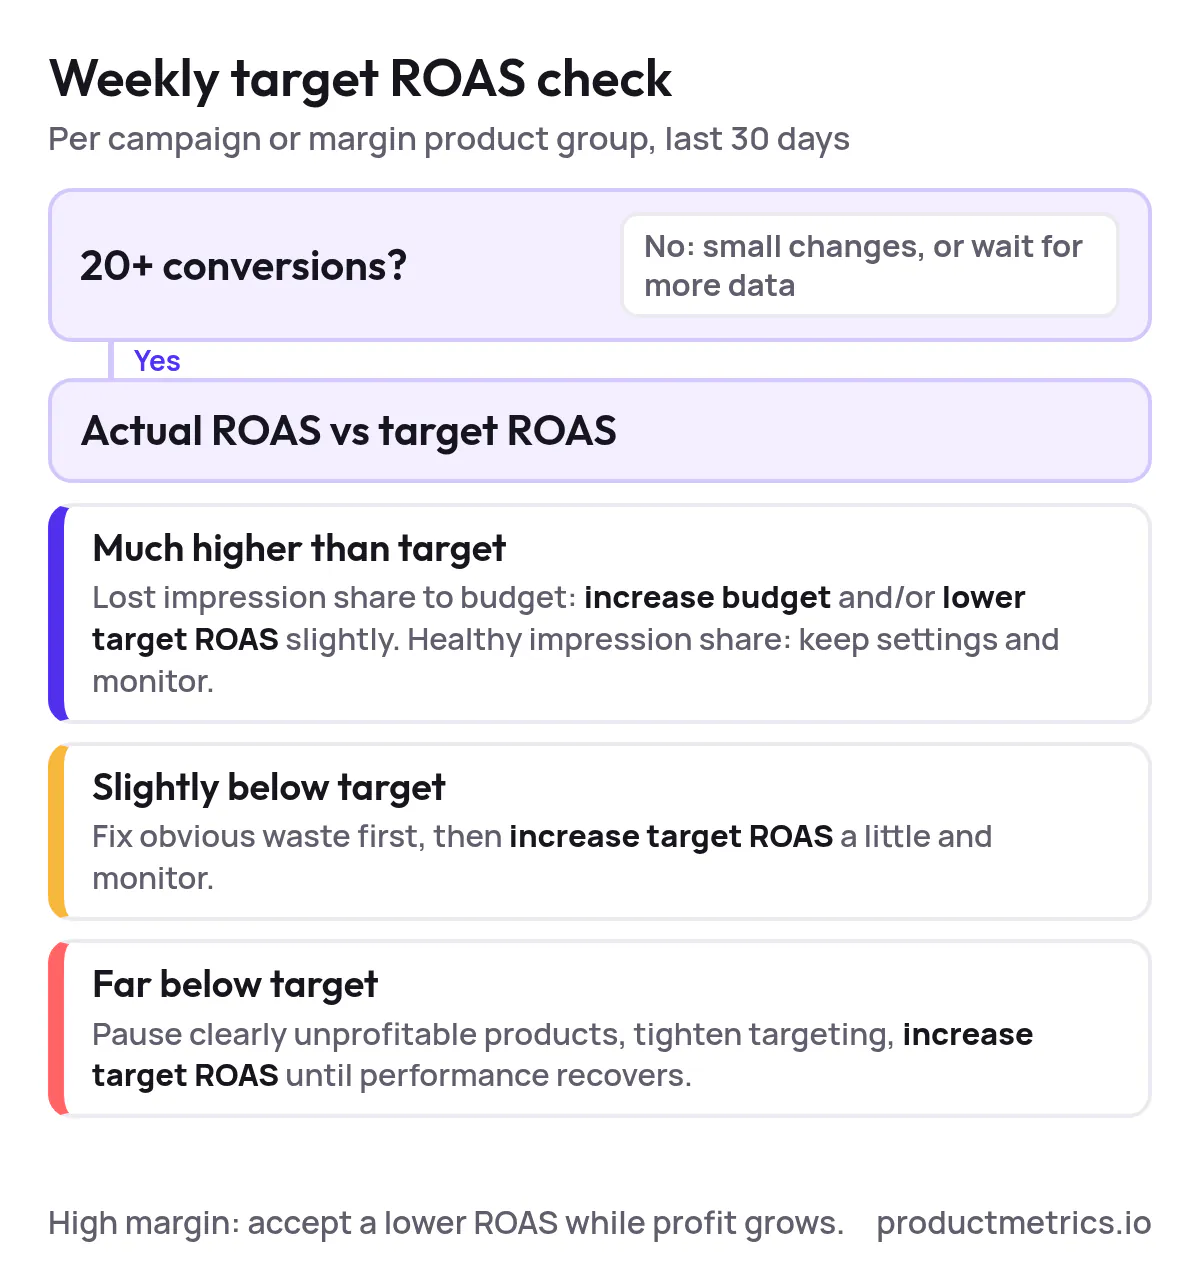
Do this analysis per campaign or margin product group, looking at the last 30 days.
- Is there enough data?
- Fewer than ~20 conversions: make small changes or wait for more data.
- 20+ conversions: proceed.
- Compare actual vs target ROAS:
- Actual ROAS much higher than target:
- If impression share is limited by budget, increase budget and/or lower target ROAS slightly to push volume.
- If impression share is healthy, keep settings and monitor.
- Actual ROAS slightly below target:
- First fix obvious waste (irrelevant search terms, disapproved products, bad pages).
- Then raise target ROAS a bit (make the algorithm more conservative) and monitor.
- Actual ROAS far below target:
- Pause clearly unprofitable products in that band.
- Tighten targeting (negatives in Standard Shopping, or audience signals and listing groups in PMax).
- Increase target ROAS and consider lowering bids or budgets until performance improves.
- Actual ROAS much higher than target:
Always respect the margin context:
- In high margin, tolerate lower ROAS as long as absolute profit grows.
- In low margin, prioritize efficiency even if volume drops.
7.3 Decision Tree For Manual CPC
If you’re still on manual bidding:
- For each margin band product group, pull Cost, Conversions, Revenue, and ROAS.
- For each group:
- Profitable and limited by impression share / lost IS (budget):
- Increase bids by a small step (e.g., 10–15%).
- Borderline profitable:
- Reduce bids slightly (e.g., 5–10%) and review again next cycle.
- Consistently unprofitable:
- Cut bids aggressively, exclude the product group, or move those SKUs into a stricter “low margin” or “clearance” setup.
- Profitable and limited by impression share / lost IS (budget):
Over time, aim to migrate mature segments onto Smart Bidding once conversion volumes are sufficient.
8. Step 6 - Managing Budgets And Targets Across Seasons
Profitability is highly seasonal. Use your margin labels together with seasonality labels to manage this.
8.1 Add A Seasonality Label
Reserve another custom label for seasonality, e.g.:
custom_label_1 = season_peak,season_off,season_clearance
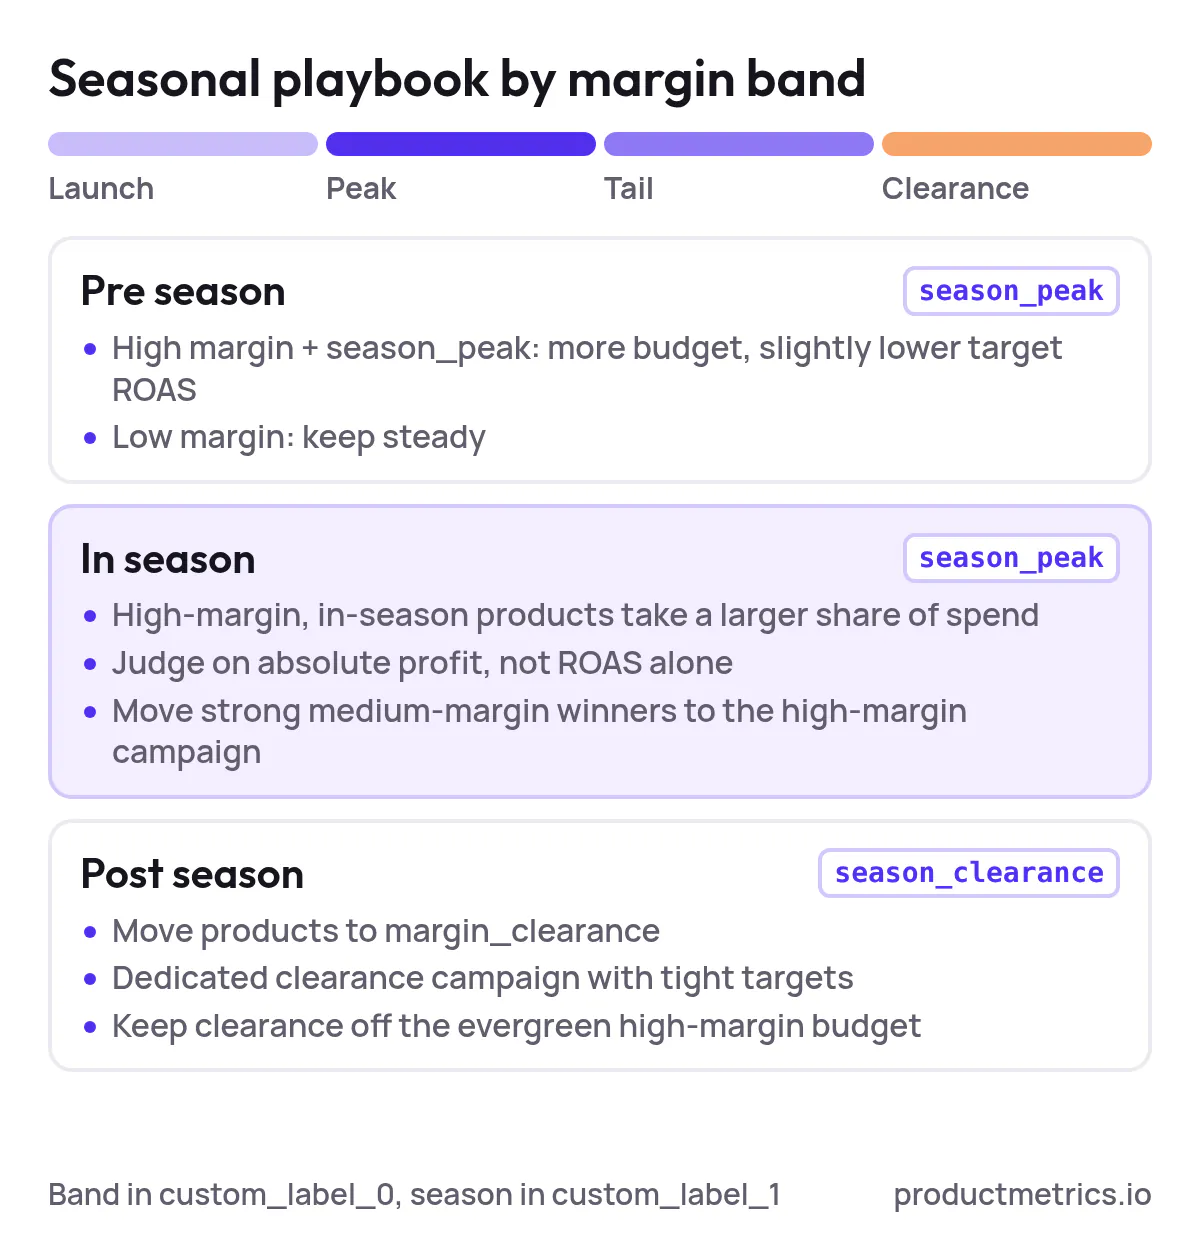
Update this label as products move through their lifecycle (launch → peak → tail → clearance).
8.2 Seasonal Playbook By Margin Band
Pre season (before peak demand):
- Increase budgets and slightly relax ROAS targets for high‑margin + season_peak products.
- Keep low‑margin items steady unless they are critical to assortment.
In season (peak weeks):
- Let high‑margin, in‑season SKUs take a larger share of spend.
- Monitor absolute profit, not just ROAS — it’s often worth accepting a lower ROAS here if profit dollars rise.
- Consider moving some medium‑margin winners into the high‑margin campaign if their realized profit is strong.
Post season / clearance:
- Shift relevant SKUs to
margin_clearanceandseason_clearance. - Create or maintain a dedicated clearance campaign with very tight ROAS targets or low CPCs.
- Avoid letting clearance items consume the same budget as evergreen high‑margin SKUs.
This combination of margin band + seasonality gives you fine‑grained control without creating hundreds of campaigns.
9. Step 7 - Reporting ROAS Vs POAS And Finding Unprofitable Products
To know if profit segmentation is working, you need reporting that goes beyond standard ROAS.
9.1 Product Level ROAS Vs POAS
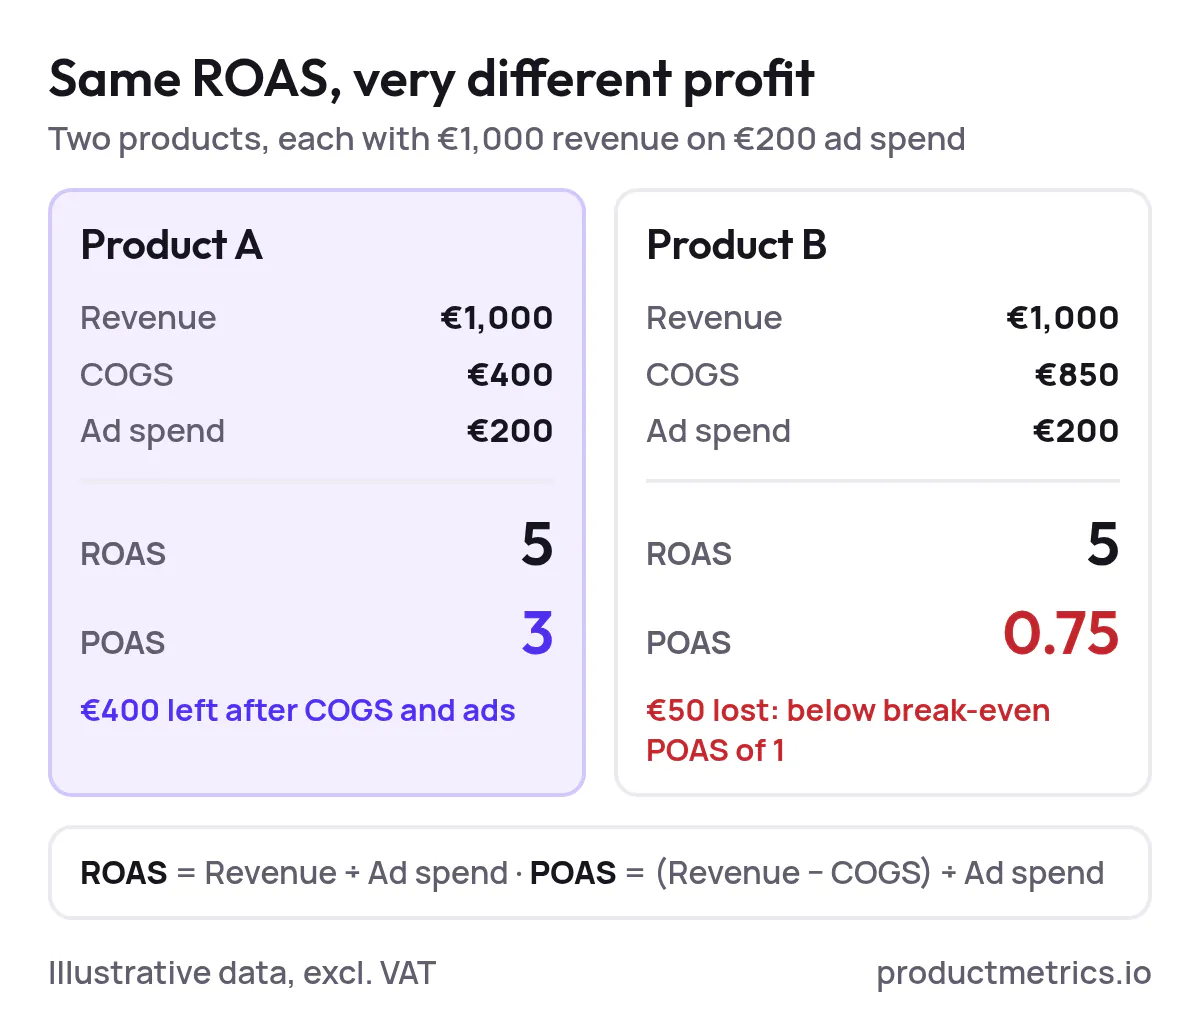
ROAS is based on revenue, while POAS is based on profit:
- ROAS = Revenue ÷ Ad spend
- POAS = Profit ÷ Ad spend = (Revenue − COGS) ÷ Ad spend
Once you have COGS joined to Google Ads product performance, you can compute product‑level POAS and identify SKUs that look fine on ROAS but bad on actual profit.
A simple implementation path:
- Export product performance from Google Ads (by item ID or item ID + campaign).
- Join it to your margin/COGS table on product ID.
- Calculate POAS and profit per click/order.
- Flag products that:
- Have good ROAS but poor POAS (hidden margin issues)
- Consume a lot of spend with negative profit
Use these insights to:
- Down‑bid or exclude unprofitable SKUs.
- Promote under‑exposed but highly profitable SKUs with stronger bids.
9.2 Metrics To Track By Margin Segment
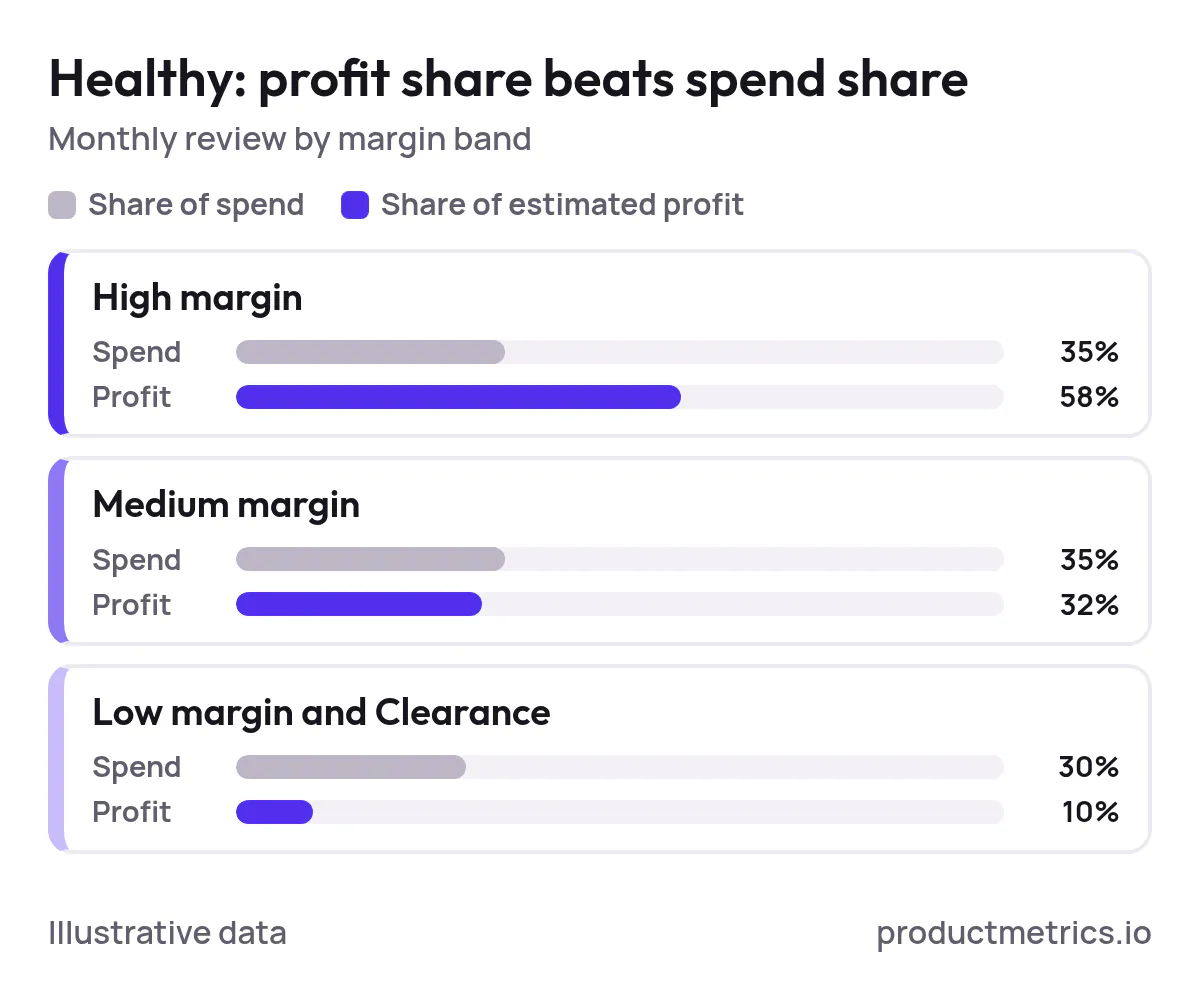
At least monthly, review these by margin band (High / Medium / Low / Clearance):
- Spend
- Revenue
- Estimated profit (using your margin assumptions)
- ROAS and POAS
- Conversions and conversion rate
- Impression share and impression share lost to budget
Healthy profit segmentation means:
- High‑margin bands drive a disproportionate share of profit, not just spend
- Low‑margin and clearance bands are controlled and not silently draining budget
10. FAQs And Common Pitfalls
10.1 How Many Profit Segments Should I Start With?
Start simple with three bands (High / Medium / Low). Add a fourth Clearance band once your process is stable. Too many bands up front create noise and thin out your data.
10.2 How To Label Products By Profit In Google Merchant Center If I Don’t Have COGS?
Use proxies for a first pass:
- Map known premium brands or categories to
margin_high - Map low‑priced, commodity products to
margin_low - Use
margin_clearancefor anything in outlet/clearance sections
As soon as you can, replace these proxies with actual COGS‑based margin bands.
10.3 Should I Exclude Low Margin Products From Performance Max?
Not automatically. Many low‑margin products are important for:
- Entry‑level orders and first‑time customers
- Bundles and cross‑sells
Instead of blanket exclusions:
- Put them into a separate low‑margin PMax or Shopping campaign with strict ROAS/POAS targets
- Limit their budgets and let high‑margin campaigns take the lead
10.4 Do I Need Exact Per SKU Margins To Start?
No. You can start with category‑ or brand‑level estimates, then refine:
- Launch with rough bands
- Watch which segments and SKUs drive most profit
- Improve your margin data for those highest‑impact areas first
10.5 How Do I Evaluate Whether Profit Segmentation Is Working?
Compare periods before and after implementation on:
- Overall profit from Shopping + PMax
- Share of spend on high‑margin vs low‑margin bands
- Number of clearly unprofitable SKUs still getting spend
Improvement in any of these is a strong signal you’re moving in the right direction, even if top‑line ROAS remains similar.
11. Implementing Profit Segmentation Faster With ProductMetrics.io
Everything in this guide can be done manually with exports and spreadsheets, but it quickly becomes hard to maintain across thousands of SKUs, multiple markets, and fast‑changing prices.
ProductMetrics.io can help you:
- Bring together product, cost, and performance data
- Keep profit labels up to date as prices and costs change
- Monitor which segments and SKUs are actually driving profit, not just revenue
If you want a structured rollout of profit segmentation for Google Shopping and Performance Max, including data modelling and campaign design, reach out to the ProductMetrics team to discuss your setup and goals.
Written by
Berend Vrakking, Founder of Product Metrics
1M+ products analysed · Nominated at the Dutch Search Awards for Best Measurement Campaign (2023) and Best Use of Data (2024)
Keep reading.
Campaign Segmentation in Google Shopping - Principles, Pitfalls, and Governance
Campaign segmentation in Google Shopping - principles, pitfalls and governance for Shopping and Performance Max structures that keep enough data to learn.
Evaluating Product Group Relevance In Google Shopping: Measurement Frameworks, Benchmarks And Tooling
Evaluating product group relevance in Google Shopping: score each group on structure, performance and intent, benchmark it and decide what to split.
The 2026 Buyer’s Guide to Google Shopping Campaign Segmentation Platforms (Product Group Relevance, Performance, and Automation)
The 2026 Buyer’s Guide to Google Shopping Campaign Segmentation Platforms: a test-forward, procurement-ready framework for PPC specialists.
See which of your products to push, fix or pause. Start with your own products, or a 30-second estimate.
Check one product first: work out its break-even ROAS in the calculator. Then see where all your products stand.
Questions, or want to spar about your products? Book a demo: a video call with Berend, then a demo account.