
The Profit Segmentation Playbook For Google Shopping: From ROAS To POAS
The profit segmentation playbook for Google Shopping from ROAS to POAS: group products by margin, break-even ROAS and POAS, then label and test each group.
Google Shopping and Performance Max optimise on the numbers you feed them. If those numbers only see revenue, not margin, your best-looking campaigns can hide unprofitable products.
Profit segmentation fixes that. You group products by their economics – margin, break-even ROAS, POAS and stock – and then give each group the budget, bid target and treatment it can afford.
This playbook defines profit segmentation, explains how it relates to ROAS and POAS, and gives you testable frameworks you can apply in both Standard Shopping and Performance Max.
What you’ll get from this guide
- A working definition of profit segmentation for Google Shopping and PMax
- Decision rules for when and how to split campaigns by profit
- Three practical segmentation frameworks you can A/B test
- A measurement plan that moves you from ROAS-only to POAS and true profit
1. What Is Profit Segmentation In Google Shopping?
Profit segmentation is the practice of structuring your Shopping and Performance Max campaigns so that products are grouped, bid and budgeted based on profit, not just revenue.
At product level, that means working with:
- Contribution margin: revenue minus cost of goods and variable order costs such as shipping, payment fees and returns. (Source: Product Metrics – POAS meaning)
- POAS (profit on ad spend): contribution profit before advertising divided by ad spend; POAS of 1.0 is break-even. (Source: Product Metrics – POAS vs ROAS)
- Break-even ROAS per product: 1 ÷ contribution margin; a 30% margin breaks even at a ROAS of 3.33, a 50% margin at 2. (Source: Product Metrics – Break-even ROAS per product)

Show the dataHide the data
| Contribution margin | Break-even ROAS |
|---|---|
| 30% margin | 3.33 |
| 50% margin | 2 |
In the campaign layer, profit segmentation shows up as:
- Custom labels in Merchant Center that tag each product with a margin band, POAS tier or segment. (Source: Google Ads Help – Use custom labels for Shopping ads)
- Product groups (Standard Shopping) or listing groups (PMax) that include or exclude products based on those labels. (Source: Google Merchant Center Help – custom_label_0–4)
- Separate campaigns only where needed – for example, high - margin products that can afford a lower target ROAS than low - margin ones.
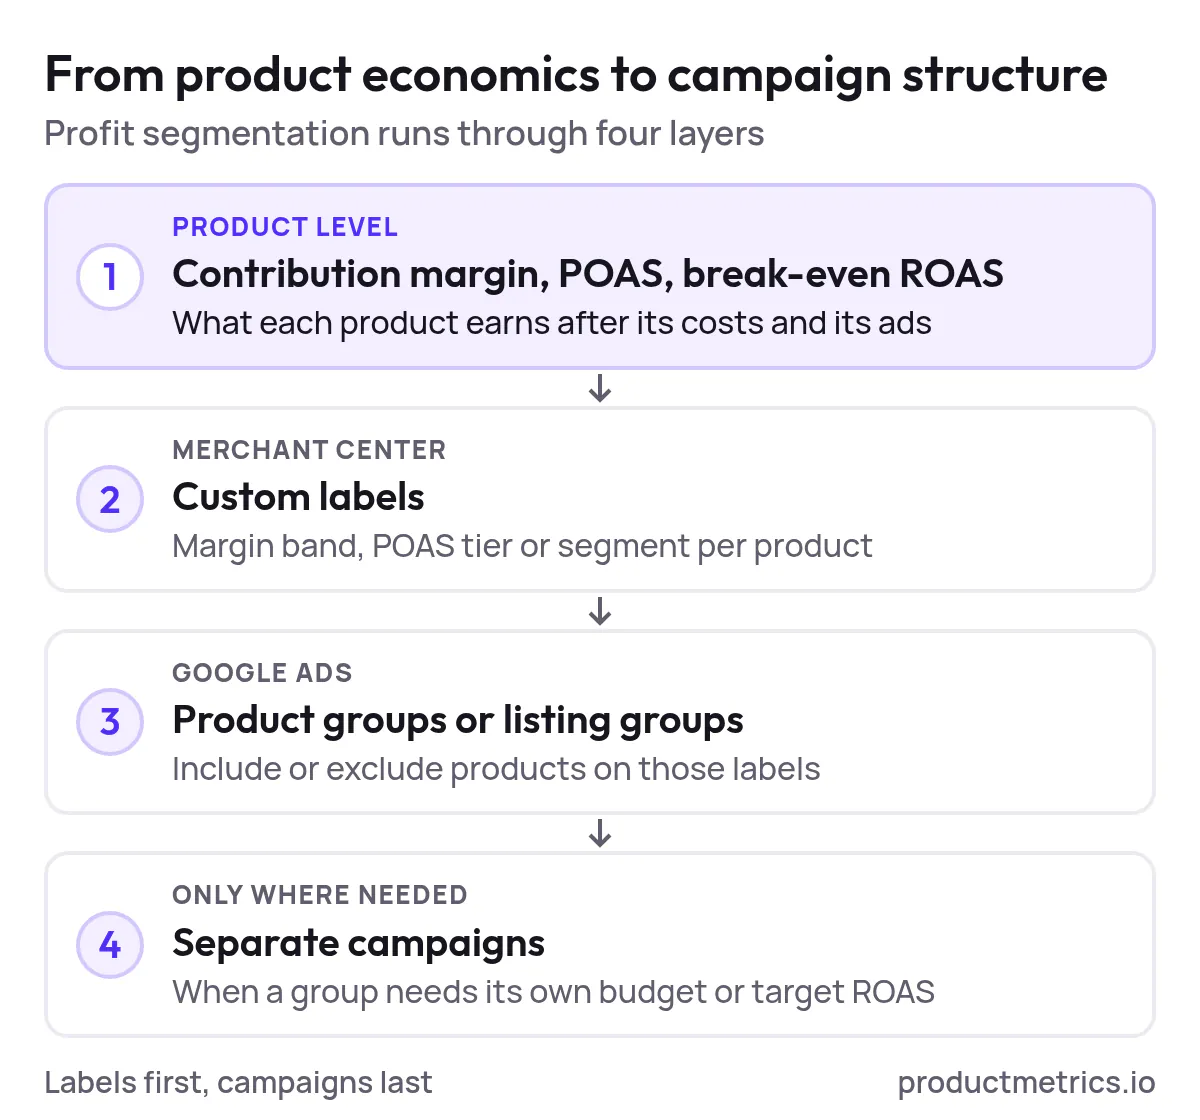
Done well, profit segmentation answers three questions your account-level ROAS cannot:
- Which products earn more profit than they cost after ads?
- Which products deserve more budget at a lower target ROAS because their margin is high?
- Which products should be paused, excluded or pushed to lower priority until economics change?
2. From ROAS To POAS: Why Revenue Segmentation Stops Being Enough
Most Google Shopping accounts still optimise on ROAS: revenue ÷ ad spend. That ratio says nothing about what the products cost to sell. (Source: Product Metrics – ROAS vs ROI)
Two products can both sit at a ROAS of 4:
- Product A with a 50% margin has a POAS of 2.0.
- Product B with a 20% margin has a POAS of 0.8.
Same ROAS, opposite profit stories. POAS makes the difference visible because it multiplies ROAS by contribution margin:
POAS = ROAS × contribution margin
For a given ROAS, lower margin means lower POAS.

Show the dataHide the data
| Product | POAS at a ROAS of 4 |
|---|---|
| Product A, 50% margin | 2 |
| Product B, 20% margin | 0.8 |
That is why Product Metrics starts with ROAS and switches to POAS as soon as you connect margins, so every product can be read against a POAS break-even of 1.0. (Source: Product Metrics – MER vs ROAS, POAS, ROI and nCAC)
Profit segmentation is how you turn that metric shift into campaign structure:
- Break-even ROAS per product tells you whether a shared ROAS target hides loss-making SKUs.
- POAS by product tells you which products earn contribution after ads and which drain it.
- Margin bands tell you how aggressively each group can afford to be bid.
3. Best Strategies For Profit Segmentation In Google Shopping Campaigns
Across Standard Shopping and Performance Max, the most effective profit segmentation techniques fall into four broad strategies:
- Segment by margin bands first. Group products into high - medium and low - margin tiers using custom labels, then give each tier the ROAS or POAS target it can afford.
- Overlay performance tiers. Within each margin band, separate products that already beat their break-even from those that do not.
- Respect stock and lifecycle. Avoid pouring budget into low-stock or clearance products, even if their margin is high.
- Escalate from labels to campaigns only when the decision changes. Keep one campaign where products still share a commercial objective and target. Split only when a group needs a different budget target or treatment. (Source: Product Metrics – Shopping and PMax structure by profit)
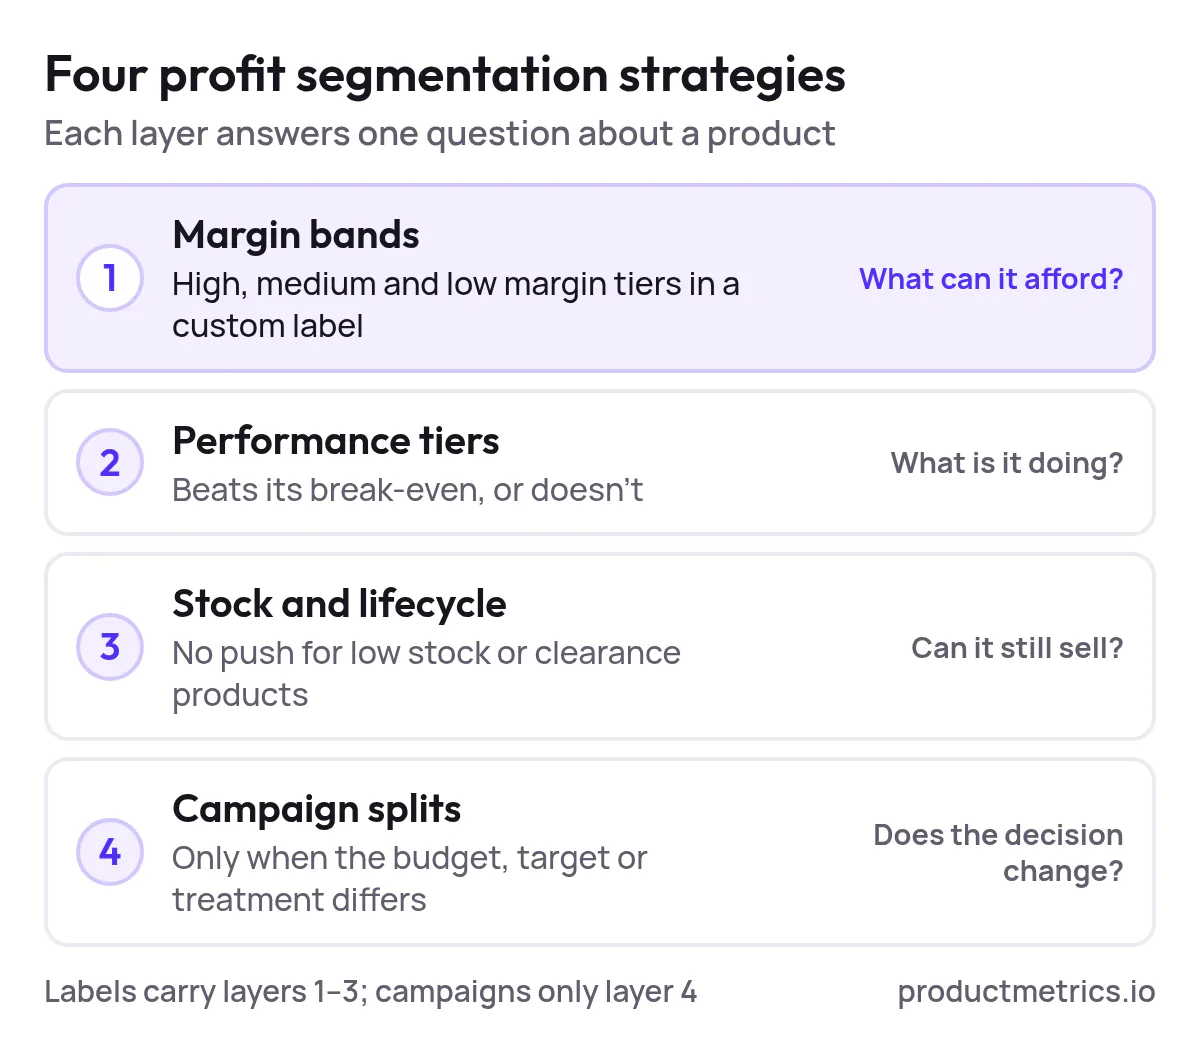
The rest of this guide turns those strategies into concrete testable frameworks.
4. The Building Blocks: Data, Metrics And Labels
Before you change any campaigns, check that three foundations are in place.
4.1 Get Contribution Margin Per Product
You need at least an approximate contribution margin by SKU or product type:
- Net revenue excl. tax
- Minus cost of goods sold (COGS)
- Minus variable order costs (shipping payment fees expected returns)
That is the definition Product Metrics uses for POAS and break-even ROAS. (Source: Product Metrics – POAS meaning)
If you cannot get margin per SKU yet, start with broader bands:
- Category-level or brand-level margins where products are similar
- Manual overrides for known outliers (e.g. house brands vs marketplace brands)
You can refine to product-level margins later; do not wait for perfect data before running your first tests.
4.2 Choose A Primary Profit Metric
You do not have to abandon ROAS. Instead:
- Use break-even ROAS per product to decide whether a shared ROAS target is realistic.
- Use POAS per product to decide which SKUs deserve more or less budget at that target.
Product Metrics documents the break-even ROAS formula as 1 ÷ contribution margin and shows how dividing a product’s ROAS by its break-even ROAS gives you its POAS. (Source: Product Metrics – Break-even ROAS per product)
If you prefer to express everything in POAS, the break-even is always 1.0, which often makes decision rules easier to read.
4.3 Put Profit Into Merchant Center Via Custom Labels
Google Merchant Center exposes five custom label fields, custom_label_0 through custom_label_4, which you can fill with your own values such as margin tier or bestseller status. (Source: Google Merchant Center Help – custom_label_0–4)
Google Ads then lets you subdivide product groups (Standard Shopping) or listing groups (PMax) on those labels. (Source: Google Ads Help – Use custom labels for Shopping ads)
A simple profit-focused label plan might reserve slots as follows:
custom_label_0– margin band (e.g.margin_lowmargin_midmargin_highmargin_exclude)custom_label_1– performance tier (e.g.poas_above_targetpoas_near_targetpoas_below_target)custom_label_2– stock band (e.g.stock_lowstock_okstock_high)
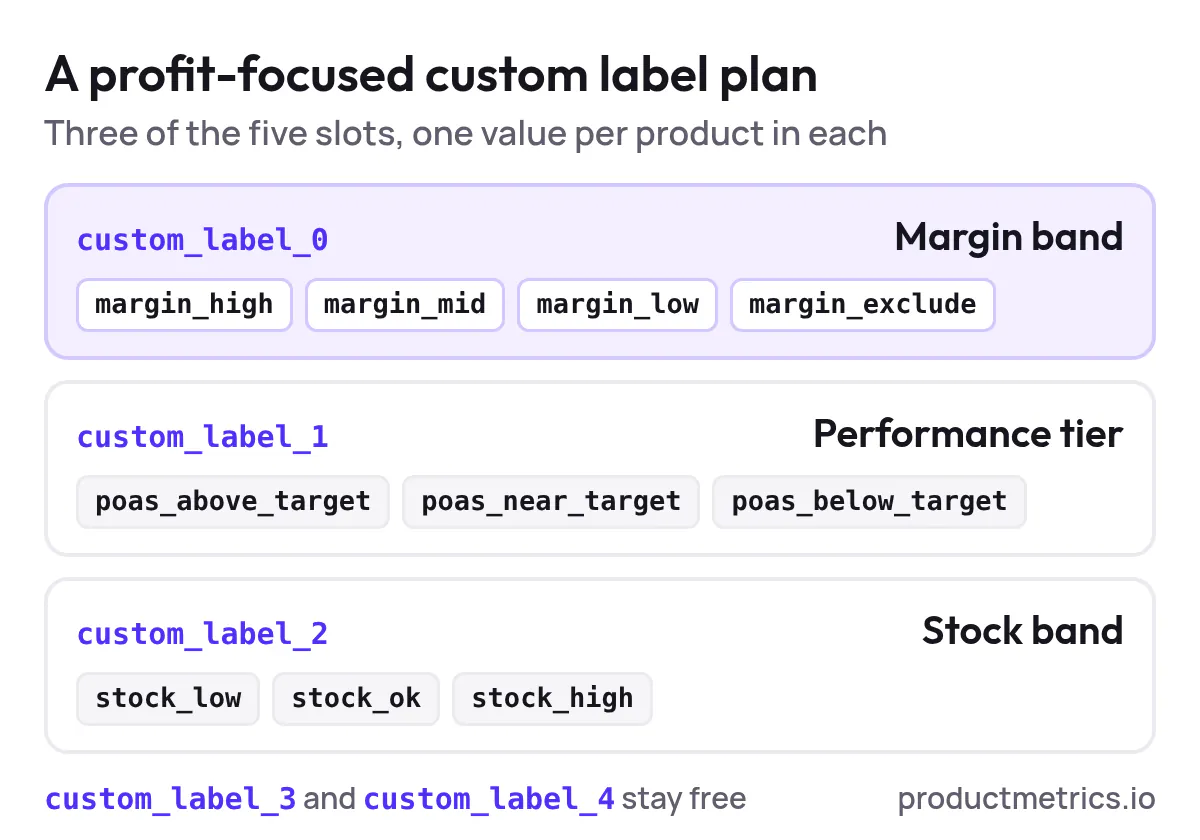
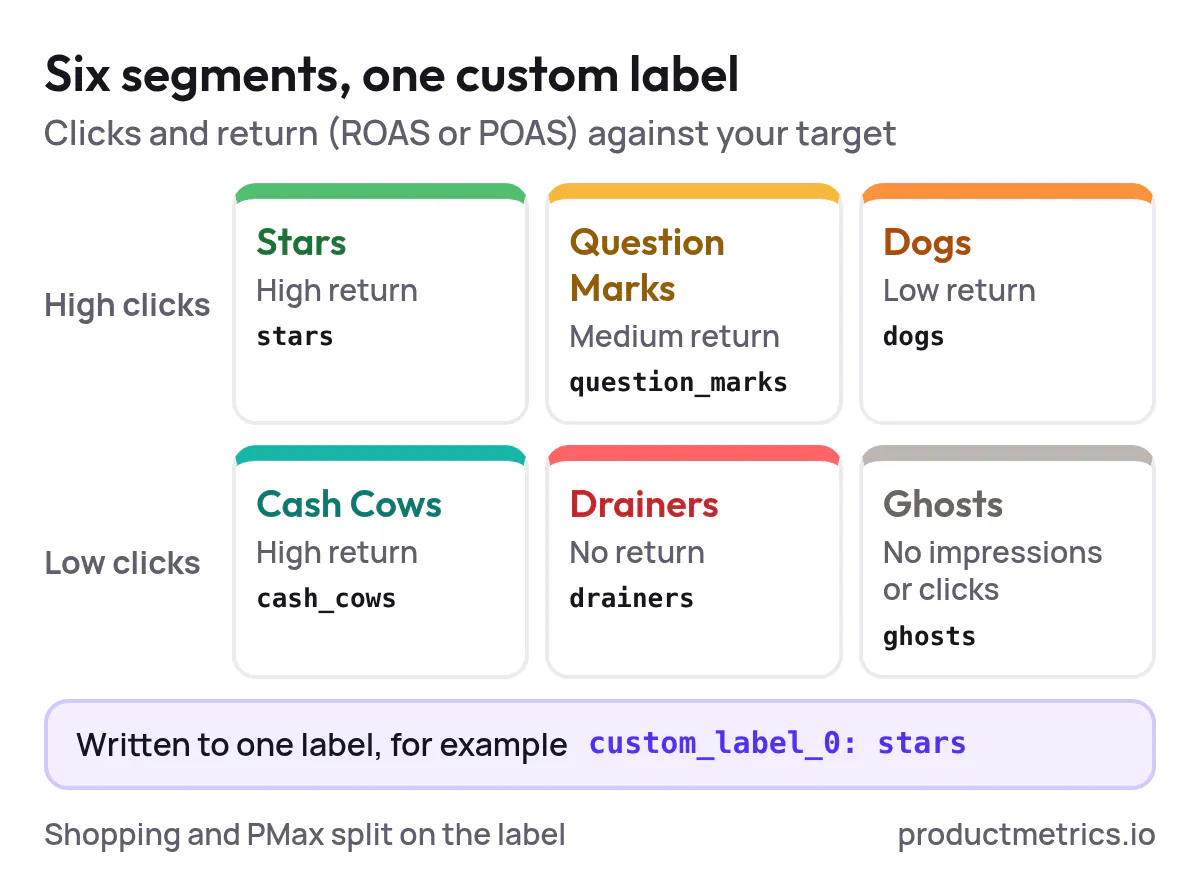
Product Metrics’ Product Segmentation feature already writes six performance segments (Stars Question Marks Cash Cows Dogs Drainers Ghosts) to a chosen custom label so Shopping and PMax campaigns can split on them. (Source: Product Metrics – ML Product Segmentation)
5. Framework 1 – Margin-Band Profit Segmentation (Standard Shopping)
This is the lowest-friction way to improve profit margins through campaign segmentation in Google Shopping.
5.1 Define Your Margin Bands
Start with three or four tiers that reflect your catalogue:
- Tier A – High margin. Products whose contribution margin is well above your shop average.
- Tier B – Medium margin. Most of your core products.
- Tier C – Low margin. Thin-margin or price-matched SKUs.
- Optional: Tier D – Exclude. Products you never want to advertise at scale (e.g. loss leaders or marketplace SKUs with no margin).
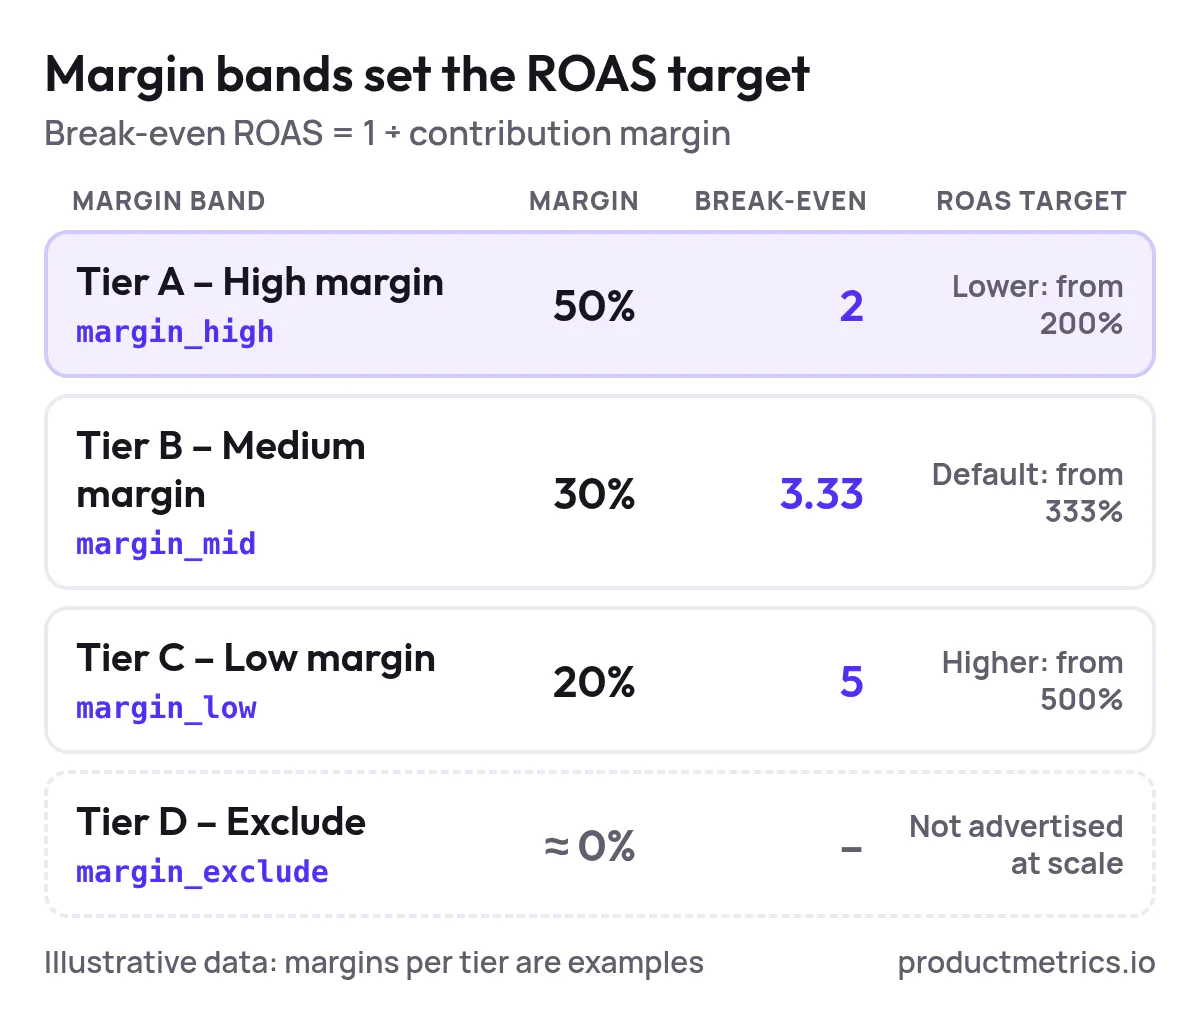
Many feed practitioners recommend mapping these bands into a custom label so campaigns can filter on them rather than trying to encode them only in ROAS targets. (Source: Cart.com – Advanced feed optimisation tactics)
5.2 Label Products In The Feed
Populate a margin label in Merchant Center or your PIM/feed tool:
- Add a margin band field per product.
- Map it into, for example,
custom_label_0. - Check in Merchant Center that the processed products show the expected label values.
Google’s own documentation uses margin as a core example for custom labels and shows how a Margin label can distinguish low - and high - margin items. (Source: Google Ads Help – Use custom labels for Shopping ads)
5.3 Restructure Product Groups
In your Standard Shopping campaigns:
- On the Product groups page, subdivide by
custom_label_0(margin band). - Set separate ROAS targets or bid adjustments per band:
- Tier A can often afford a lower ROAS target or relatively higher CPC.
- Tier C may need a higher ROAS target or lower CPC to stay profitable.
- Keep one campaign to start with; you only need separate campaigns if a band warrants its own budget or bid strategy.
This structure turns a single blended performance view into a view where you can see spend ROAS and POAS per margin tier then adjust bids or targets accordingly.
5.4 How To Test It
To run an A/B-style test:
- Pick one country or category where volume is healthy.
- Run the old unsegmented structure and the new margin-banded structure in parallel on different product sets.
- Hold your overall budget steady and compare POAS and profit per product after a full conversion window.
If you use Product Metrics, you can read Stars Dogs and Drainers per band rather than per account and see whether spend shifts towards products above a POAS of 1.0. (Source: Product Metrics – Product Segmentation)
6. Framework 2 – POAS And Performance Tiers: Profit-Driven Product Groups
Margin bands say what a product could afford. Performance tiers say what it is actually doing.
You can segment Google Shopping campaigns for higher profits by combining both.
6.1 Define POAS-Based Tiers
Using your product-level reporting (native or via a tool):
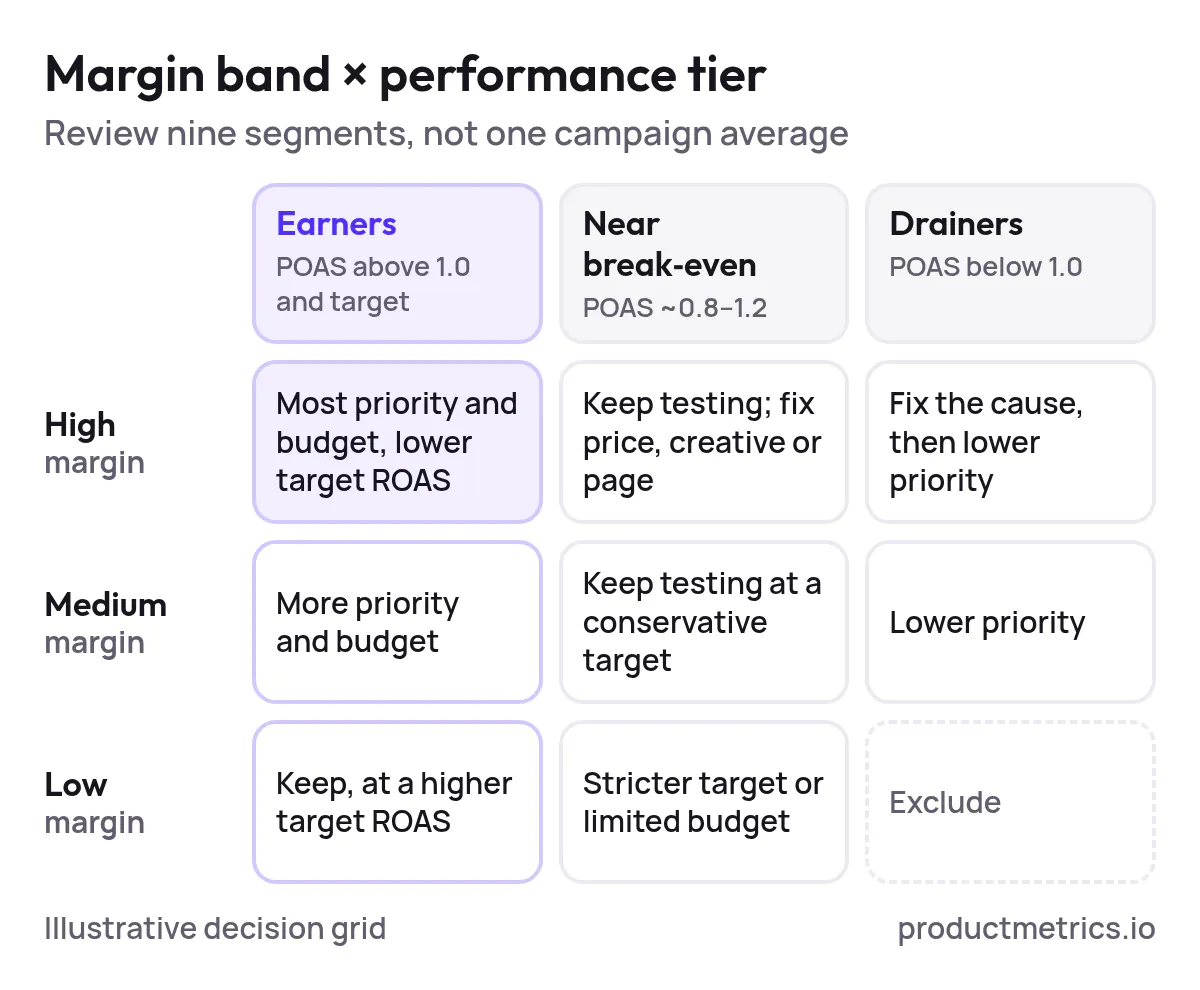
- Earners – products with POAS comfortably above 1.0 and above your long - term target.
- Near break-even – products with POAS between ~0.8 and 1.2.
- Drainers – products with POAS persistently below 1.0 with meaningful spend.
Product Metrics’ six standard segments are an example of this kind of tiering based on clicks and return (ROAS or POAS). (Source: Product Metrics – Product Segmentation marketing)
6.2 Apply Tiers As Labels
You can:
- Use an internal process or script to tag products in a supplemental feed as
poas_abovepoas_nearpoas_belowincustom_label_1. - Or let a segmentation tool write the performance segment to a custom label for you.
Either way, the aim is the same: to see and control budget per performance tier not just per campaign.
6.3 Use Performance Tiers To Set Priority And Bids
Within each margin band from Framework 1:
- Earners can receive higher priority and more budget.
- Near break-even products stay in test with conservative targets until you fix price creatives or landing pages.
- Drainers are candidates for exclusion lower bids or structural changes.
Standard Shopping gives you direct control over product group bids and negatives so you can be quite precise without exploding the number of campaigns. Product Metrics’ Google Shopping optimisation guide shows how to layer these checks product by product. (Source: Product Metrics – How to optimise Google Shopping ads product by product)
7. Framework 3 – Profit Segmentation In Performance Max
Performance Max encourages advertisers to put everything in one campaign but the underlying mechanics still respect product-level labels and listing groups.
Google’s documentation confirms that custom labels can be used to filter and subdivide product sets in Performance Max just as in Shopping. (Source: Google Merchant Center Help – custom_label_0–4)
7.1 Start With Listing Groups, Not More Campaigns
Before you create new PMax campaigns, use listing groups within existing campaigns:
- In your retail PMax campaign, open the asset group.
- Edit the listing group to subdivide by your margin label (e.g.
custom_label_0). - Check that high - and low - margin products now sit in distinct groups.
This gives you reporting by margin tier without diluting data across multiple campaigns.
Specialist PMax guides consistently recommend using feed labels like margin tier inside a small number of campaigns before splitting by campaign so that each split retains enough conversions to optimise well. (Source: Mearchy – Segment Performance Max by margin not by category)
7.2 When To Split PMax Campaigns By Profit
Create separate Performance Max campaigns by profit segment when:
- A group of products needs a clearly different ROAS or POAS target.
- You want to ring-fence budget for high - margin or high - POAS SKUs.
- Volume is high enough that each campaign will still see meaningful conversions.
For example:
- Campaign A – high - margin products with proven POAS above 1.0; lower target ROAS.
- Campaign B – core products at average margin; your default target.
- Campaign C – low - margin or experimental products; stricter target or limited budget.
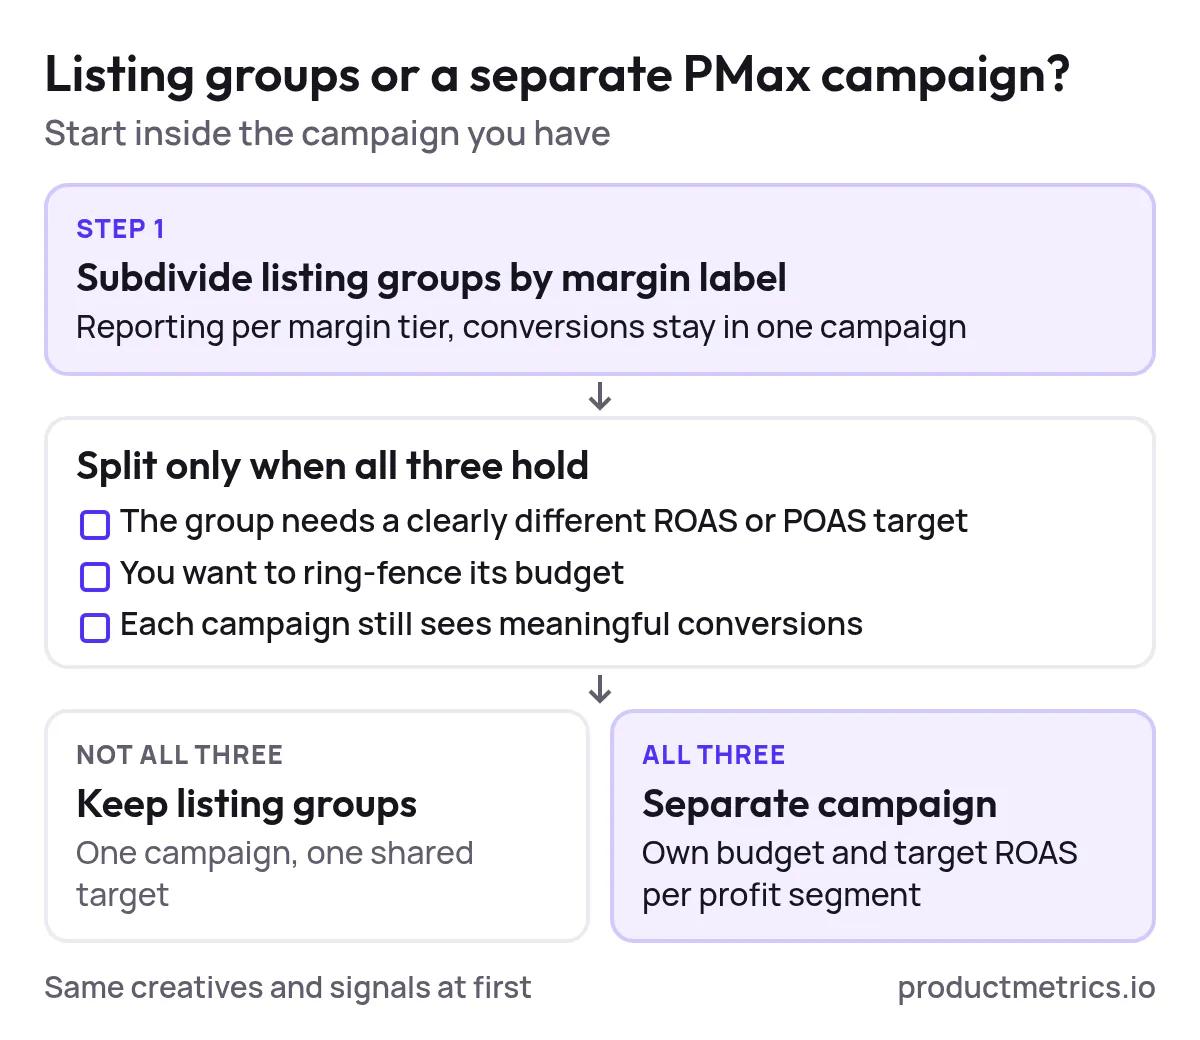
Retail PPC teams and tooling vendors increasingly recommend this kind of margin-based PMax split grounded in custom labels rather than only in categories. (Source: Adquadrant – How DTC brands structure Performance Max)
7.3 Excluding Unprofitable Products By Profit
Performance Max for ecommerce now supports profit-aware exclusions using product-level profit metrics and labels. Product Metrics’ dedicated PMax profit guide walks through how to cut spend on Drainers and low - margin products while keeping coverage on Stars. (Source: Product Metrics – Performance Max for Ecommerce: Exclude Products by Profit)
Combined with conversions with cart data (see below) this lets you align PMax with profit rather than only revenue.
8. Measurement: From ROAS-Only To Profit Segmentation
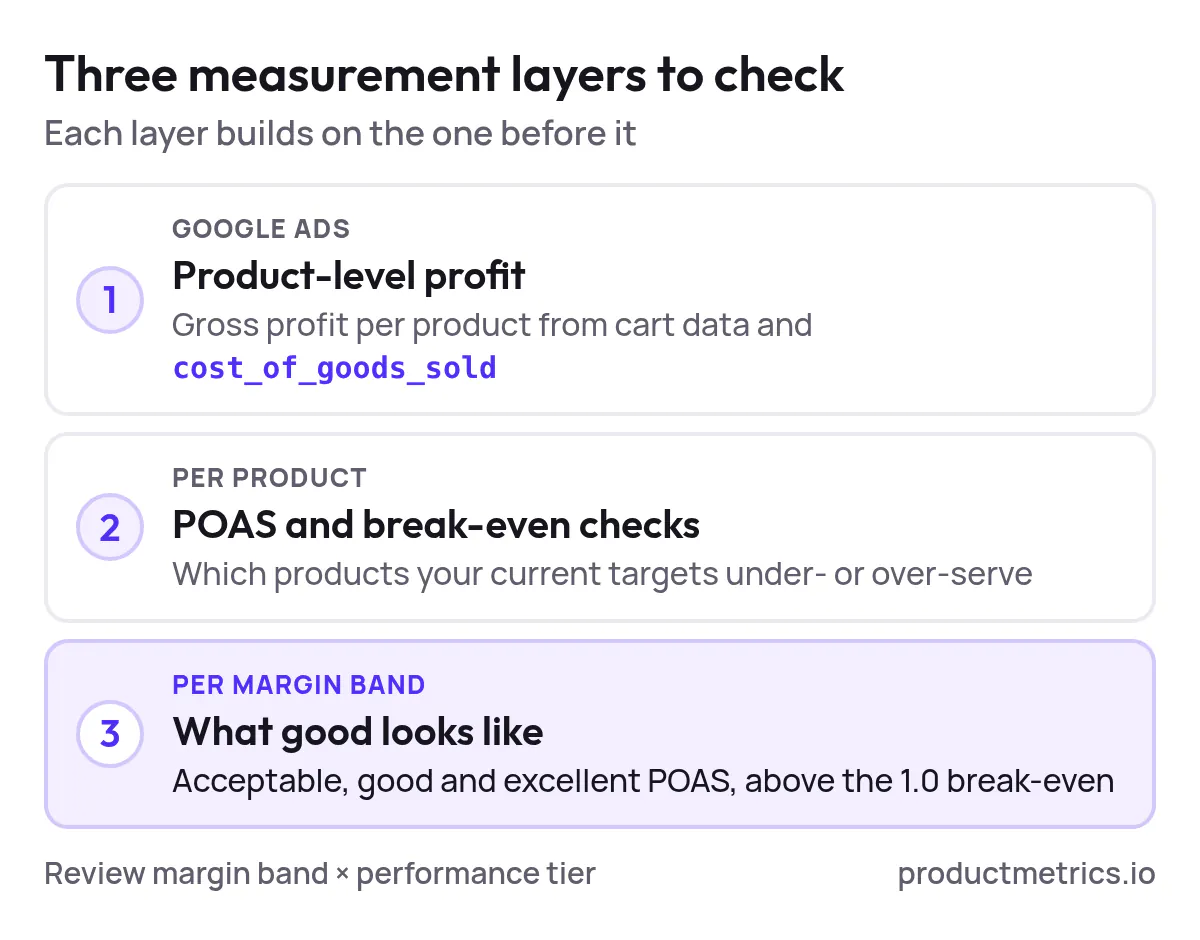
Profit segmentation is only as good as the data it uses. There are three measurement layers to check.
8.1 Product-Level Profit In Google Ads
Google Ads can now report revenue gross profit and gross profit margin per product when you implement conversions with cart data and provide cost_of_goods_sold in the Merchant Center feed. (Source: Google Ads Help – Metrics available with conversions with cart data)
The same cart data metrics are available for Performance Max retail campaigns not just Standard Shopping. (Source: Google Ads API – Retail campaign performance reporting)
That native reporting is a strong base layer even before you add a dedicated profit analytics tool.
8.2 POAS And Break-Even Checks By Product
Once you have margin and cart data in place you can:
- Calculate break-even ROAS per product and see which ones your current targets under - or over - serve. (Source: Product Metrics – Break-even ROAS per product)
- Read POAS per product from Product Metrics or your own warehouse not just ROI per campaign. (Source: Product Metrics – POAS meaning)
The key is to review performance segment by segment: margin band × performance tier not one campaign average.
8.3 Decide What Good Looks Like
A POAS of 1.0 is break-even before overheads; you usually need a higher POAS to cover fixed costs and profit goals. Product Metrics shows how the required POAS rises with your overhead share and margin. (Source: Product Metrics – POAS vs ROAS)
Document per margin band what POAS or ROAS range you consider acceptable good and excellent. Then tie your segmentation rules to those thresholds.
9. Best Practices For Profit-Driven Campaign Segmentation In Google Shopping
To keep profit segmentation sustainable rather than a one - off restructuring, follow these practices.
9.1 Give Each Custom-Label Slot One Owner And One Meaning
Custom labels only become a control surface when campaigns rely on them. Product Metrics recommends assigning each of the five slots a fixed meaning and an owner – for example custom_label_0 for performance segment custom_label_1 for margin band custom_label_2 for stock status – and keeping those meanings stable. (Source: Product Metrics – Shopping and PMax structure by profit)
Changing what a label value means breaks every campaign built on it.
9.2 Avoid Over-Segmentation
Every extra campaign creates another budget and optimisation unit. The structure-by-profit guide from Product Metrics stresses keeping products together until you have enough evidence and a clear decision that requires separation. (Source: Product Metrics – Shopping and PMax structure by profit)
Use labels for reporting first; split campaigns only when a group needs a different target or budget.
9.3 Keep Margin And Cart Data Fresh
- Refresh COGS and variable costs regularly so margin bands remain accurate.
- Monitor cart data diagnostics in Google Ads to ensure product-level profit metrics remain populated. (Source: Google Ads Help – About conversions with cart data)
9.4 Combine Human Rules With ML Segmentation
Machine learning is good at clustering products by clicks and return; humans are good at deciding what to do with each cluster.
Product Metrics’ Product Segmentation uses ML to assign each product to one of six segments by advertising clicks and return (ROAS or POAS) and writes those to Merchant Center custom labels leaving you in control of campaign targets priorities and budgets. (Source: Product Metrics – ML Product Segmentation)
Layer your own business rules – stock seasonality brand strategy – on top of those segments rather than trying to encode everything directly in bid targets.
10. How To Set Up Profit Segmentation For Google Shopping In 30 Days
If you are starting from a ROAS-only setup a practical 30 - day plan looks like this.
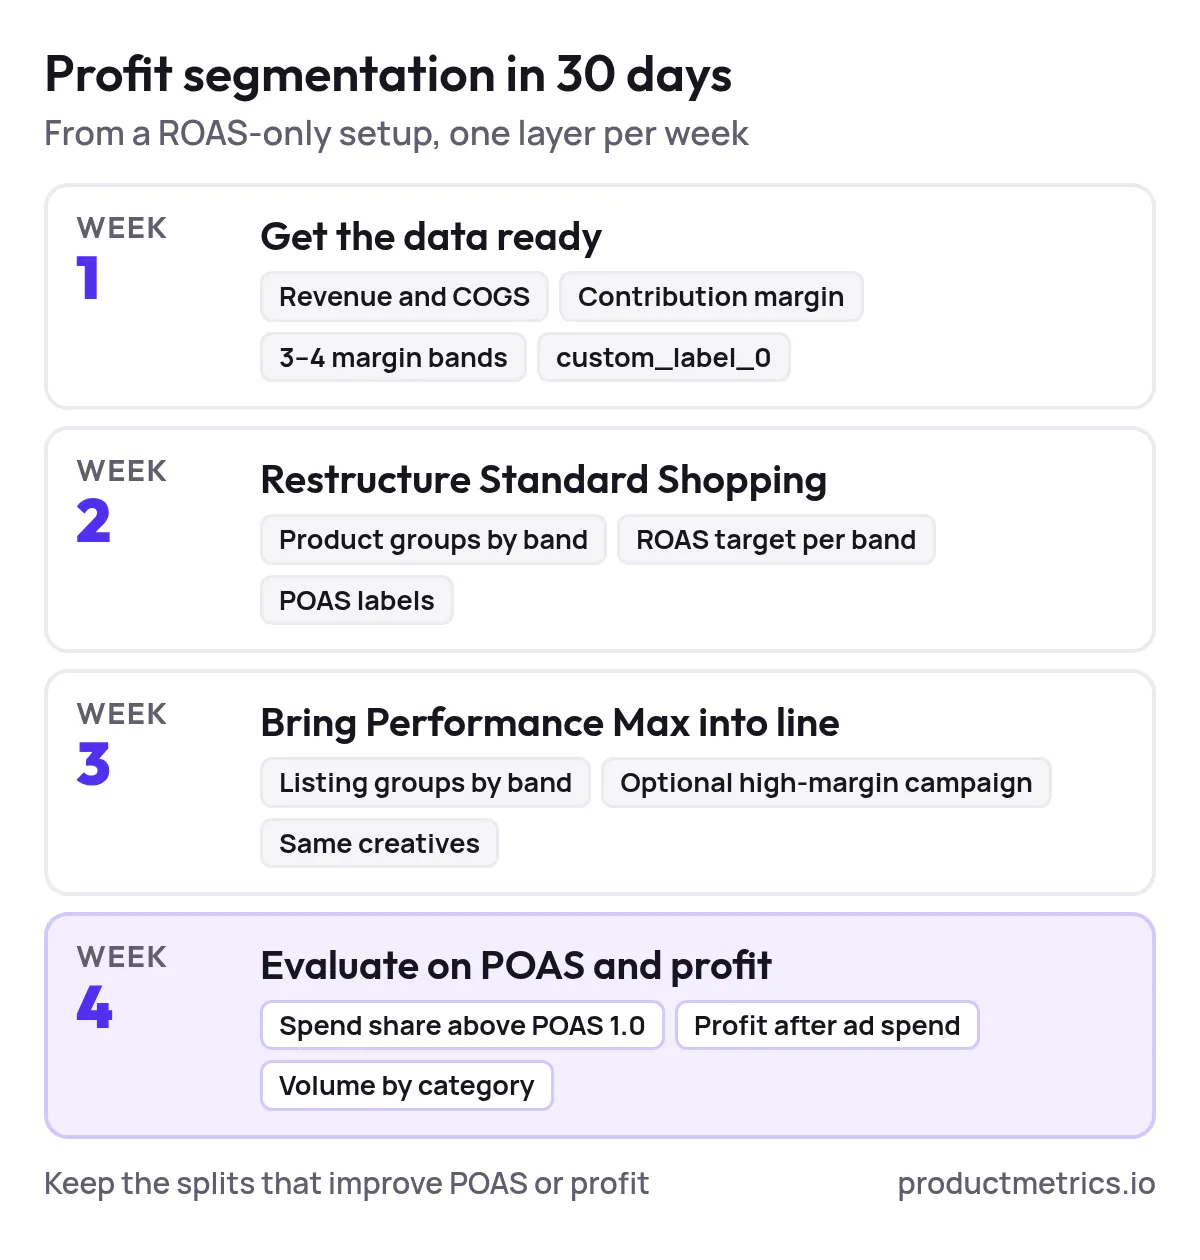
Week 1 – Get The Data Ready
- Export product revenue and COGS from your ecommerce platform.
- Calculate contribution margin per product or per category.
- Define three to four margin bands and label each product.
- Map the margin band into
custom_label_0in Merchant Center or your feed tool.
Week 2 – Restructure Standard Shopping
- In your main Shopping campaign, subdivide product groups by
custom_label_0. - Set differentiated ROAS targets or bids per margin band.
- Add basic performance labels (
poas_abovepoas_nearpoas_below) where you have data.
For step - by - step rules label and script setups see Product Metrics’ implementation playbook on segmenting Google Shopping by product group relevance. (Source: Product Metrics – Implementation Playbook)
Week 3 – Bring Performance Max Into Line
- Subdivide PMax listing groups by your margin label inside the existing campaign.
- If volume allows trial a separate PMax campaign for high - margin high - POAS segments.
- Keep the same creative and audience signals initially; change only the product selection and targets.
Product Metrics’ Performance Max for ecommerce guide shows how to exclude low - POAS products without collapsing volume. (Source: Product Metrics – Performance Max for Ecommerce)
Week 4 – Evaluate On POAS And Profit
- After your typical conversion delay pull product-level reports by margin band and performance tier.
- Compare:
- Share of spend on products above POAS 1.0
- Overall profit after ad spend
- Volume changes in key categories
- Keep the splits that clearly improve POAS or profit at acceptable volume; roll back those that do not.
If you want product-level profit segmentation without building the full pipeline yourself you can send margins and order data to Product Metrics and let it maintain segments and labels for you then plug those labels into your Shopping and PMax structures. (Source: Product Metrics – Product-level Google Shopping optimisation)
11. Frequently Asked Questions On Profit Segmentation In Google Shopping
What Are The Most Effective Profit Segmentation Techniques For Google Shopping Ads?
The most effective techniques are:
- Margin-band segmentation using custom labels
- Performance tiers based on POAS vs break-even
- Profit-aware exclusions for low - margin or negative - POAS SKUs
- Margin-based PMax splits where high - margin products get their own budget and targets
These approaches are reflected across modern Shopping and PMax best-practice guides as well as Product Metrics’ own Google Shopping optimisation content. (Source: Product Metrics – Google Shopping ads)
Should I Exclude Low-Margin Products From Performance Max?
Not automatically. Low - margin products can still be worthwhile if they:
- Drive profitable baskets via cross-sell or
- Are strategically important for range or customer acquisition.
Use conversions with cart data and POAS per product (or per basket) to distinguish low - margin earners from true Drainers then exclude or cap spend on the latter. (Source: Google Ads API – Product reporting for Shopping ads)
What Metrics Should I Track To Evaluate Profit Segmentation Effectiveness?
At minimum:
- POAS per product and per margin band
- Profit after ad spend per product segment
- Share of spend on products above POAS 1.0
- Change in overall profit vs baseline for the same period and season
Product Metrics surfaces these at product and segment level so you can see whether Stars Dogs and Drainers move in the right direction after each structural change. (Source: Product Metrics – Product Segmentation)
12. Where To Go Next
Use this playbook as the strategy layer then plug into deeper implementation and measurement guides:
- Campaign structure: Google Shopping and PMax campaign structure by profit (Source: Product Metrics – Structure by profit)
- Hands-on setup: Implementation playbook for segmenting Shopping by product-group relevance (Source: Product Metrics – Implementation Playbook)
- Measurement: POAS vs ROAS and break-even ROAS per product (Source: Product Metrics – POAS vs ROAS)
Once your first profit segments are live you can let Product Metrics maintain the segments and labels and use its dashboards to see which products to push fix or pause – in Shopping and PMax alike. (Source: Product Metrics – Product Segmentation)
Written by
Berend Vrakking, Founder of Product Metrics
1M+ products analysed · Nominated at the Dutch Search Awards for Best Measurement Campaign (2023) and Best Use of Data (2024)
Keep reading.
Operationalizing POAS: Best Practices, Governance, and Analysis
Operationalizing POAS for Google Ads: one profit definition, profit sent to Google Ads and Meta server-side, products segmented on it and a weekly review.
Ecommerce PPC: costs, metrics and a profit-first strategy
Ecommerce PPC judged by profit: what a click can cost, each product's break-even ROAS, and how to act on it in Google Shopping and Performance Max.
How to improve ROAS: fix products, not the ratio
How to improve ROAS so profit rises too: work per product against break-even, fix margin, returns and tracking, then shift priority and measure with POAS.
See which of your products to push, fix or pause. Start with your own products, or a 30-second estimate.
Check one product first: work out its break-even ROAS in the calculator. Then see where all your products stand.
Questions, or want to spar about your products? Book a demo: a video call with Berend, then a demo account.